
9 Nov 2025
When the House of Delegates reconvenes in January, Democrats will hold 64 seats, the most since 1988. See how control of the House has changed over the past 50 years in VPAP's data visual: ow.ly/vRwz50XoZoK
#VPAP #VPAPVisual #HouseControl #VirginiaPolitics
4
9
42
7,350
3 Sep 2025
🍎 Virginia teacher salaries rose nearly 2% last year—outpacing the U.S. average. See the trends in this Back to School data visual 👉 ow.ly/fAbt50WPEiE
#BackToSchool #DataVisual #VPAP #VPAPVisual
1
2
1,293
12 Nov 2024
Since 2016, 115 of Va’s cities and counties have backed the same party in every statewide election. Meanwhile, 18 areas have switched parties at least once. Head to our website for the full visual breakdown! 📈
ow.ly/4QRC50U5cYw
#VPAPVisual #VaElections #VotingPatterns
1
4
9
1,155
29 Oct 2024
💰Harris is leading in donations from Virginia donors, surpassing former President Trump through mid-October. Get the full, interactive breakdown of the numbers on VPAP’s website! ow.ly/oju750TVn4y
#Election2024 #PresidentialFundraising #DataVisual #VPAPVisual
1
3
7
2,382
24 Sep 2024
🗳️ Early voting for the November 5th elections is underway in Virginia. Check VPAP's website daily to see an updated map of early ballots cast by US House district: ow.ly/BOBe50TuKmZ
#EarlyVoting #VirginiaVotes #VPAP #VPAPVisual
2
9
12
2,743
23 Aug 2024
Curious about how much VA's school districts spend on instruction per student? 📚 Check out today's visual to see the breakdown for FY 2023, comparing teaching costs to other expenses. ow.ly/Rhb750T5i8O
#Education #VirginiaSchools #VPAPVisual

1
3
815
22 Aug 2024
🎒VA's SOL test scores are on the rise since 2021 but still trail behind pre-pandemic levels. Curious about the trends? Explore our interactive data visual tracking scores by subject since 2005. ow.ly/Q9mX50T48Ix
#SOL #Education #Virginia #VPAPVisual
4
580
20 Aug 2024
📚 Teacher pay in Va and across the U.S. has seen minimal growth over the past decade, with inflation adjustments revealing a decline. Explore how Va compares in VPAP's latest data visual. ow.ly/xZzL50T1ZZJ
#BackToSchool #TeacherSalaries #VirginiaEducation #VPAPVisual
3
4
1,079
18 Jul 2024
Candidates for statewide office have started raising money for the 2025 elections. See how much they have raised compared to candidates in previous years in VPAP's latest data visual. ow.ly/AgC050SFhoL
#VPAPVisual #Fundraising #VirginiaPolitics
3
1,042
14 Feb 2024
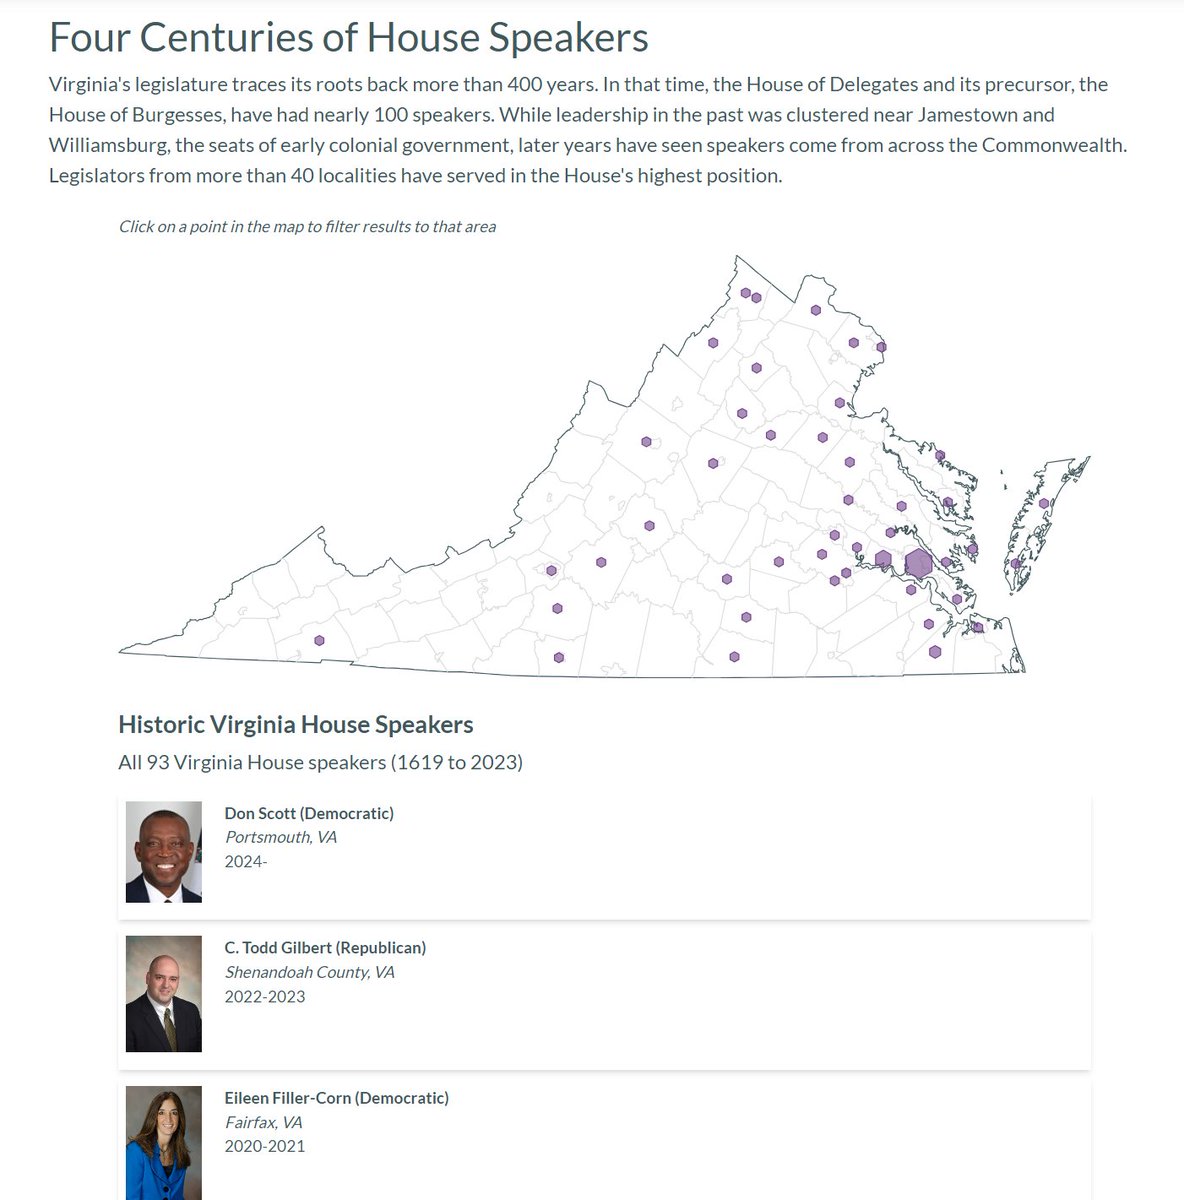
Take a look at over 400 years of Virginia's legislative history, from the House of Burgesses to the present-day House of Delegates, and the legacy of nearly 100 speakers who have guided the state's governance. 📜
ow.ly/YSHW50QABCS
#VirginiaHistory #VPAPVisual
1
4
8
1,221
31 Jan 2024
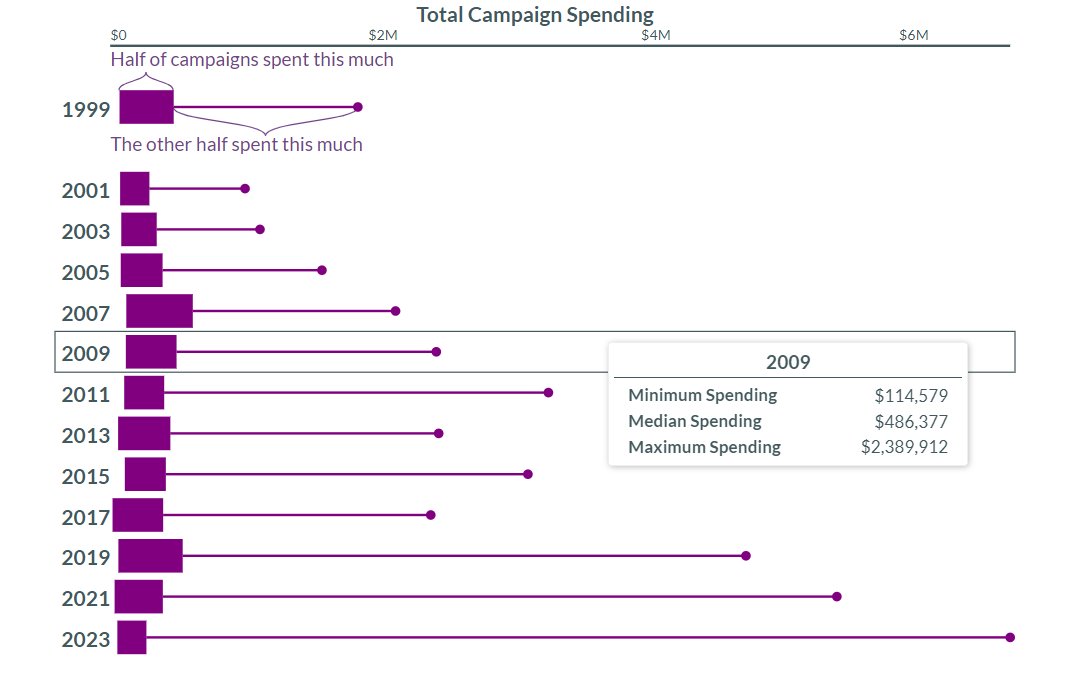
Numbers tell a story, especially in elections! 📣 Discover the changing dynamics of campaign spending in the House of Delegates and State Senate. Want the full picture? 💰Click the link for a deep dive: ow.ly/PwiV50Qw3Lm
#VPAPVisual #ElectionTrends #DataAnalysis
1
4
1,406