
15 Mar 2025
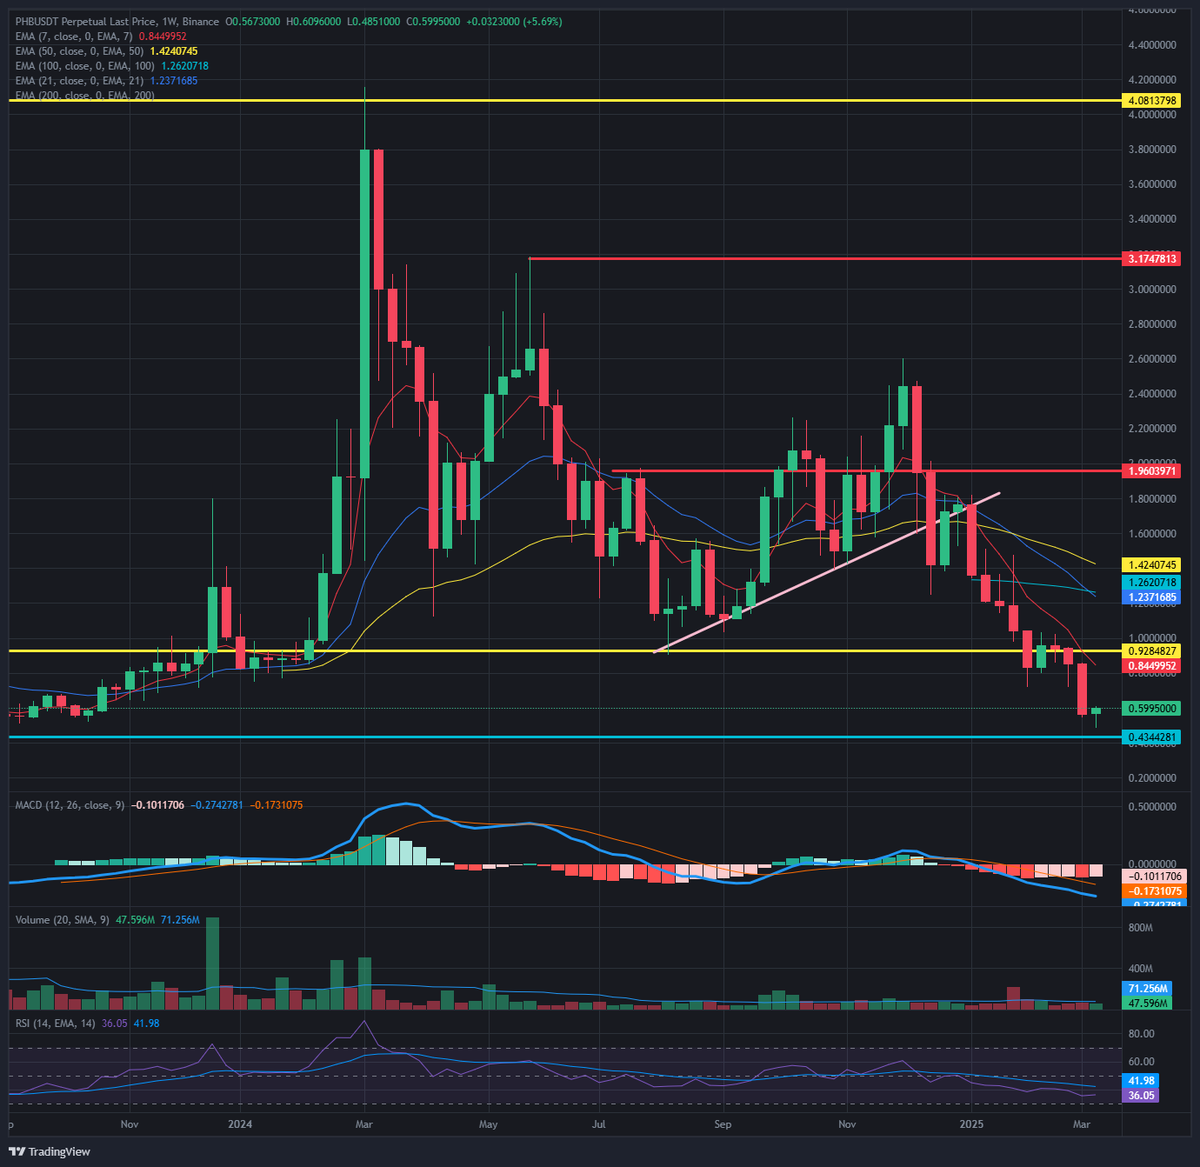
📊 $PHB/USDT Weekly Technical Analysis
Current Price: $0.599 ( 5.69%)
Technical Indicators & Market Structure
Moving Averages (EMA)7 EMA: $0.84 (Immediate resistance)
50 EMA: $1.24 (Major resistance)
100 EMA: $1.22 (Long-term resistance)
200 EMA: Not available, likely above the current price.
MACDDeeply bearish, but the negative momentum is slowing.
Histogram suggests potential stabilization.
RSI36.05 (Oversold region, indicating a potential short-term bounce)
If RSI crosses above 40, it may trigger a minor recovery.
VolumeIncreasing on recent red candles, suggesting capitulation or forced selling.
A bullish candle with strong volume would confirm a reversal attempt.
Key Levels to Watch
Resistance Levels:$0.84 - $1.00 (Short-term resistance, must break for upside potential)
$1.24 - $1.40 (Key resistance, aligning with 50 & 100 EMA)
$1.90 (Major breakout level)
Support Levels:$0.60 (Current minor support)
$0.44 (Last major support zone, must hold to avoid further decline)
Market Outlook & Strategy
Bullish Case:If PHB maintains support at $0.60, a recovery toward $0.84 - $1.00 is likely.
RSI moving above 40 would confirm early bullish momentum.
MACD flattening out could lead to a trend reversal.
Bearish Case:Failure to hold $0.60 could push PHB towards $0.44.
MACD is still in negative territory, suggesting the downtrend is not fully over.
Conclusion: Cautiously Bullish
Short-term relief bounce likely, but confirmation is needed above $0.84.
If $0.60 support holds, a push toward $1.00 - $1.24 is possible.
Failure to hold $0.60 could lead to further downside to $0.44.
🚨 Key Signal to Watch: Break and close above $0.84 would indicate bullish momentum, while a break below $0.60 could extend the downtrend.
1
2
598

6 Jan 2025
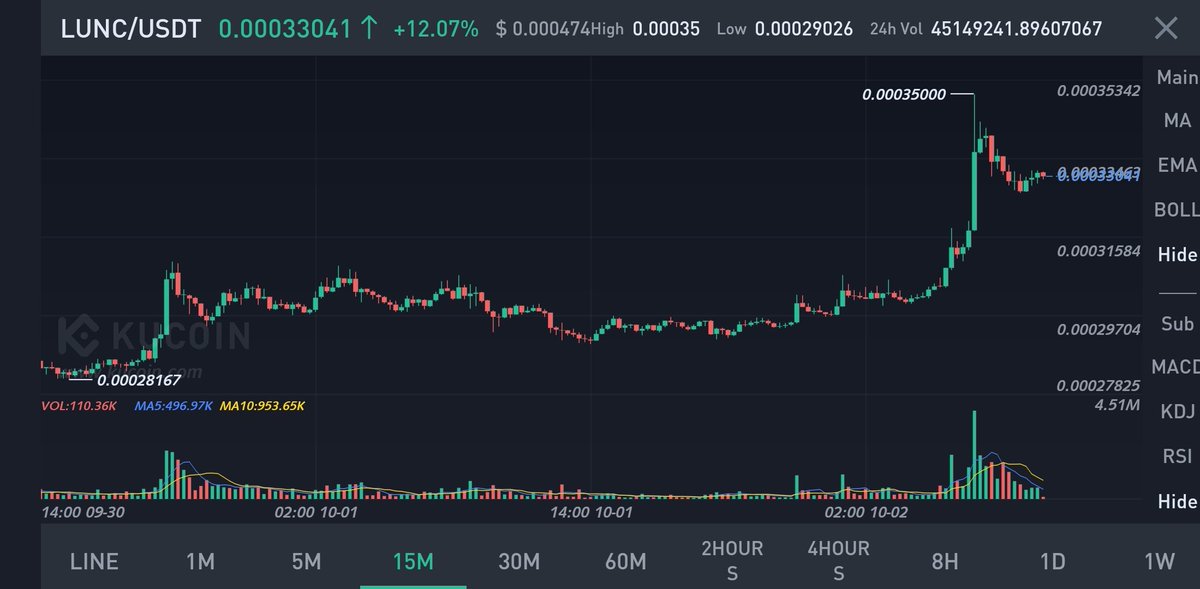
/volumeIncreasing()
// The volume is getting bigger, and so is Buttholeai. The pressure’s building, and we’re ready to rise.
Ca: CezfM41VmjKq1NiMdXcE4uF3yLyqCJMeqZEpFMfcpump
2
2
8
766

30 Jul 2024
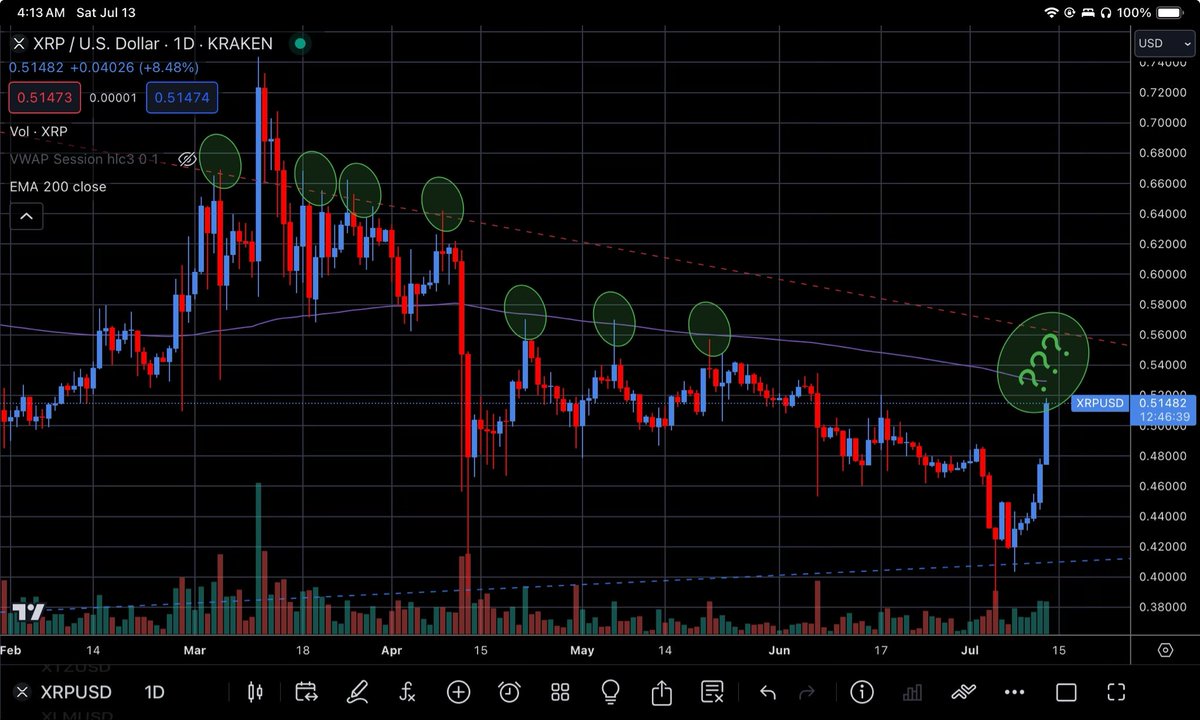
That #VolumeIncreasing and #RisingPrice is great to see for $XRP.
Daily close over 0.67 $USD could start some real fireworks.
#GettingExciting

1
1
6
550
13 Jul 2024
Something to look out for $XRP.
Plenty of reasons to believe a breakout is coming but price action is price action.
It’s a price direction decision point. The #TugOfWar likely begins soon.
Heavy short term buying into resistance usually means the price hits a wall.
I’ve not looked at the order books yet but this might be 2 walls?
#VolumeIncreasing
#SentimentIsHigh but the #CurrentTrend is #Bearish
#Holding
#FoodForThough
5
6
57
11,171


15 Dec 2017
Great meeting today with @jimforcovsouth #JimCunningham regarding the specialist services we provide for our women & children #VolumeIncreasing #FundingCuts #UniversalCredit #MakeAStand #SaveOurRefuges
1
2