
Upgrade Dad's wrist game this Father’s Day. 🕒🎁 Custom photo dials for the watch-collecting dad.
Shop it here: dialcustom.com/custom-family…
Simply upload your photo and we’ll handle the rest.
#WatchDaily #FathersDayGiftIdeas #UniqueGifts #PrintedWatch #GiftsForHim
5

Mar 9
4
46
12 Nov 2025
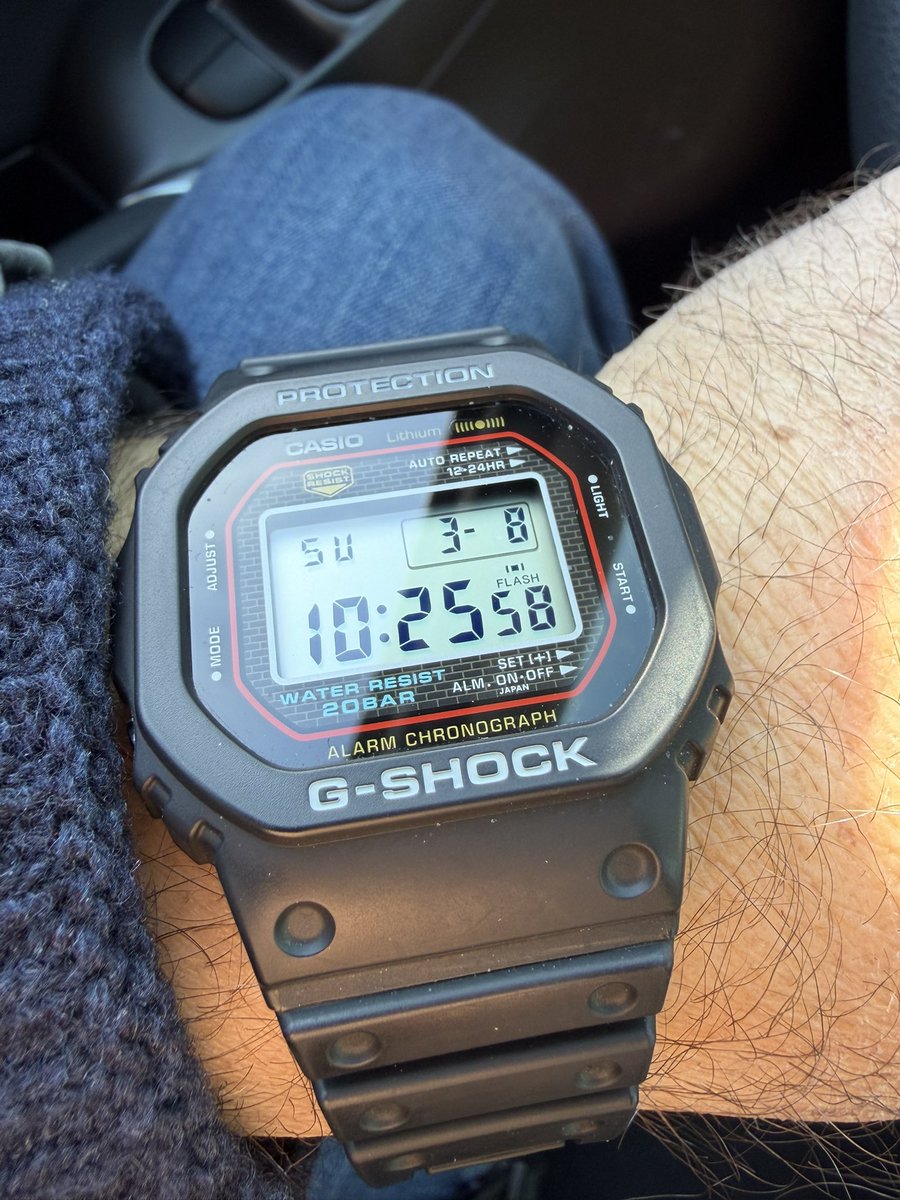
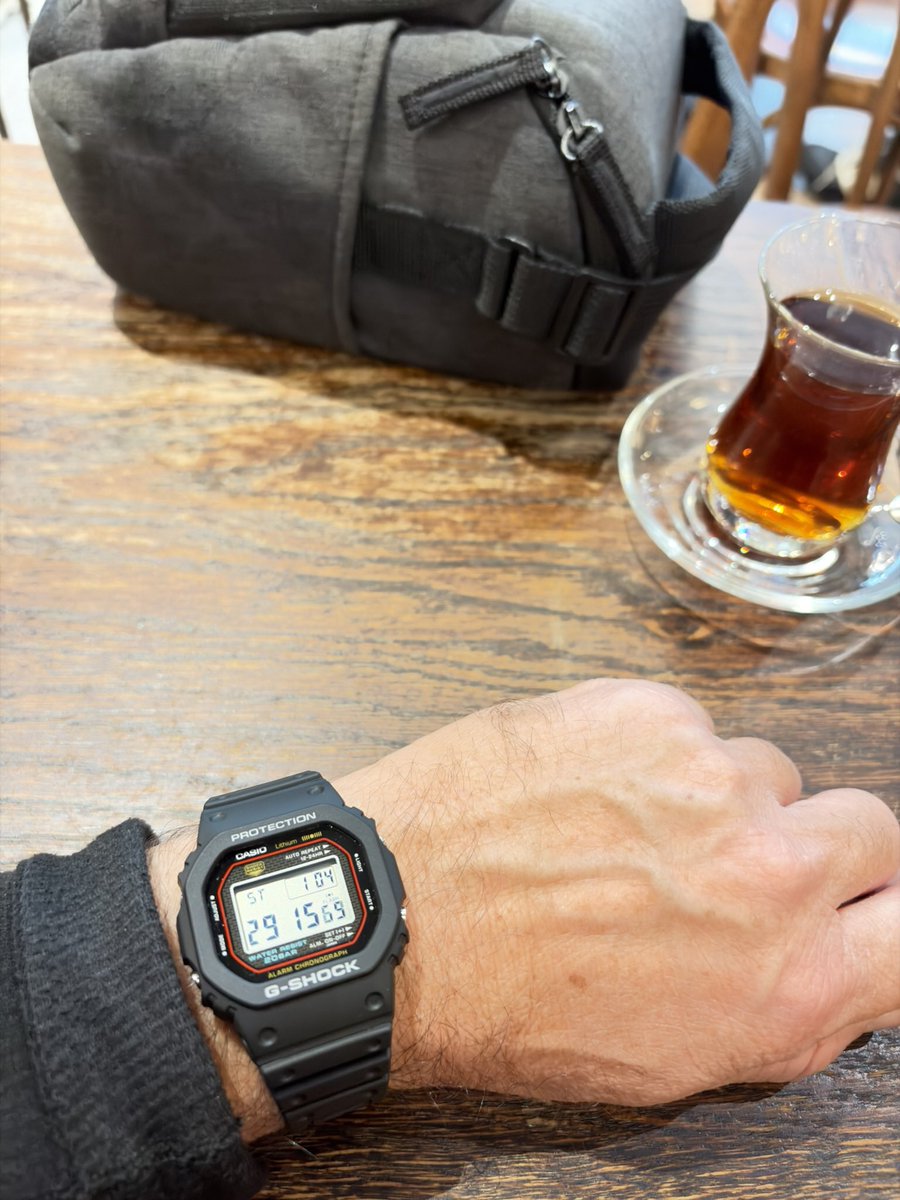
At the cafe nero
#cafenero #GShock #gshocksquad #WATCH #watchuseek #watchdaily #fotografia #photograophy
1
191

12 Jul 2025
instagram.com/p/DL_nPDDTdxT/…
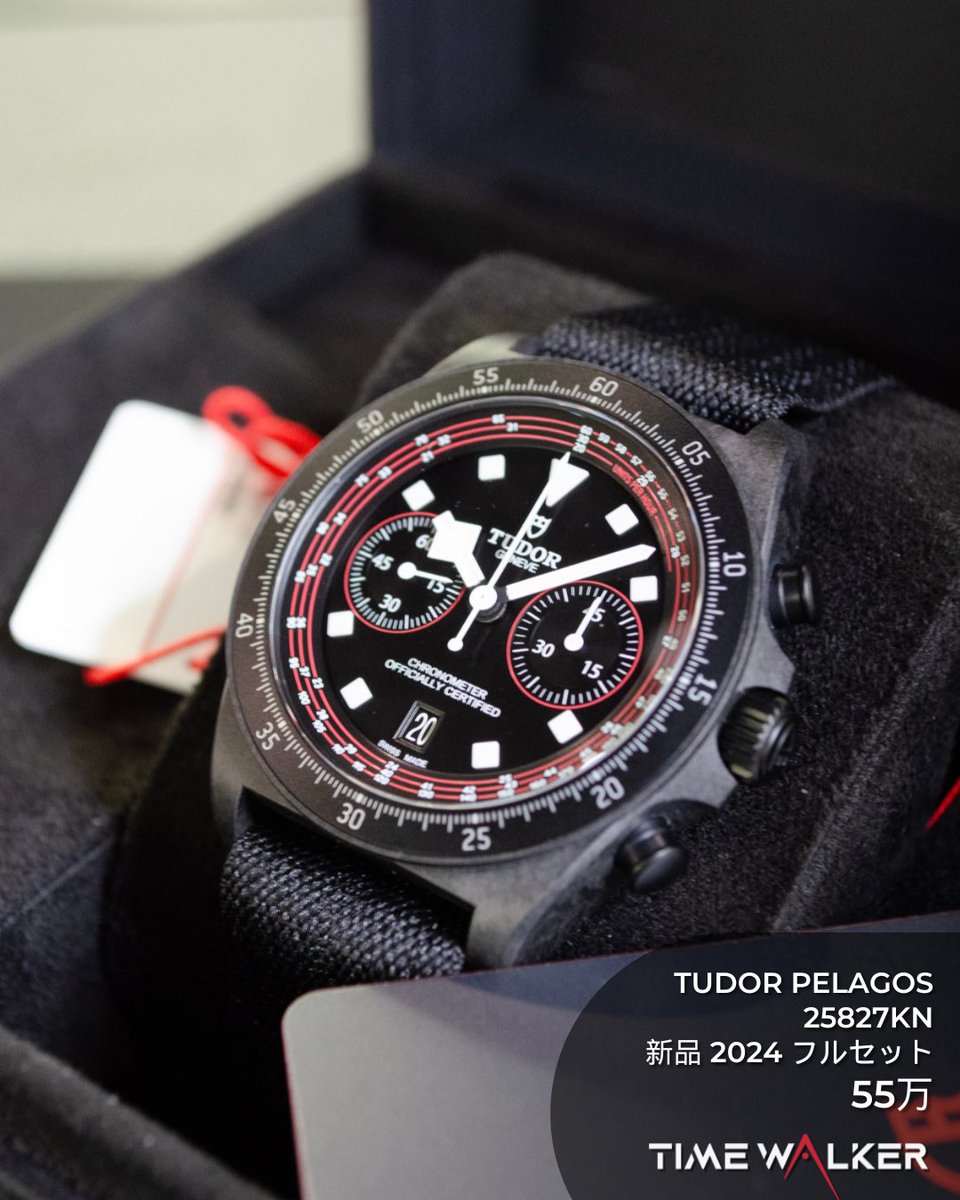
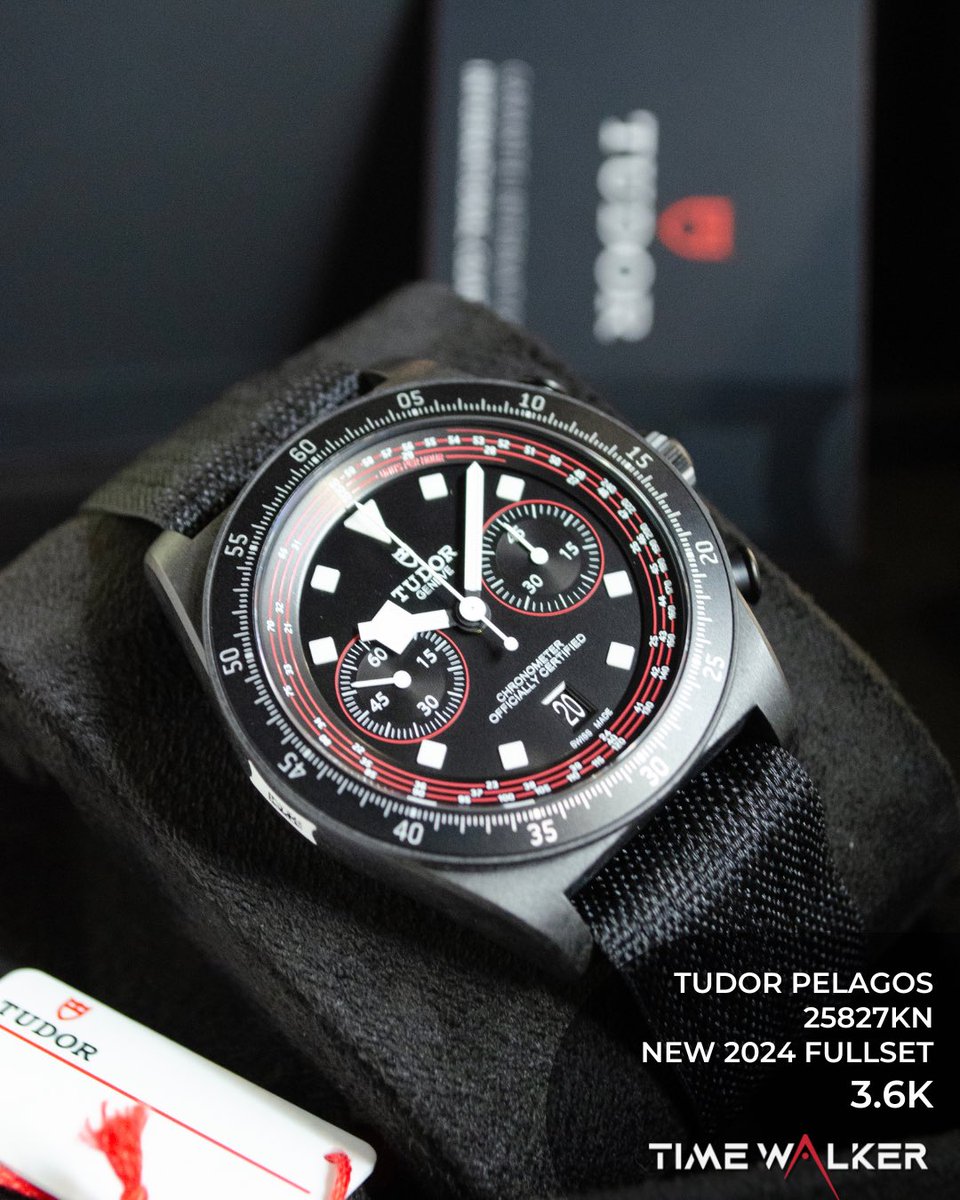
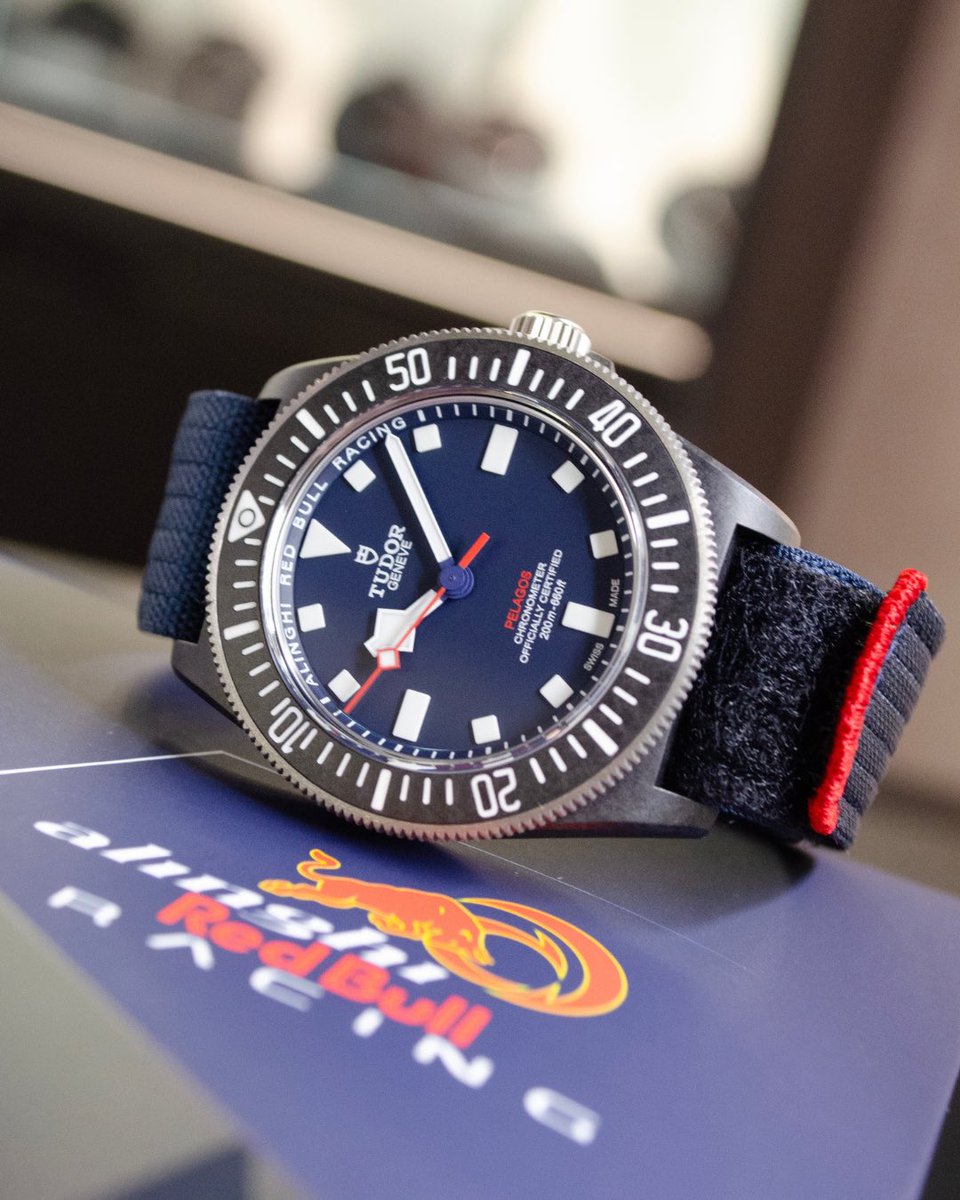
チューダー ペラゴス ブラックカーボンコンポジット製ケース ブラック ファブリックストラップ ブラックダイアル 25827KN 📩詳細はDMでお問い合わせください!
IN STOCK⌚️Tudor Pelagos FXD Chrono 25827KN-0001, Black Carbon Composite Case, Black Fabric Strap. Black Dial! 📩DM us for more information!
⌚️Check out our available watches on our website! Link in bio!
#luxurywatches #tudor #pelagos #watchaddict #watchfam #timepiece #wristwatch #watchenthusiast #watchgram #watchdaily #timepieces #watch #wristwatches


3
618

15 Jun 2025
To all of you that have been asking for white handcut Lace, here you go 👇👇👇👇👇👇👇
Price: ₦180,000
Yardage: 5yards
Send a DM to place your order
#wotd #watchcommunity #omega #swisswatch #watchfreak #swissmade #style #watchlove #watchdaily #watchessentials #wristwatchcheck
8
8
138

11 May 2025
👋
1. How the ozone hole works
Seasonal cycle
Polar stratospheric clouds (PSCs) form in the long, dark Antarctic winter. When sunlight returns in August–September, chlorine and bromine released from human-made chemicals destroy ozone, creating the “hole.” By November sunlight and winds dilute the depleted air and the hole closes.
Because of that cycle, the map for May (late autumn in Antarctica) normally shows little or no hole, exactly what NASA’s Ozone Watch images display this week.
Trend since the Montreal Protocol
Global bans on CFCs under the 1987 Montreal Protocol have cut surface chlorine by roughly half its 1993 peak, and scientific assessments project Antarctic ozone to return to 1980 levels around 2065-2066.
---
2. What happened in 2023 & 2024—and why you heard “largest ever”
Season1-day maximum areaRank (since 1979)Key influences
202310 million mi² (26 million km²) on 21 Sep12th-largestVery cold stratosphere plus extra water vapor from the Hunga Tonga eruption enhanced PSCs.
20248.5 million mi² (22.4 million km²) on 28 Sep7th-smallest since recovery began; 20th-smallest in full 45-yr recordWarmer vortex and continued decline in CFCs; some lingering volcanic influence.
Early-season press or social-media posts sometimes compare instantaneous daily values (which can spike) or focus on different metrics (e.g., depth vs. area), leading to claims that a hole is the “largest ever” even when the seasonal average ranks middle-of-the-pack. NASA and NOAA base their official ranking on the 5-week average from 7 Sep – 13 Oct.
---
3. Current status (May 2025)
Total column ozone over the pole is now mostly >300 Dobson Units, well above the 220-DU “hole” threshold.
The ozone-hole area = 0 mi² for most days since late December 2024, which is normal for the austral summer-autumn period.
In the Northern Hemisphere, the Copernicus Atmosphere Monitoring Service (CAMS) reports an unusually low—but not hole-like—ozone pocket over the Arctic in early 2025, driven by a strong polar vortex.
---
4. Where to get live maps & data
SourceWhat you’ll seeLink path
NASA Ozone WatchDaily true-color and false-color ozone maps, archive back to 1979ozonewatch.gsfc.nasa.gov → Ozone Maps
CAMS global chartsNear-real-time model-analysis of total ozone & 10-day forecastatmosphere.copernicu… → Monitoring Ozone
NOAA South-Pole sondesBalloon profiles released weekly through the wintergml.noaa.gov/obop → ozonesondes
These sites update automatically, so you can save the URLs and check the hole as it develops from late August onward each year.
---
5. Take-aways
1. The hole is not growing right now—May is the off-season.
2. 2024’s hole was smaller than average for the 21-st century, reversing the larger 2023 event.
3. Decades-long healing continues, though year-to-year swings will persist until chlorine levels fall further.
4. High-resolution satellite imagery (see carousel above) remains the best way to visualize the hole’s size; you can download daily PNGs directly from NASA Ozone Watch for sharing or printing.
1
3
310
10 Mar 2025
チューダー ペラゴス、ブラックカーボンコンポジット製ケース、ブルー ファブリックストラップ、ブルーダイアル 25707KN-0001 📩詳細はDMでお問い合わせください!
instagram.com/p/DHAwlF9Bgdm/…
IN STOCK⌚️Tudor Pelagos FXD Chrono 25707KN-0001, Black Carbon Composite Case, Blue Fabric Strap. Blue Dial! 📩DM us for more information!
⌚️Check out our available watches on our website! Link in bio!
#luxurywatches #tudor #pelagos #watchaddict #watchfam #timepiece #wristwatch #watchenthusiast #watchgram #watchdaily #timepieces #watch #wristwatches


2
628

3 Feb 2025
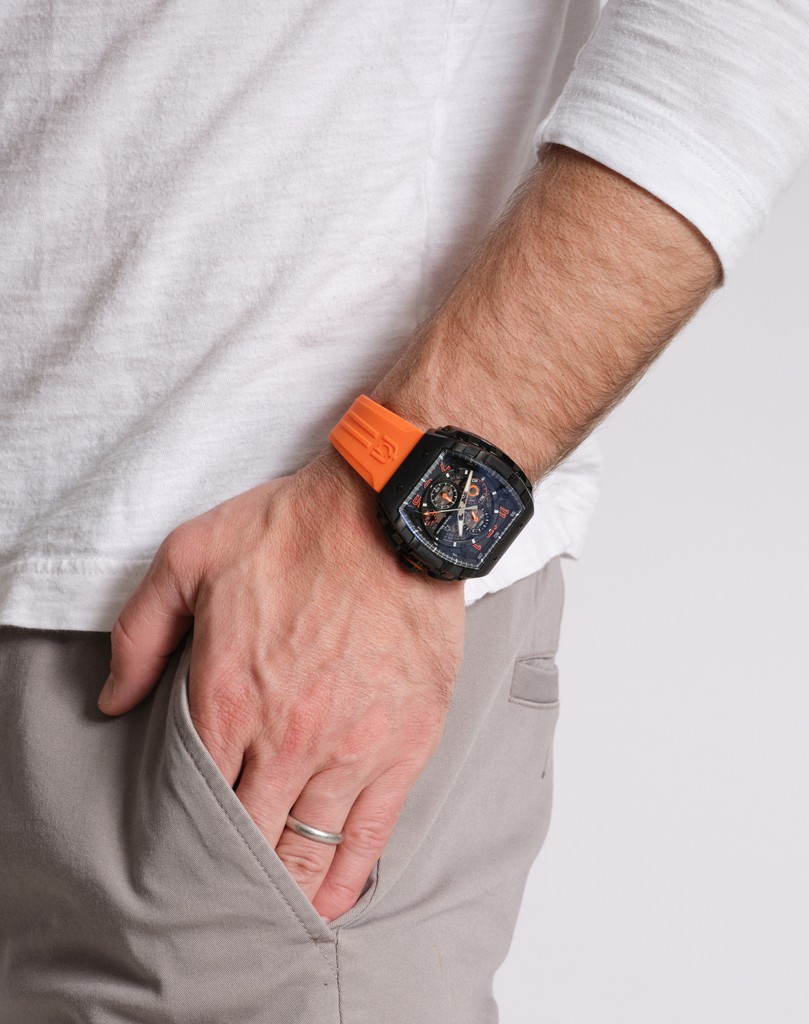
Carlo Men's Chronograph: embrace time with effortless elegance and unmatched precision.
#watchcollector #chronograph #mensfashion #watchmania #watchaddict #watches #newyork #watchgram #watchdaily #giorgiomilano
2

22 Jan 2025
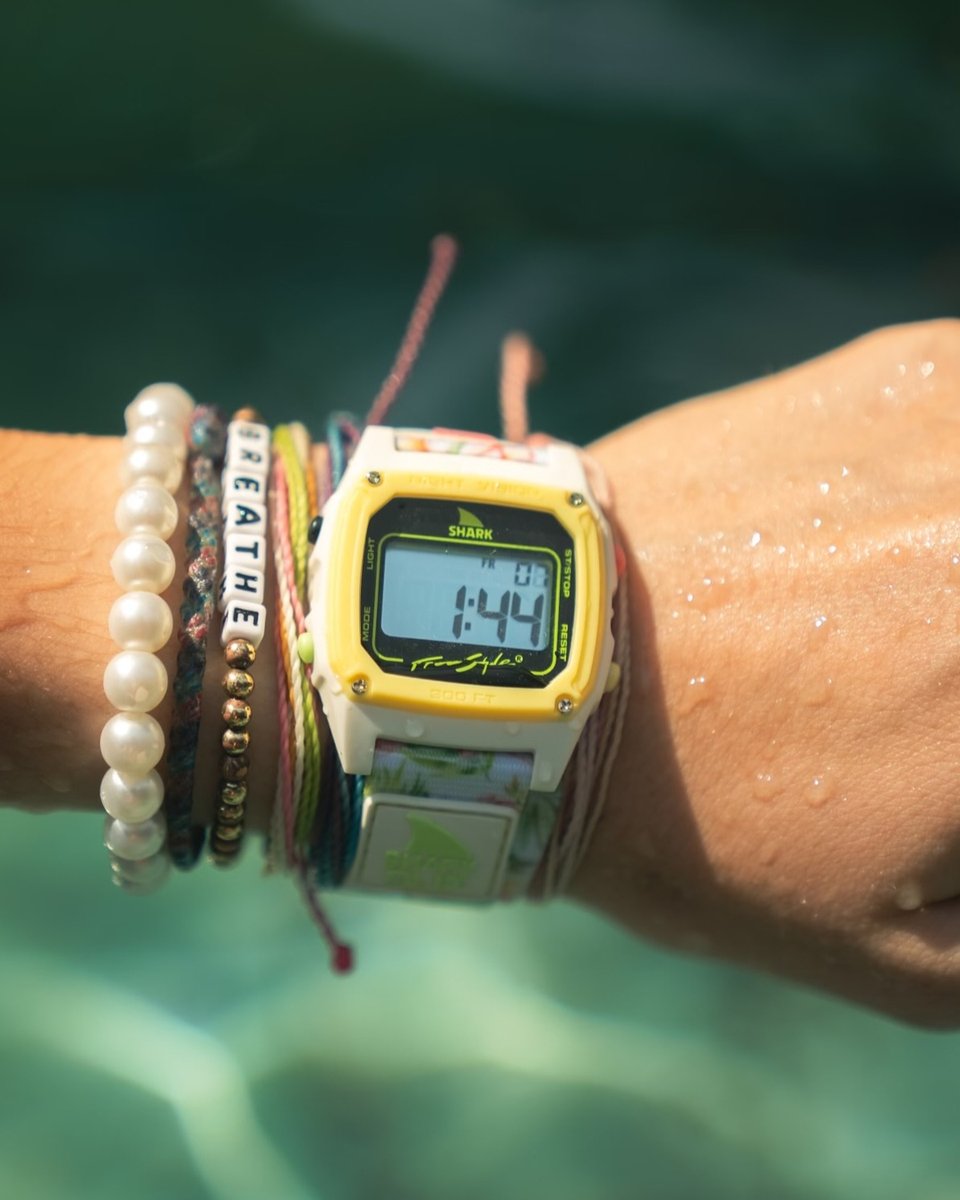
Golden hour, ocean breeze, and the Luke Grey Shark Watch—built for sunsets and good vibes only 🌊✨ #surfwatch #beachvibe #watchlove #beachlifevibes #watchdaily #watchgram #beaching #beachliving freestyleusa.com/products/sh…
2
86
21 Jan 2025
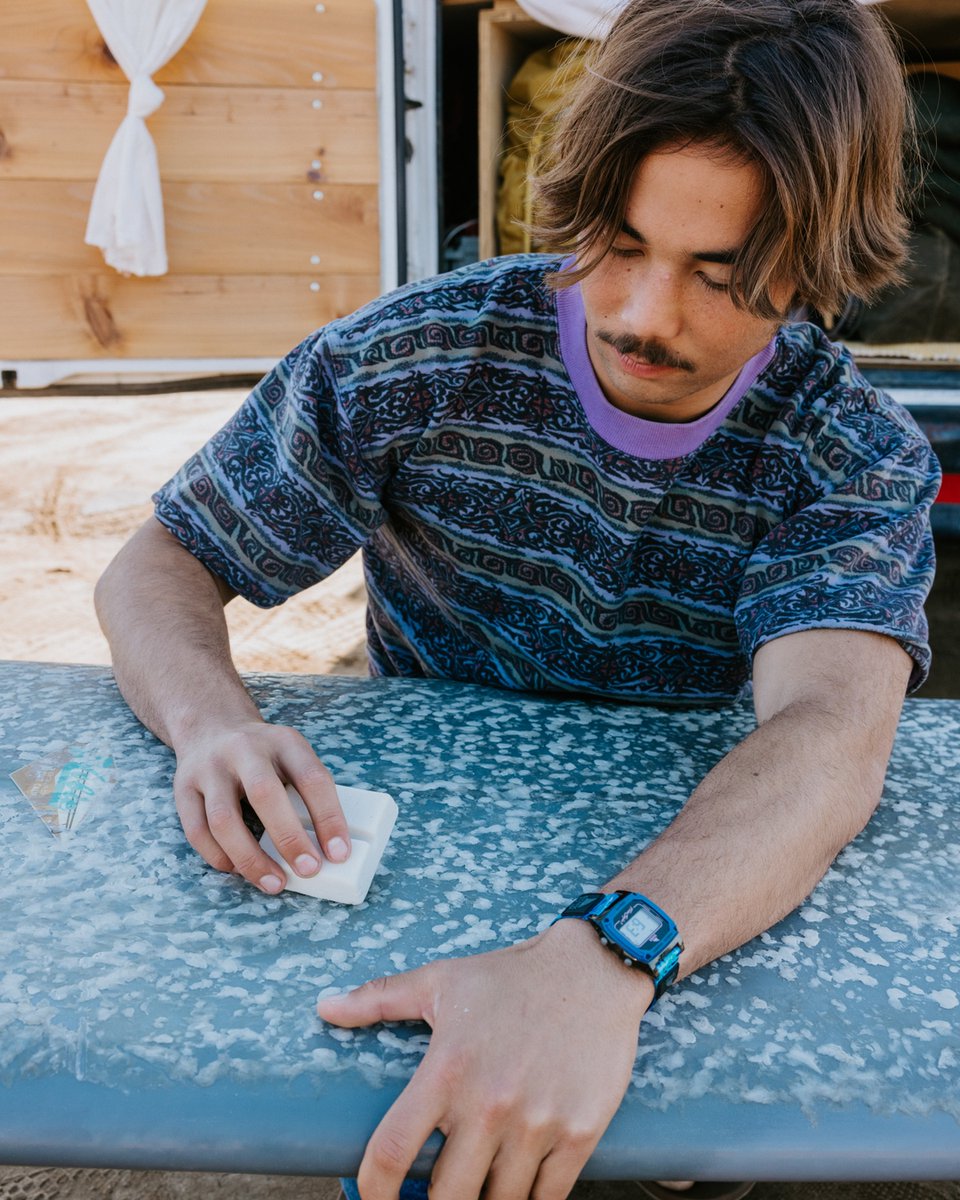
The weather might be cool, but the Octopus Black is turning up the style 🖤 Proof that your wrist game can stay hot no matter the chill 🔥 #watchpics #surfwatch #watchdaily #watchshot #watchlove #watchgram #octopus #coastalcool freestyleusa.com/products/sh…
3
97
19 Jan 2025
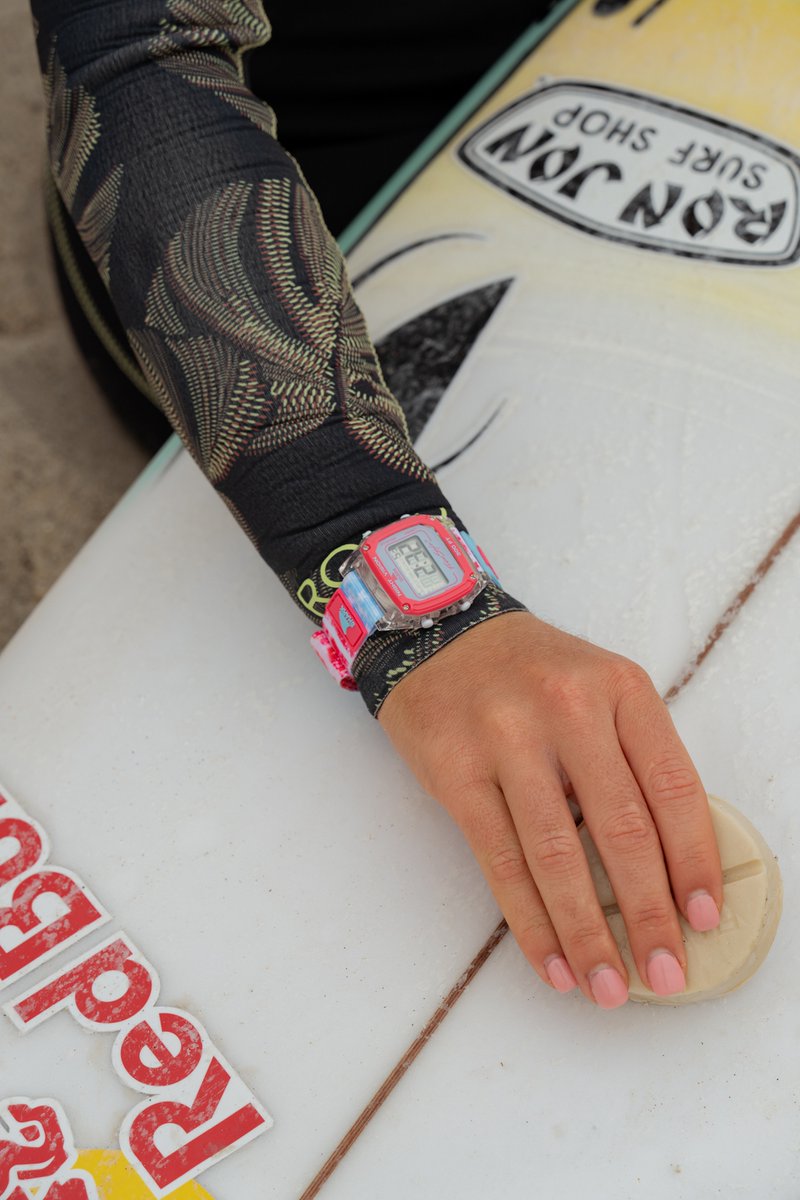
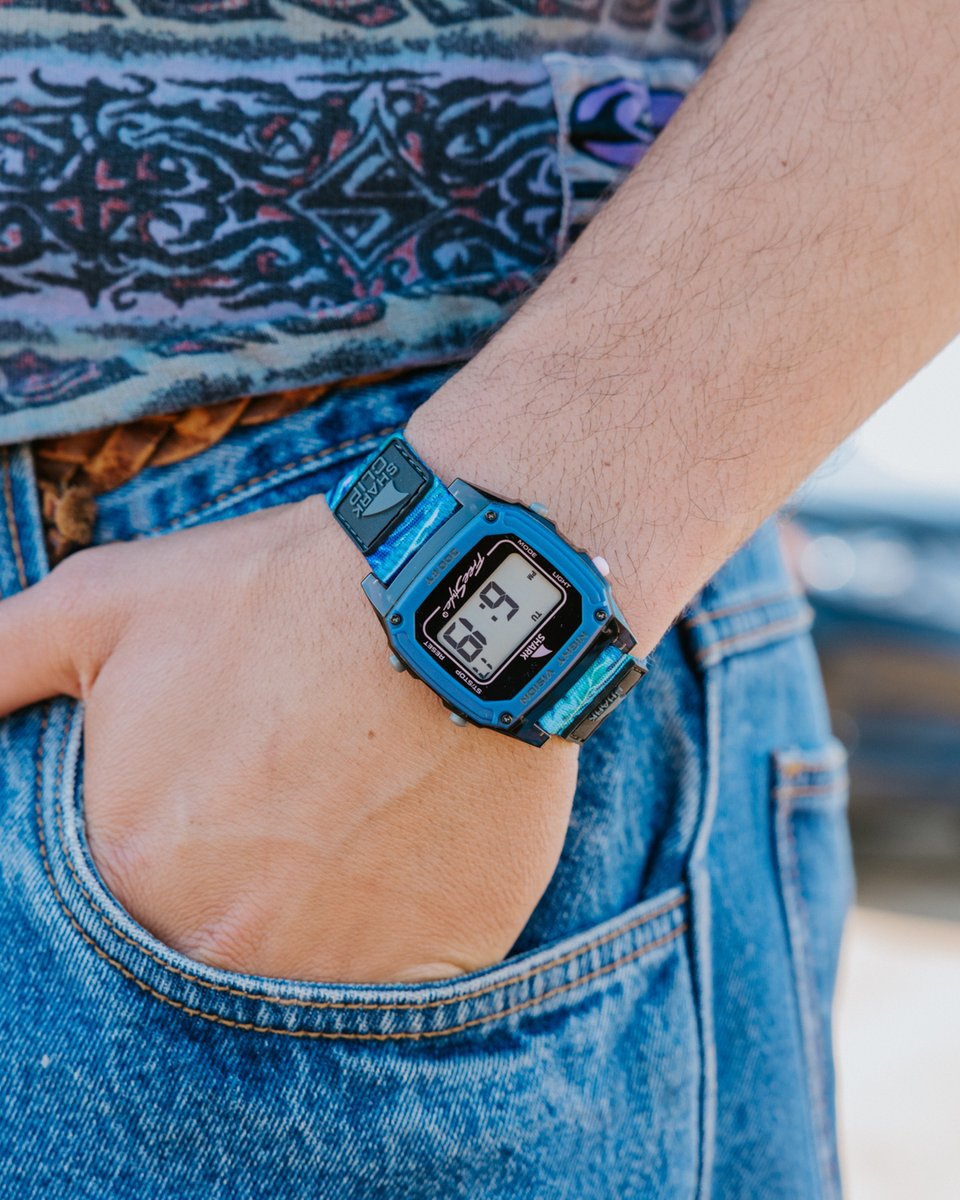
Caroline Marks is bringing the stoke with her Surfin’ USA Shark Watch! 🇺🇸🌊
#carolinemarks #surfingstyle #surfwatch #surfvibes #surfsup #watchdaily freestyleusa.com/products/ca…

2
89
12 Jan 2025
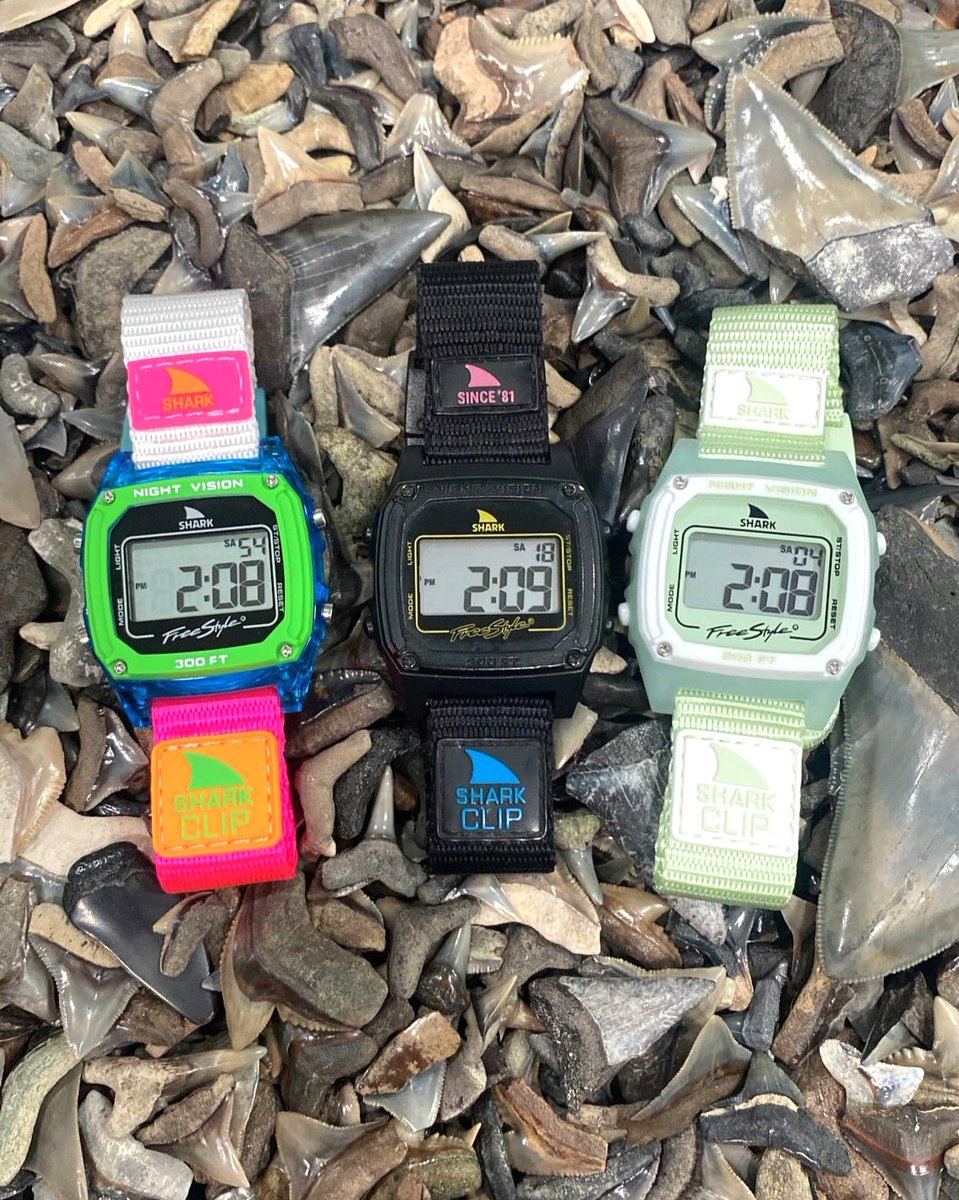
Shark teeth meet Shark Watches. 🦈✨ #watchoftheday #beachlife #sharklover #sharkteeth #surfwatch #watchshot #watchpics #watchlove #watchdaily #sharklovers freestyleusa.com/
4
127
10 Jan 2025
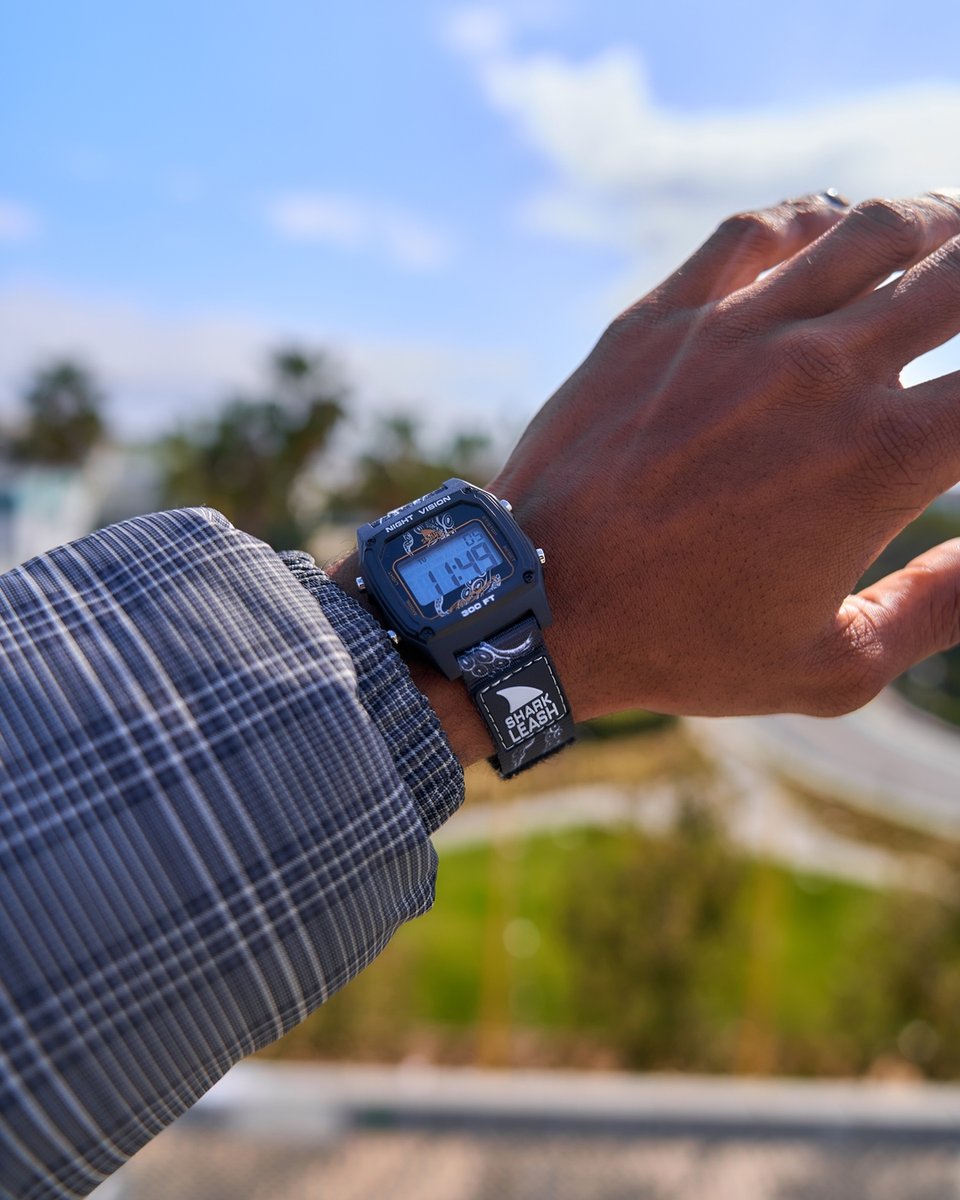
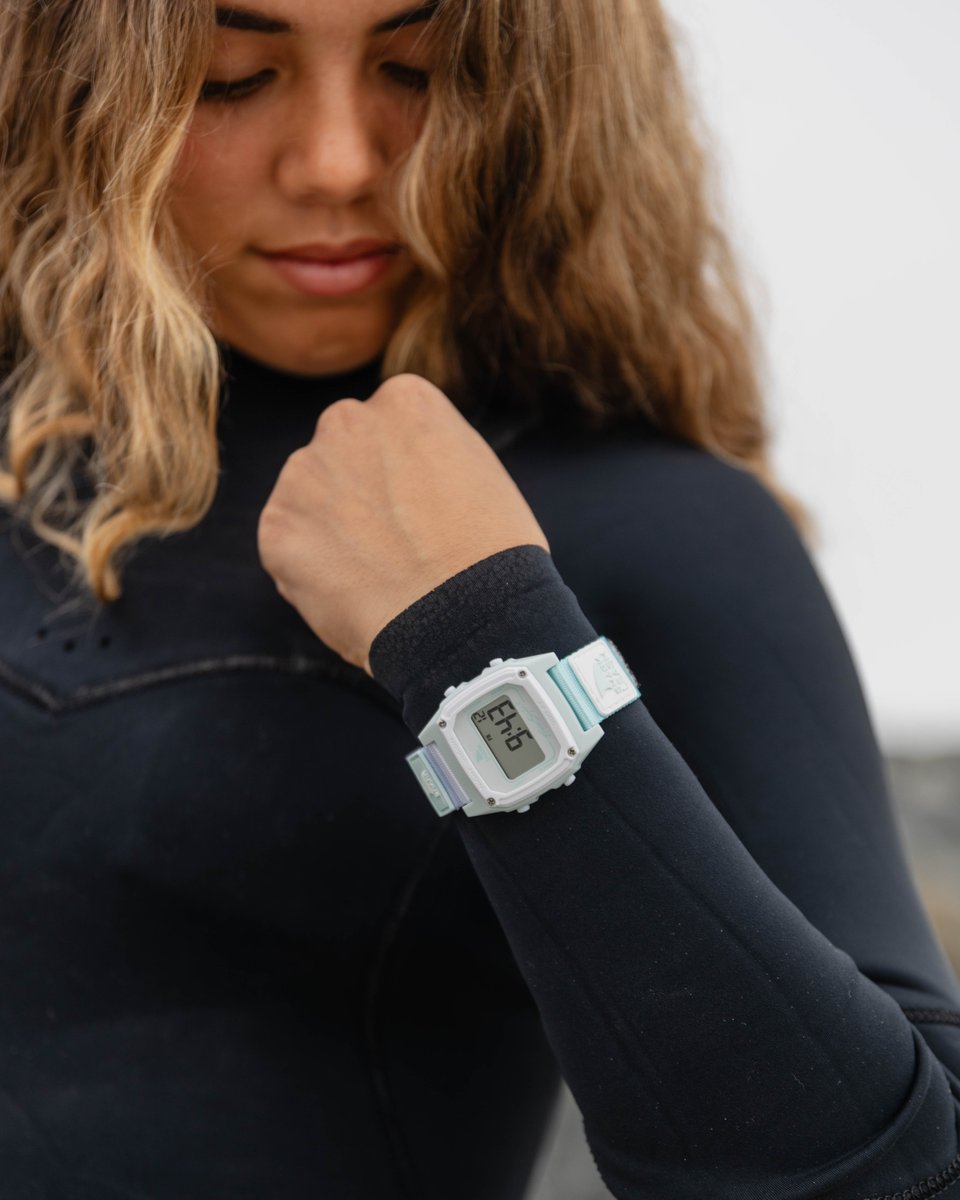
Cold mornings, crashing waves, and the Shark Leash Arctic Rush keeping it cool. ❄️#beachvibes #surflife #oceanlovers #wintersurfs #surfeverydamnday #watchdaily #watchlove #bluewatch #pastelaesthetic freestyleusa.com/products/sh…

3
76
2 Jan 2025
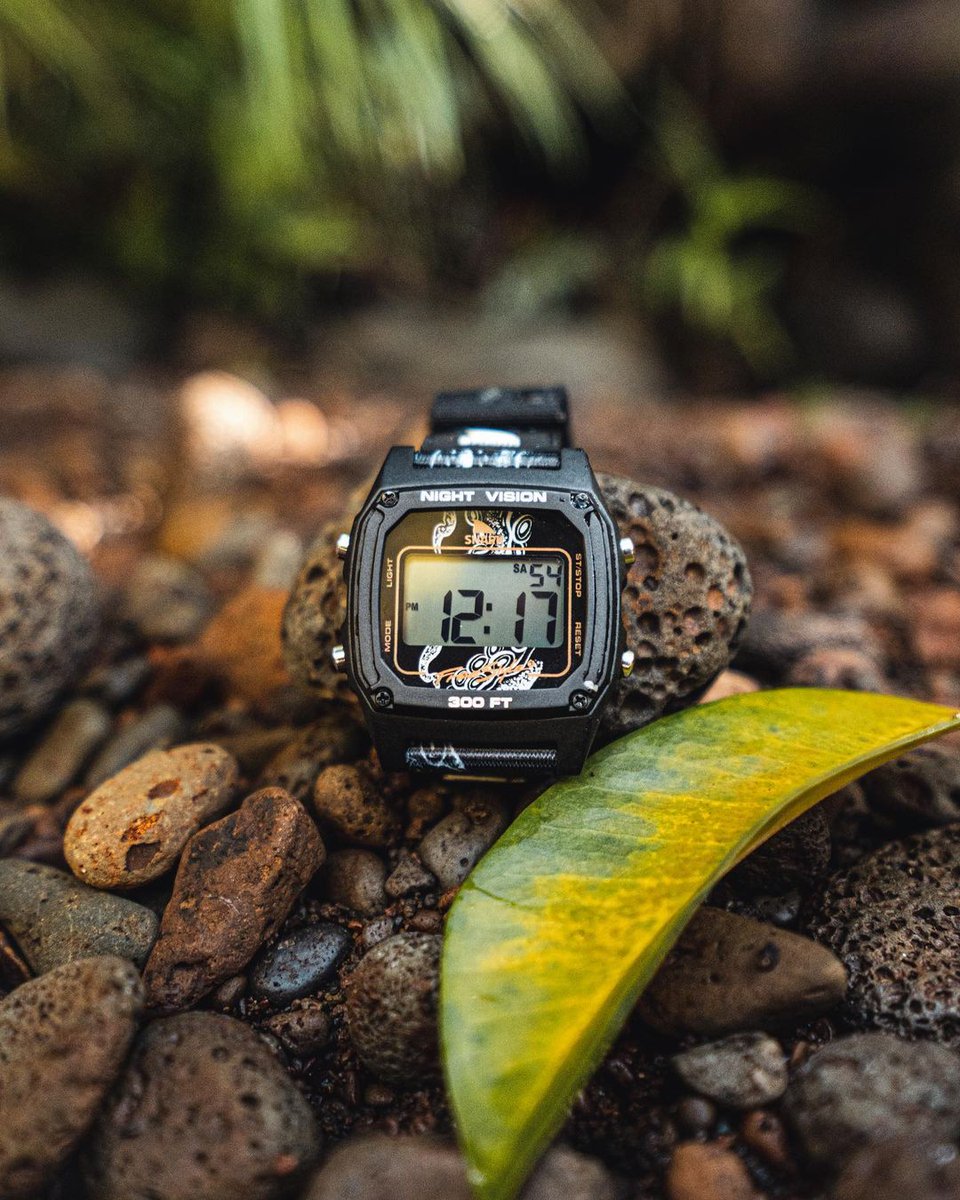
Ready for every adventure, the Octopus Black is a timeless classic. Built for depth, durability, and a touch of bold style—this one’s always in its element 🐙🖤 #watchpics #surfwatch #watchdaily #watchshot #watchlove #watchgram #octopus #coastalcool freestyleusa.com/products/sh…
6
140
28 Dec 2024
Whether you’re chasing waves or catching moments, it’s all about living in the flow with Freestyle Watches 🌊⌚🏄 #surfingstyle #surfsup #surfingtime #surftime #surflifestyle #surfwatch #watchdaily #watchlove #watchshot #watchpics freestyleusa.com/


2
62
25 Dec 2024
Sending warm holiday vibes from all of us at Freestyle USA! Wishing you all peace, joy, and time well spent with those who matter most 🎄✨ #watchpics #watchshot #watchdaily #watchlove #holidaycheer #festivevibes #timeforjoy #peaceandwaves freestyleusa.com/products/sh…

1
44
4 Dec 2024
Bring summer vibes everywhere you go with the Plumeria Shark Watch! 🌺🌴 Now just $49—your wrist just got a whole lot more tropical. Don’t miss out! 🕶️☀️
#watchdaily #watch #surfwatch #plumeria #plumeriaflower #plumerialovers #digitalwatch freestyleusa.com/products/sh…
2
70
2 Dec 2024
Palm trees, good vibes, and the Evening Palms Shark Watch 🌴✨ Your new favorite essential is now just $49—grab it before it’s gone! 🏄♂️
#90sretro #90saesthetic #digitalwatch #watchgram #watchdaily freestyleusa.com/products/sh…
3
81

25 Nov 2024
#WatchDaily ‼️‼️‼️‼️‼️
25 Nov 2024

F1 drivers complain about marijuana smoke while preparing for Las Vegas Grand Prix
1
1
2
21
15 Nov 2024
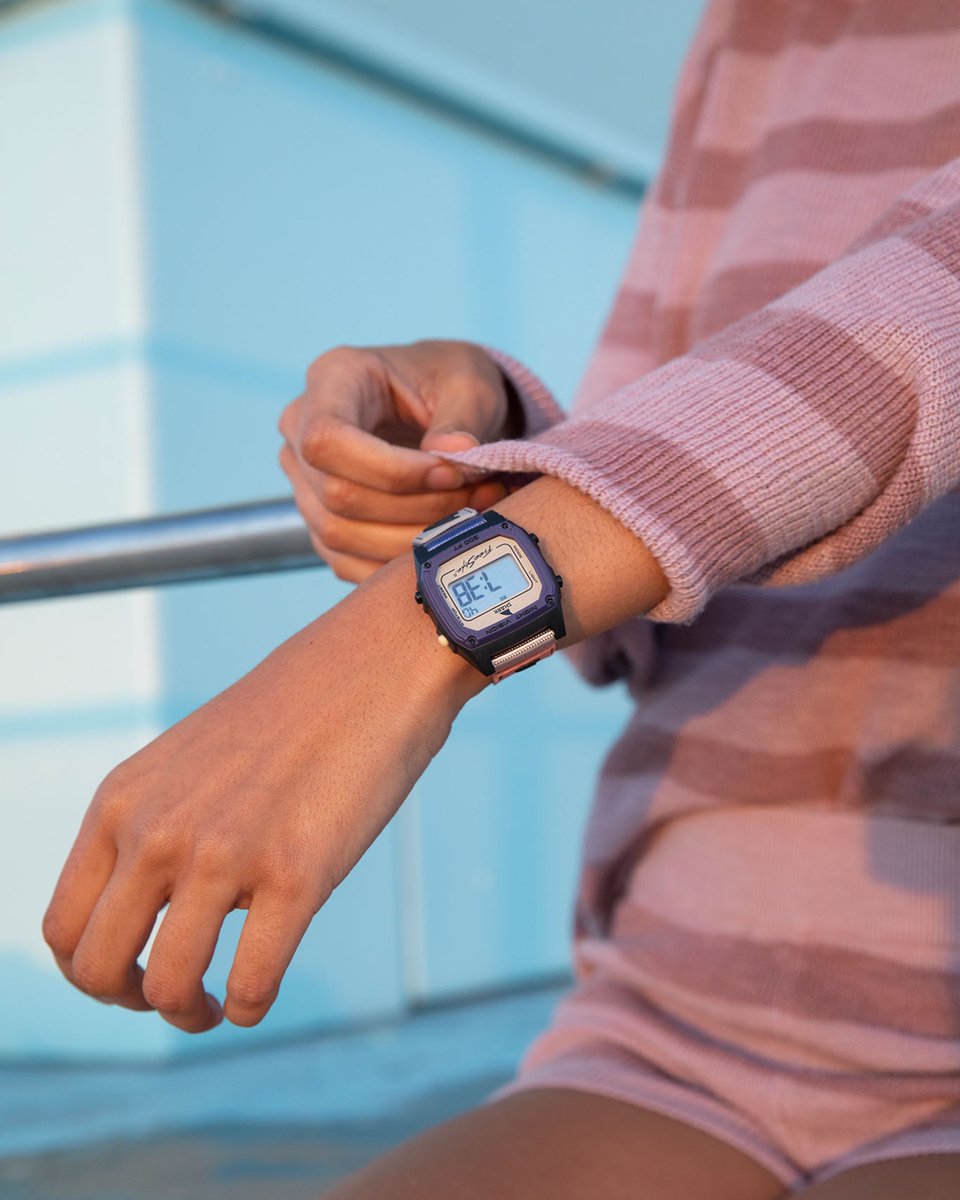
Cozy November moments with the #SharkWatch Indigo Tan. Perfect for sweater weather and autumn adventures 🍂🌊 #watchpics #watchshot #watchlove #watchdaily #surfwatch #sweaterweather freestyleusa.com/products/sh…
2
59