
I’m a huge fan of the 80/20 and been trying to implement it in my trading. I was wondering if you could give a breakdown of the entry model for the repair setup …. or somehow clarify it a bit for us. Somehow backtesting it, it seems unclear when to place a valid entry.
2
T I M I S Z N retweeted

If all your backtesting hits Tp & none hits Sl, you’re doing it wrong.
5
3
14
336
Mich | X retweeted

Personally, i would pick forward testing over backtesting.

Most traders don’t forward test because it takes time and patience.
But backtesting alone won’t give you all the information you need to become profitable, even with a profitable edge.
Learn to forward test too.
That’s where you build confidence, gather real market experience, and discover things backtesting can never show you.
1
1
4
51

9m
Indeed, thats just backtesting though. The real challenge will be Live ahah
1
12

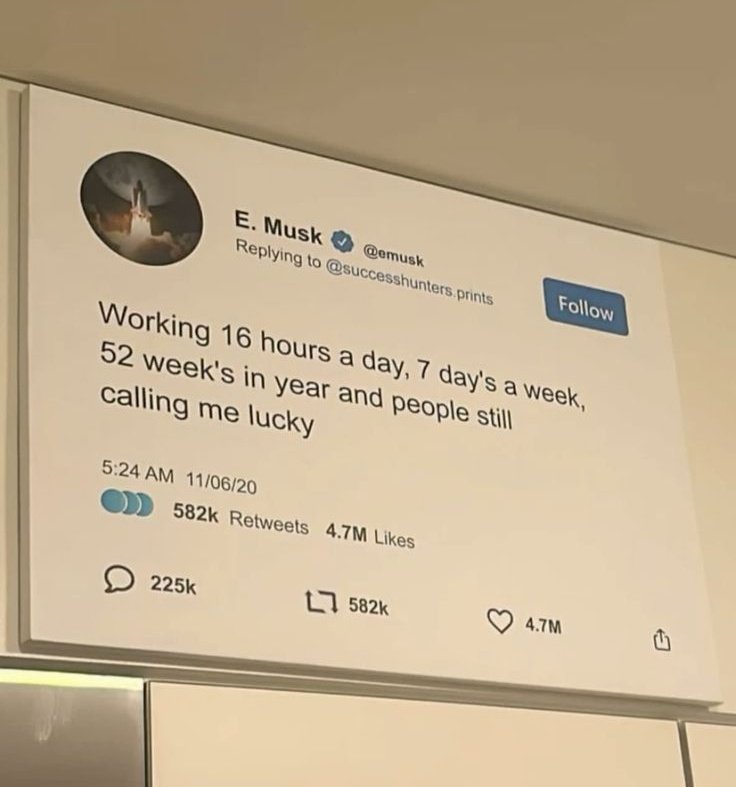
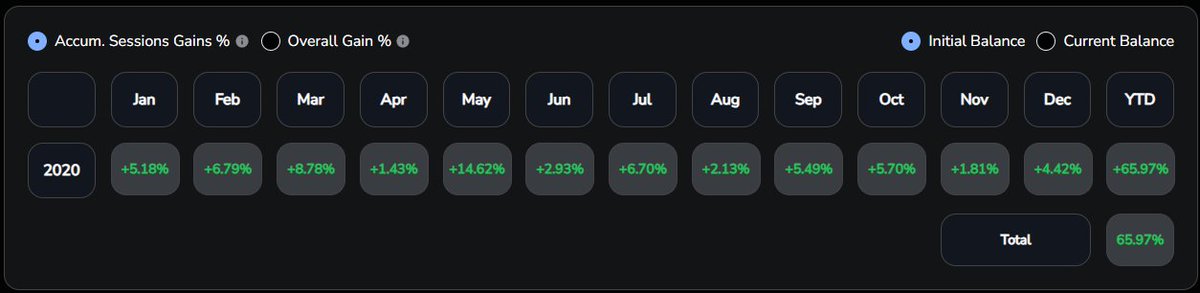
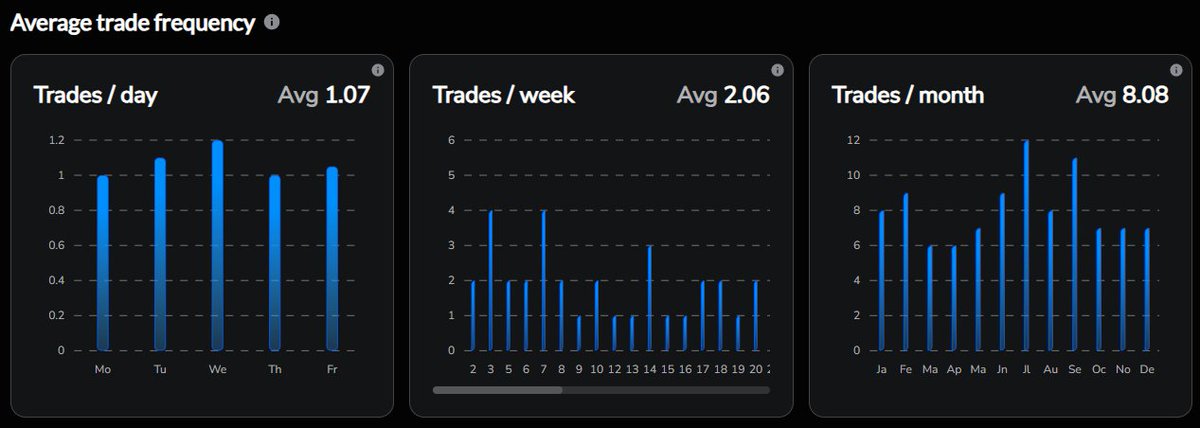
Not a trillionaire but this is the type of time I put in on the charts, backtesting, etc and when those big wins come people think it's "luck" lol
1
2
40
E TRADER📊 retweeted

Backtesting, but can you hold this 49R for 2 Weeks?

19
5
109
4,306

While everyone else is sleeping, I'm backtesting until 3 AM after my 9 to 5 shift. Trading is my absolute obsession, not a hobby. Winning this account means your firm gets a disciplined, relentless risk manager who treats your capital like gold
2


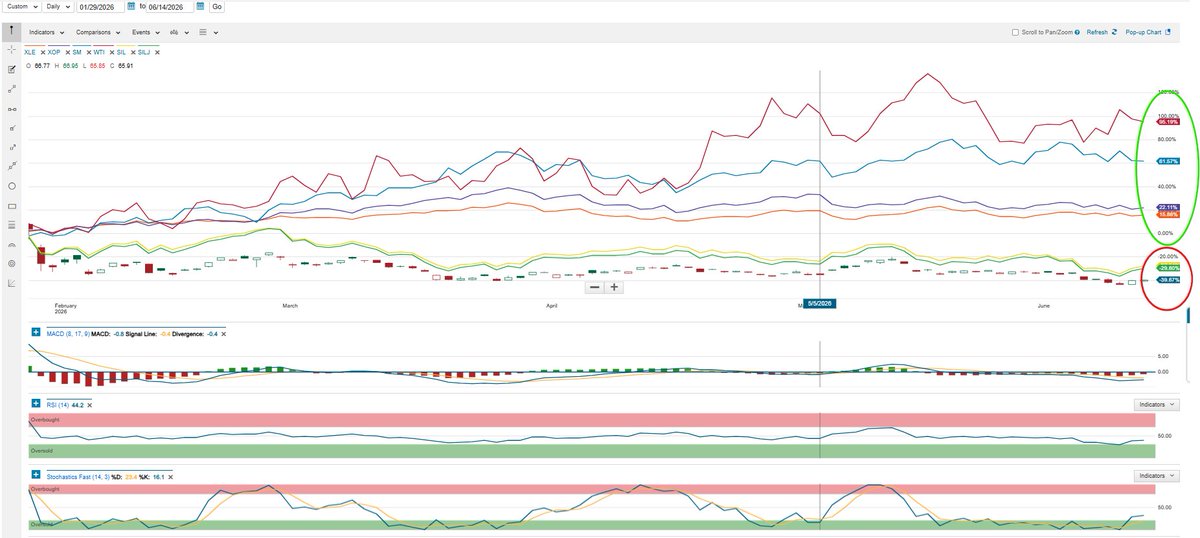
It's amazing how many times I've gotten this sort of response since 1/29. I respond the same each time. The delta continues to grow. It's not luck, it's analysis backed trading with 75 years of backtesting.
Chart of $SLV vs
$XLE, $XOP, $SM, $WTI
$SIL, $SILJ
I've been on this trade literally since 1/29.
"Luck" = 134 % delta for our respective trades sir.
No offense, but I'm not wishing you luck, I'm wish you wisdom and knowledge. Far more valuable than luck.
1
86
Willow Hale retweeted

Jun 12
Backtesting result says 100% win rate
But I didn’t catch any winning trade.
What’s really going on?

49
3
83
2,973


Finally!!!
Premium Popper Pro just got the biggest upgrade since launch — and if you already own the toolkit, it's yours, free, the moment you reload your chart.
Here's what landed.
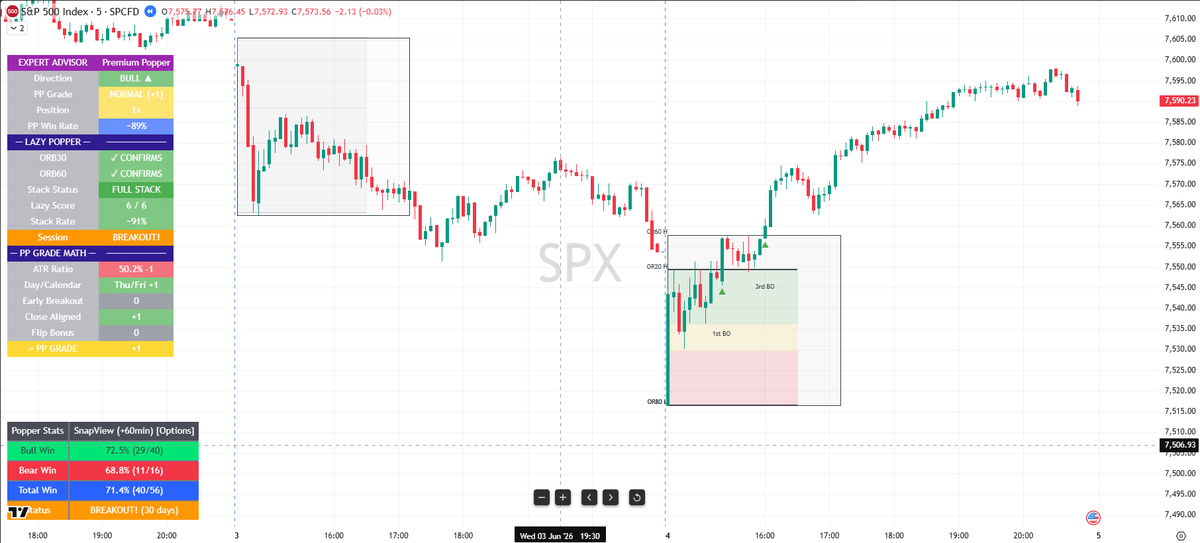
An Expert Advisor panel that grades the setup for you.
For years the Popper showed you where the breakouts were. Now it tells you how good each one is — in real time, before you place the trade.
The new PP Grade scores every setup the instant the opening range locks, using the factors that actually moved the needle across 21 years of SPX data: how tight the range is relative to daily volatility, the day of the week, the calendar (FOMC, witching, month-end), and the timing of the break. You get a clean grade — HALF, NORMAL, PLUS or DOUBLE — and a position-size suggestion to match. No more staring at a breakout wondering "is this one worth it."
The Lazy Popper stacking tracker.
This is the one I'm most excited about. The research showed that when the 20-, 30- and 60-minute opening ranges all break the same way, the odds jump dramatically — and when the 60 breaks against you, it's one of the clearest exit signals in the whole dataset.
The panel now tracks that live. You'll watch it move from PENDING → WATCHING → CONFIRMS as the morning develops, building toward a FULL STACK read or flashing an EXIT when the 60 turns against the move. It's the 21-year edge, on your screen, updating bar by bar.
Plus:
A Trade Flip readout — when a first breakout fails and price reverses, the panel flags the high-conviction flip setup so you don't miss it (or get caught the wrong way).
Three panel layouts — Mobile (just the grade and size, for trading off your phone), Mini (the full panel), and Detailed (shows the exact scoring math behind every grade, so you can see why it called what it called).
How to get it: open TradingView, and the indicator updates automatically. If you don't see the new panel, remove and re-add Premium Popper Pro to your chart. That's it.
A quick, honest word on the numbers you'll see in the panel (the ~89%, ~91% and so on): those are historical figures from 21 years of backtesting — 5,000 trading days. They're there to show you the relative quality of each setup, not a promise about any single trade. Trade them as the high-probability edges they are, manage your risk the way I always bang on about, and let the sample size do the work over time.
Reload your chart and take it for a spin tomorrow morning. I think you're going to like having a second opinion that's read every SPX session since 2005.
Updated Training coming soon...
Trade well, Phil AntiVestor
11


Weekly Recap📅
- Total 15 Trades: 11 W, 1BE, 2L (Eval & Funded)
- got my second funded on Thursday
- keep my win streak alive on the funded
- tilted on Thursday
Biggest takeaway this week:
Rushing the goal near the finish line is extremely dangerous. I got lucky that I didn’t blow the account. My decision making was off because of low energy from night shifts.
First week combining night shifts trading showed me how important a healthy mind is. You can have the best system in the world, but if your body and mind are exhausted, it won’t matter.
I’m already adjusting:
- Optimizing my sleep schedule
- Got blue blocker glasses
- Dropped training volume to 4 days/week so I can regenerate better and do more backtesting/journaling
Progress over perfection. Lesson learned.
Back stronger next week 💪

3
5
84


1
17
Pennies2Riches 🌐 retweeted

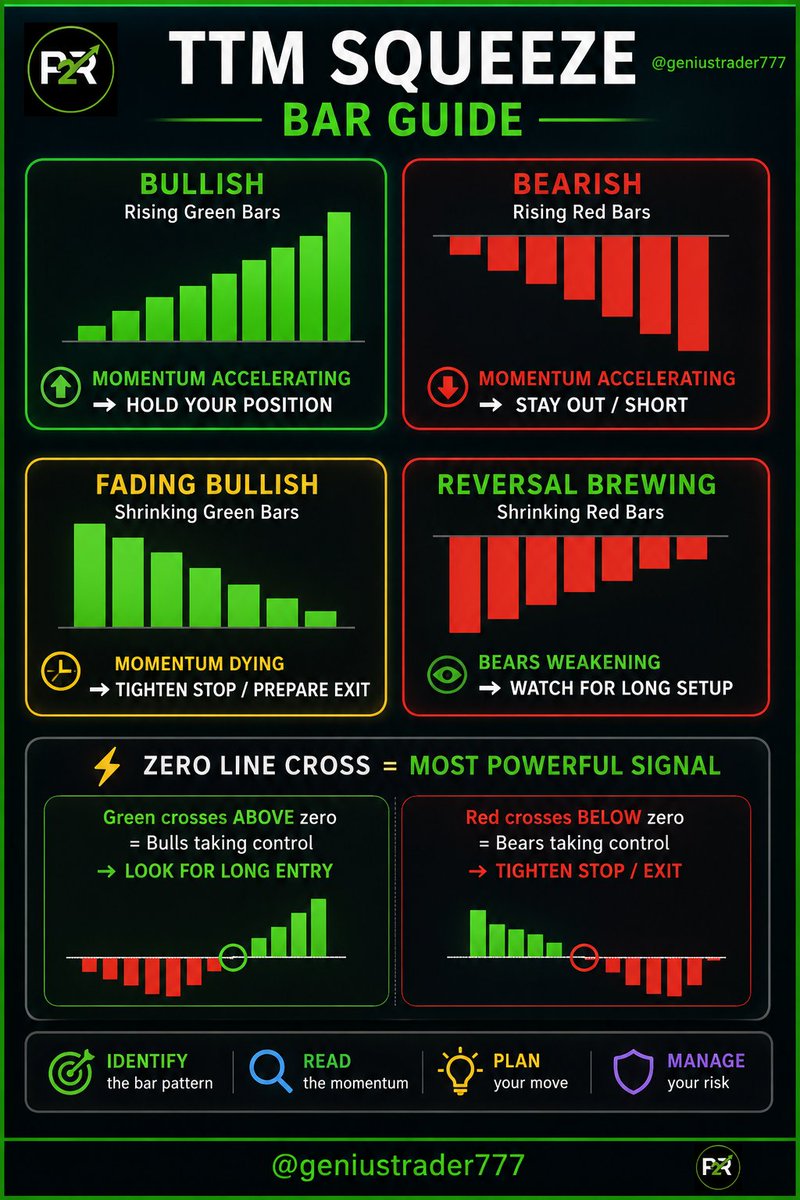
🚨 STOP OVERCOMPLICATING YOUR CHARTS 🚨
I spent a full weekend backtesting every indicator I could find.
Came to one conclusion.
Less is more.
These are the ONLY 4 tools I trade with now and exactly how to use them 👇
#TTMSqueeze #SwingTrading #DayTrading #StockMarket
3
2
2
1,137
Matt retweeted

Backtesting is studying the recipe, the outcome is known already
Forward testing is cooking the meal yourself.
A strategy may look perfect on past charts, but forward testing reveals whether you can execute it when the outcome is still unknown. I really do not backtest.


47
50
423
16,217