
The 32% market share for investor purchases in the first quarter marks four consecutive periods where three-in-10 home sales transactions were non-owner occupied, BatchData found.
By @NMNBrad
nationalmortgagenews.com/new…
1
289

May 24
Once again, the focus on PE in regard to single family housing is just silly.
"In Fulton County, the core of metro Atlanta, the number of single-family homes owned by corporate landlords, much of it PE-backed, doubled from 2018 to 2023,"
Given the actual numbers that represents. 6400 homes out of over 500,000. I'm sorry, PE in housing is simply not a huge issue.
It is in other aspects of business, but that's where the focus should be,not housing.
Key Data Points for Fulton County
Corporate/large institutional ownership of single-family homes doubled from 3,169 homes in 2018 to 6,429 homes in 2023 (per Georgia State University researcher Taylor Shelton and NBC News reporting). These are largely PE-backed or corporate landlords.
Total investor-owned single-family properties (including smaller/"mom-and-pop" landlords) in Fulton County: ~44,835 (as of recent 2025 data from InvestorPulse/BatchData).
Fulton County's total housing stock: ~507,000–535,000 housing units (recent Census/ACS estimates). Single-family homes make up a significant portion (historically ~45–56% detached single-family, or roughly 230,000–280,000 units depending on the exact definition and year).
rightaroundtheperimeter.subs…
2
5
168

Mar 25
The newly released Q4 Investor Pulse Data from BatchData just dropped, and the reality of the US housing market is completely different from what the media is telling you.
Here is what the actual data shows:
📉 Wall Street is SELLING: Institutional investors (1,000 properties) were NET SELLERS for the second consecutive year, offloading 20% more homes than they bought in 2025. They own just 2.19% of investor-held homes.
🏠 Mom & Pop Dominate: Small investors (1-10 properties) hold a massive 96% of all investment properties in the US.
💸 The Affordability Factor: Investors aren't crowding out everyday buyers on turnkey homes. The average investor purchase price in Q4 was $426K—well below the $534K national average. They are buying distressed, value-add properties.
🔄 Returning Inventory: 62% of homes sold by investors go straight to traditional homebuyers. They are fixing up aging inventory and bringing it back to the market.
So why did investor market share hit 32% in Q4? Because everyday buyers retreated from the market, NOT because of an investor buying surge. In fact, total investor purchase volume actually fell 15% YoY.
Stop trusting the headlines and start looking at the data. 📊
Dive into the full 40 page Q4 Investor Pulse report here: batchdata.io/investor-pulse-…
#RealEstate #HousingMarket #Data #RealEstateInvesting #Economy #PropTech
2
41

I wonder what it was in 1990 or 2000. Half that?
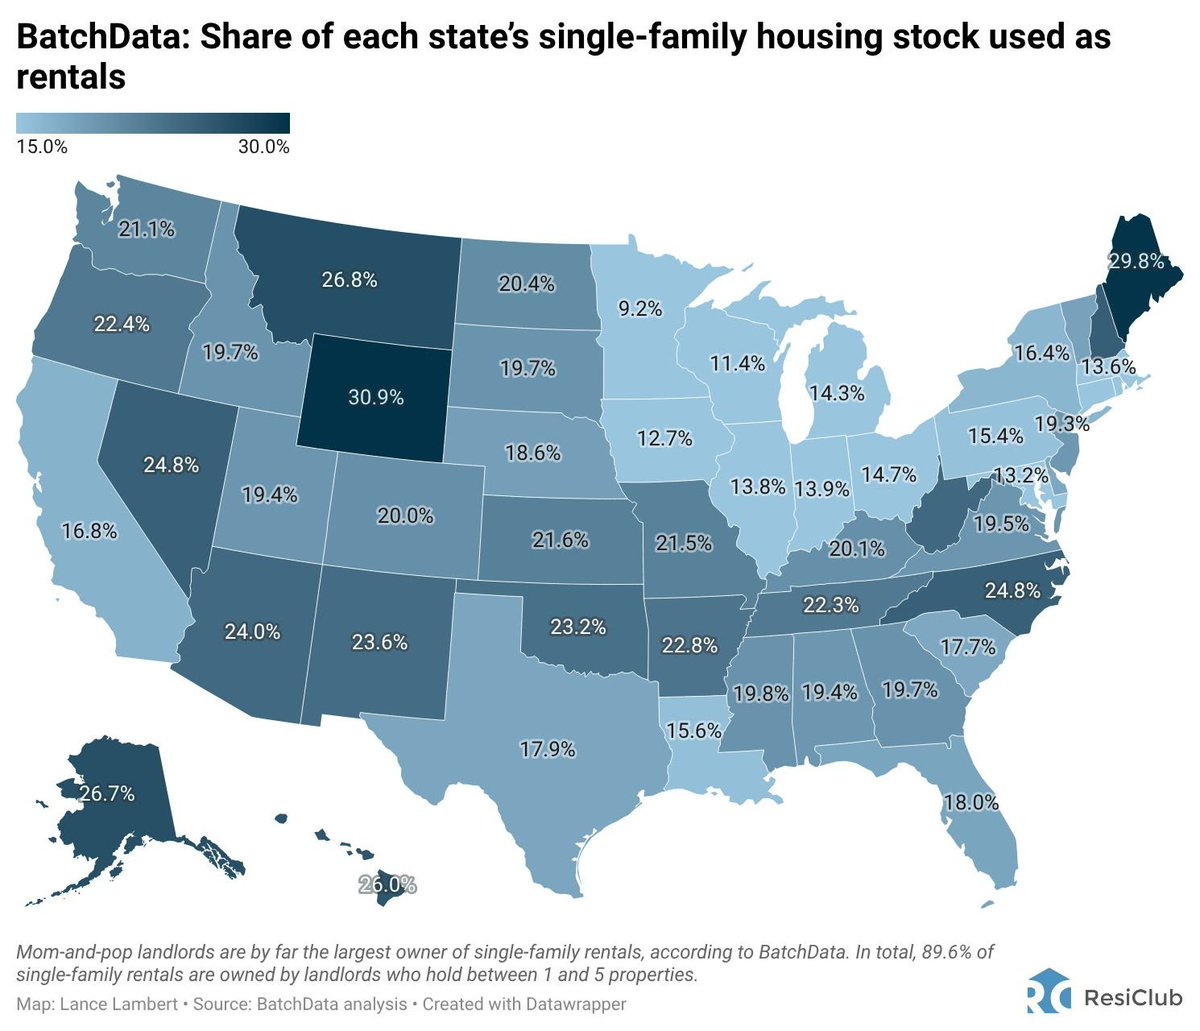
BatchData finds that nearly 18% of America’s single-family housing stock is now rental—though levels vary widely by state.
resiclubanalytics.com/p/shar… via @NewsLambert
1
2
9
3,039

Mar 4
房迷 From Me Daily 03/03/2026
- 我們不太能控制怎樣的情緒或想法出現,但能控制逗留在怎樣的情緒或想法
- 情緒是訪客,不知道誰會出現,而你是房東,決定誰留誰走
- 情緒出現很多是杏仁核,常常是生存與情緒反射
- 但是情緒的留存,相對容易練習控制
- 察覺是很重要的第一步,需要先知道自己在什麼狀況,才能處理
- 很多時候接納是需要的,因為負面的就是會出現,無法避免
- refocus最重要,要做的不是去想『我不要再這樣下去』,越想其實越focus
- 是去專注到別的事上,去看看外面的綠樹、天空,就發現沒什麼大不了的
- 這是為什麼我覺得天氣超重要,藍天就是爽,陽光就是美
- 最近春天到了,好多樹也開始開花,任何事情都等得到春天
- 來幫Sparknify宣傳他們白色情人節的活動
- 3/16週一,在Mayan Kitchen,有白酒品鑑、白巧克力體驗、馬雅料理晚宴
- 還有AI系統進行配對,安排同桌共進晚餐的人
- 聽說參加者臥虎藏龍,還有不少科技新貴,也是很好的機會認識人
- 目前男生比較少,各位身為Man Jose的男性朋友,不要害羞了,趕緊報名
- 用promo code "from_me_realtor"還可以折$10喔
- 詳細介紹與報名: sparknify.com/zh/event-detai…
- 如果有在這邊有情人終成眷屬的,買房時不要忘記我
- 當然,如果去踩坑了,也不要怪我,我沒收錢,只是好心幫忙宣傳而已
- 文章有連結的,平台常常會降低觸及,所以還麻煩各位幫我按讚補血
- 現在的家長有超多認為,不想要小孩去很好的學校,怕競爭太大
- 尤其在矽谷,常聽說什麼小孩壓力太大自殺的
- 同時也有很多人,是追求好學校,認為同儕的影響力,跟資源很重要
- 我從以前就分享過我的觀點,小孩的壓力從來都是家長給的
- 尤其美國學校不像亞洲,沒有在排名,更沒有在說讀書才有前途的
- 所以在升學這件事上,家長的態度,決定了小孩的想法,而不是周圍的環境
- 這樣就很弔詭,越是想去較差學校的家庭,其實更適合去好的學校
- 因為這些家長,其實對小孩沒有嚴苛的要求,去很競爭的學校也不會有問題
- 越是想去搶好學校的家庭,其實更適合去爛點的學校
- 因為這些家長,其實就是想要小孩成績更好,很競爭的地方,更可能辛苦
- 我認為家庭教育,跟家長的價值觀,決定了小孩成長的很大一部分
- 這些是我們可以控制的,不管小孩去哪,我們有我們的影響力
- 家長的影響力,當然有其極限,但也很深遠
- 所以選擇學校,肯定還是選好學校,你能給予小孩更高的天花板,為什麼不
- 而且壓力本來就一定有,真的沒聽過誰是沒壓力的
- 壓力不是要逃離,而是要管理
- 我想讓小孩學習的,怎樣面對壓力,而不是如何逃避壓力
- 小孩在學校會遇到什麼狀況、怎樣的同學,這些是我們相對難控制的
- 好學校就是在同儕上比較好,各種資源也會比較多
- 最後就是,每個人個性不一樣,適合的東西當然也不一樣
- 所以有人適合次等的學校,當然也很正常
- 現在流行去次等學校搶好的成績,是一種策略,這個也很聰明
- 美國貸款的主流是30年固定利率貸款,不過最近浮動利率房貸(ARM)比例飆升
- Cotality的數據,ARM現在佔市場21%,創下三年新高,在加州甚至高達31%
- 30年固定利率降到6.1%左右,但是ARM的利率更低,大約在5.3%
- 在貸款超過$1M的市場,接近一半的貸款都是ARM
- 高價區選擇ARM比例更高,灣區肯定比加州更高
- 主要每個月還款額少,更多錢可以進股市,應該是很多人想法
- 買房很多時候是先上車,尤其在認為未來利率可能下降的時候,用ARM合理
- 等未來利率降更低時,再refinance成固定利率,或者像我就是一路ARM
- 以前大家覺得ARM是風險很高的產品,來自金融海嘯的陰影
- 但現在的ARM結構比較安全,大多是5/1或7/1,前幾年是固定的
- 很多時候7-10年,也會換房子了
- 當然,也有一種想法,灣區大量ARM,歷經2022加息,一兩年後可能會爆雷
- 這個我是覺得不會,但只有時間能回答這個問題
- 房子附近的生活機能,特別是離超市距離,最近慢慢越來越受重視
- Re/Max今年的調查,有57%的買家認為離超市近很重要
- 而且超市之間還可以分高下的,像是Whole Foods、Trader Joe's,愛的人不少
- 有人說附近有Trader Joe's的,房價比平均高不少,這個我是沒有覺得
- 倒是超市選址也很講究的,會去人口密集、消費力強的區開
- 離超市、餐廳這些進,真的比較方便,然後又不能在家旁邊最好
- 我還會建議買家,去想買的房子附近的超市逛,是不錯的社區判斷法
- 可以快速感受一下附近的氛圍,看看這邊都是怎樣的人
- 根據BatchData的分析數據,全美18%的獨棟屋是出租房
- 比例最大的州是Neveda 24.8%,最小的是Maryland 13.2%
- 加州是16.8%、德州17.9%、Arizona 24%、華盛頓州21.1%
- 其中出租的獨棟屋有89.6%是被平常人擁有,稱為mom-and-pop房東
- 以前有蠻多人是把出租房當成退休收入的,最近年輕人想法有改變
===
你不太能控制房迷寫得好不好,但可以控制自己是不是按讚的人,應該把按讚當成一種反射,但是每天按讚的習慣,相對不容易的養成,需要一直練習,察覺是很重要的第一步,每天都要看房迷,一天沒看就要覺得怪怪的,很多時候按攢、留言、分享是需要的,因為沒按讚,演算法也不知道你喜歡,refocus就不用了,focus按讚就可以。不用等春天,也可以花枝亂讚,春天到了,就可以百花齊讚。
4
2
73
1,200

Feb 17
A new report from BatchData shows that about 18% of homes in the US are owned by investors. abc30.com/post/housing-watch…
1
1
1,477

Jan 21
Trump's "Wall Street ban" on homes? A distraction hunting a problem. Institutional buyers own just 2.17% of investor homes, per BatchData, net sellers for 7 quarters. Stocks plunged 9% yesterday.
His 2017 tax cuts invited these investors. Now, this legal overreach ignores the 4 million home shortage while risking higher rents. Performative chaos.
5
570

Grok:
**Approximately 20% of single-family homes in the United States are owned by investors** as of 2025. This figure refers to the total stock of about 86 million single-family homes, with investors owning roughly 17 million of them.
This percentage is consistently reported across multiple sources analyzing 2025 data, including reports from BatchData, CJ Patrick Company, Cotality, and CNBC. Investors here include both small "mom-and-pop" landlords (who own the vast majority, often 85-90% of investor-held properties) and larger entities.
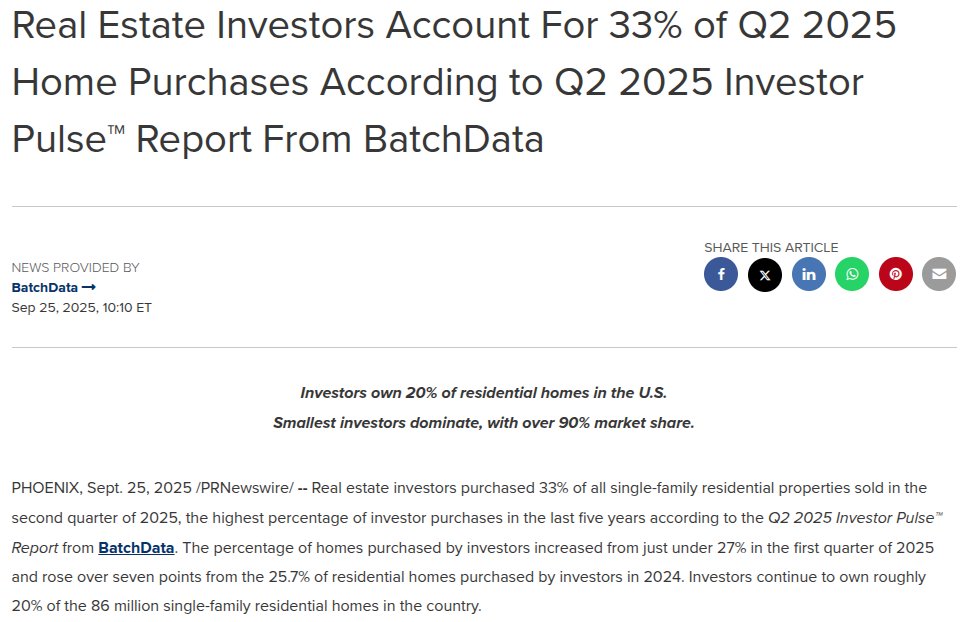
Note that this is distinct from investor **purchase activity**, which was elevated in 2025: Investors bought 27-33% of single-family homes sold during various quarters of the year (e.g., 27% in Q1, up to 33% in Q2), driven by high mortgage rates sidelining traditional buyers. However, the overall **ownership share** of the existing housing stock remains around 20%.
For context, **institutional investors** (large firms owning 1,000 properties) own only about 2% of single-family rentals or investor-held homes nationally, though their share is higher in specific markets like Atlanta or Charlotte.
1
2
92

13 Nov 2025
According to BatchData, there are 15.7 million single-family rentals—with 89.6% being owned by mom-and-pops with 1-5 total single-family rentals
1
45
13 Nov 2025
86.5 million ---> U.S. single-family homes, according to BatchData
450k ---> Number of single-family homes owned by institutional homeowners, according to GAO
Institutional homeowners own around 0.5% (half of 1%) of the total U.S. single-family stock
13 Nov 2025

0 ---> Number of single-family homes owned by institutional homeowners—those owning at least 1,000 homes—before 2011
450k ---> Number of single-family homes owned by institutional homeowners in 2022
Source: U.S. Government Accountability Office, 2024 report
15
16
66
52,492
13 Nov 2025
According to BatchData, there are 15.7 million single-family rentals—with 89.6% being owned by mom-and-pops with 1-5 total single-family rentals
1
4
489
13 Nov 2025
According to BatchData, there are 86.5 million U.S. single-family homes (this data varies a little by source)
Using that as the denominator, institutional homeowners—those owning at least 1,000 homes—owned around 0.5% (half of 1%) of the total U.S. single-family stock in 2022
1
1
14
5,390

12 Nov 2025
That 1985 vs. 2025 gap is a gut punch.
Millennials are priced out big time. The 33% investor spike in Q2 2025 (per CNBC/BatchData) sounds alarming, but the data shows small “mom-and-pop” investors dominate, not Wall Street. If big players are selling, could this be a turning point? Let’s push for more housing supply, affordability won’t fix itself
1
124

8 Oct 2025
“That is an increase from 27% in the first quarter, and the highest percentage in the last five years, according to a report from CJ Patrick Co., using numbers from BatchData.”
cnbc.com/amp/2025/10/07/home…
4
64
299
38,682

7 Oct 2025
This press release from BatchData reveals that investors recently accounted for a third of all home purchases in 2q25. A shockingly larger number. /2
1
2
24

3 Oct 2025
.@encifherio follows a layered architecture.
It majorly has components for these four layer
- Sequencing Layer
- Validation Layer
- Execution Layer
- Submission Layer
Sequencing Layer: Encifher implements a novel sequencing layer component which we internally call as Batcher Client. Batcher implements tons of optimizations around reducing computation expression, caching states etc. It constructs a custom struct call BatchData which is later sent over to the execution client for processing.
Validation Layer: At validation layer the coprocessor makes sure the integrity of the batches such that only authorized addresses are able to compute on top of certain requested pointers. At the same time it makes sure user inputs are integral (second layer of defense) with respect to request computation.
Execution Layer: This layer is highly modular and highly parallelizable (design decision) and even could potentially plug in any PET infra (MPC, TEE, FHE, IO, FE) tbh we kept it highly parallelizable in consideration to the fact that this layer determines throughput of the whole coprocessor.
Submission Layer: Each BatchData struct post processing gets converted into a data structure which we internally call as BatchTree. The BatchTree structure contains all the request processed and the resultant pointers produced as a result of expression evaluation along with the resultant ciphertext. Which later on gets signed and submitted onchain for anyone to verify the computation integrity.
prepping up quite a detailed document around the core architecture will share soon
1
7
52
3,644

2 Oct 2025
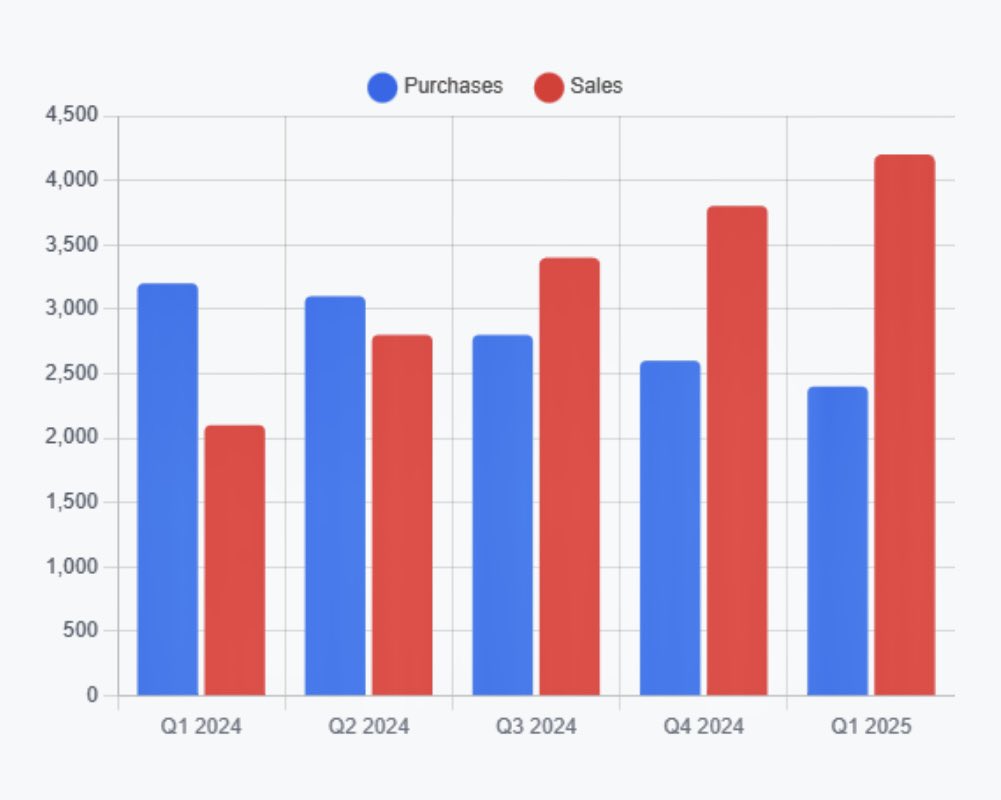
Large investors appear to be executing a coordinated retreat from single-family markets, selling 76% more properties than they purchased in Q1 2025
Single Family Home Sales ⬆️
Single Family Home Purchases ⬇️
(Data from Batchdata)
41
31
222
17,068
25 Sep 2025
BatchData's Q2 2025 Investor Pulse Report Reveals Small Landlords, Not Wall Street, Dominate America's Rental Housing Market
Enhanced methodology uncovers 11% more transactions, showing 95% of investor-owned homes belong to small operators while institutional investors retreat for sixth consecutive quarter
PHOENIX, AZ – 09/25/2025 - BatchData, a leading real estate data and analytics platform, today released its Q2 2025 Investor Pulse™ report, revealing that small investors with fewer than 50 properties control 95% of America's 17 million investor-owned single-family homes, fundamentally challenging narratives about institutional dominance in housing markets.
The report, which analyzed over 345,000 property transactions using significantly enhanced methodology, found that while investors captured a record 33% of home purchases in Q2 2025, this surge reflects the retreat of traditional homebuyers amid affordability constraints rather than aggressive investor expansion.
"Our Q1 report went viral with over 540,000 views because it challenged assumptions with data," said Ivo Draginov, President at BatchData. "For Q2, we completely rebuilt our methodology to ensure even greater accuracy. What we found should reshape the entire conversation about housing policy in America."
Key Findings:
Small Investors Dominate the Market
Investors owning 1-5 properties control 87% of investor-owned homes (14.5 million properties)
Mega-investors with 1,000 properties own just 2% of inventory (345,000 homes)
The average small investor owns just 3 properties and invests within 50 miles of their primary residence
Institutional Investors in Retreat
Large investors have been net sellers for six consecutive quarters
In Q2, institutional investors sold 5,800 homes while purchasing only 4,069
Capital is rotating from single-family purchases to build-to-rent development
Market Segmentation, Not Competition
Investors paid an average of $455,481 per home, well below the $512,800 traditional buyer average
71% of investor purchases involved properties needing significant repairs
60% of investor sales returned properties to owner-occupants after renovation
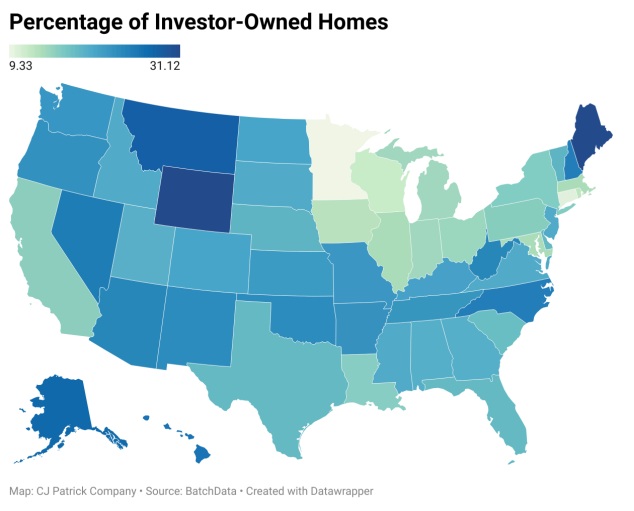
Geographic Investment Patterns
Highest investor ownership: Maine (31.1%), Montana (31.0%), Alaska (27.2%), Hawaii (26%)
Lowest ownership: Minnesota (9.3%), Colorado (10.1%), Connecticut (10.6%)
Three distinct strategies emerged: tourism markets, affordability plays, and lifestyle destinations
Market Implications
The report arrives as Congress debates various proposals to limit institutional investor purchases, with several states implementing or considering purchase restrictions. However, the data suggests these policies may miss their target.
"Policies aimed at Wall Street landlords affect less than 2% of investor-owned properties while potentially harming the 95% owned by small, local operators," explained Ivo Draginov. "These small investors are providing essential rental housing and renovating distressed properties that traditional buyers can't or won't purchase."
The report also highlights investors' role in maintaining market liquidity during the affordability crisis, with 60% of investor purchases made in cash when conventional financing has become unattainable for many families due to elevated mortgage rates averaging 6.7%.
About the Investor Pulse
The quarterly Investor Pulse report analyzes ownership patterns, transaction trends, and pricing strategies across all 50 states, providing actionable intelligence for real estate professionals, policymakers, and market participants. The report is prepared using BatchData's comprehensive property database.
About BatchData
Founded in 2021, BatchData is a comprehensive real estate data platform providing enterprise-grade APIs with access to 1,000 data points for over 150 million U.S. properties. The platform serves businesses from startups to Fortune 500 companies with nationwide datasets for property data, consumer demographics, skip tracing, permit data and other data points through enterprise-grade APIs and delivery options. Unlike static data aggregators, BatchData's in-house data science team enriches datasets from multiple tier-one providers while leveraging real-time feedback from over 20,000 users to maintain industry-leading accuracy standards.
The complete Q2 2025 Investor Pulse report is available for download at batchdata.io/investor-pulse-… @grok
2
1
15
187,838

