Iori retweeted

データが極端に少ない状況下で、広告の露出頻度やリーチ率を正確に推定するための確率モデル(特にNegative Binomial Distribution)をRで実装する方法を、理論から実践まで解説。
・Poisson分布+Gamma事前分布からNegative Binomial分布を導出し、過分散・ゼロ過剰なカウントデータをモデリングする考え方
・限られたCM露出データからリーチ率(r_g = 1 - P(F=0))や累積リーチ曲線を推定するRコード(dnbinom / pnbinomの活用例)
・lm()などの単純回帰では対応しにくいスパースデータへの実践的なアプローチと、推定精度を上げるポイント
顧客の購入頻度・サイト訪問回数など、他のビジネスにおけるカウントデータの過分散問題にもそのまま応用可能。階層モデルに拡張して「グループ間で情報を借りる」手法のヒントも得られます。
マーケティングの実務課題を題材に、理論の導出 → Rでの実装 → 具体的なデータ例まで一貫して解説されている。Rでの実践的な発表資料で「すぐに試せる」レベルが高いです。
speakerdeck.com/dropout009/j…
5
60
2,648
Partytime Products (HK) Co., Ltd retweeted

Jun 13
First binomial formula.
2
34
217
10,686


You suck at probability and stats. I bet you've never even heard of binomial probability.
1

Cartesian 2D plot
Cartesian 3D plot
Polar plot
Spherical coordinate plot
Cylindrical coordinate plot
Hyperbolic coordinate plot
Log-polar plot
Spiral plot
Radial wheel
Prime wheel
Atomic-number wheel
Proton-count ladder
Periodic-table path
Element transition map
Node-link graph
Complete graph
Force-directed graph
Spring layout graph
Circular network graph
Radial network graph
Chord diagram
Arc diagram
Hive plot
Sankey diagram
Alluvial diagram
Flow map
Tree diagram
Dendrogram
Hierarchical cluster map
Treemap
Sunburst chart
Icicle chart
Voronoi diagram
Delaunay triangulation
Triangle mesh
Tetrahedral mesh
Convex hull
Alpha shape
Point cloud
Density cloud
Heat map
Contour map
Filled contour map
Surface plot
Wireframe plot
3D mesh plot
3D scatter plot
Bubble chart
Bubble network
Hexbin plot
2D histogram
3D histogram
Bar chart
Stacked bar chart
Grouped bar chart
Horizontal bar chart
Line chart
Multi-line chart
Area chart
Stacked area chart
Streamgraph
Step chart
Lollipop chart
Dot plot
Strip plot
Swarm plot
Beeswarm plot
Box plot
Violin plot
Ridge plot
Joy plot
Scatter plot
Scatter matrix
Pair plot
Correlation matrix
Covariance matrix
Distance matrix
Adjacency matrix
Incidence matrix
Laplacian matrix view
Eigenvalue spectrum
Eigenvector map
PCA plot
t-SNE plot
UMAP plot
MDS plot
Isomap projection
Spectral embedding
Phase-space plot
State-space plot
Phase portrait
Vector field
Quiver plot
Streamline plot
Flow field
Gradient field
Curl field
Divergence field
Potential field map
Electric field line plot
Magnetic field line plot
Equipotential contour plot
Orbital shell diagram
Electron shell diagram
Energy-level diagram
Nuclear shell model view
Isotope chart
Nuclide map
Decay chain graph
Stability valley plot
Binding-energy curve
Mass defect plot
Proton-neutron scatter plot
Neutron-offset plot
Atomic radius chart
Ionization energy chart
Electronegativity chart
Electron affinity chart
Oxidation-state chart
Periodic trend heatmap
Periodic table heatmap
Periodic spiral table
Periodic cylinder
Periodic torus
Periodic helix
3D periodic table
Element similarity network
Chemical-property radar chart
Spider chart
Parallel coordinates plot
Andrews curve
RadViz plot
Barycentric triangle plot
Ternary plot
Simplex plot
Pythagorean triangle map
Triangle-count growth chart
Edge-count growth chart
Combination-growth curve
Binomial coefficient chart
Pascal triangle view
Combinatorial lattice
Hypergraph view
3-uniform hypergraph
Clique complex
Simplicial complex
Vietoris-Rips complex
Čech complex
Persistent homology barcode
Persistence diagram
Betti number plot
Topological skeleton
Manifold projection
Toroidal projection
Klein-bottle projection
Möbius strip projection
Hyperboloid plot
Saddle surface plot
Paraboloid plot
Cone projection
Sphere projection
Geodesic dome view
Great-circle network
Latitude-longitude grid
Mercator projection
Orthographic projection
Stereographic projection
Gnomonic projection
Lambert projection
Mollweide projection
Aitoff projection
Hammer projection
Radar sweep animation
Rotating 3D GIF
Exploded-view animation
Layer-by-layer animation
Time-sliced animation
Phase-shift animation
Pulse animation
Morphing animation
Growth animation
Edge-activation animation
Triangle-activation animation
Node-influence animation
Density-field animation
Heat-diffusion animation
Wave-interference animation
Standing-wave plot
Fourier spectrum
Fourier transform view
Wavelet transform view
Spectrogram
Recurrence plot
Chaos attractor
Lorenz attractor
Strange attractor
Bifurcation diagram
Logistic map plot
Mandelbrot set mapping
Julia set mapping

1
1
22


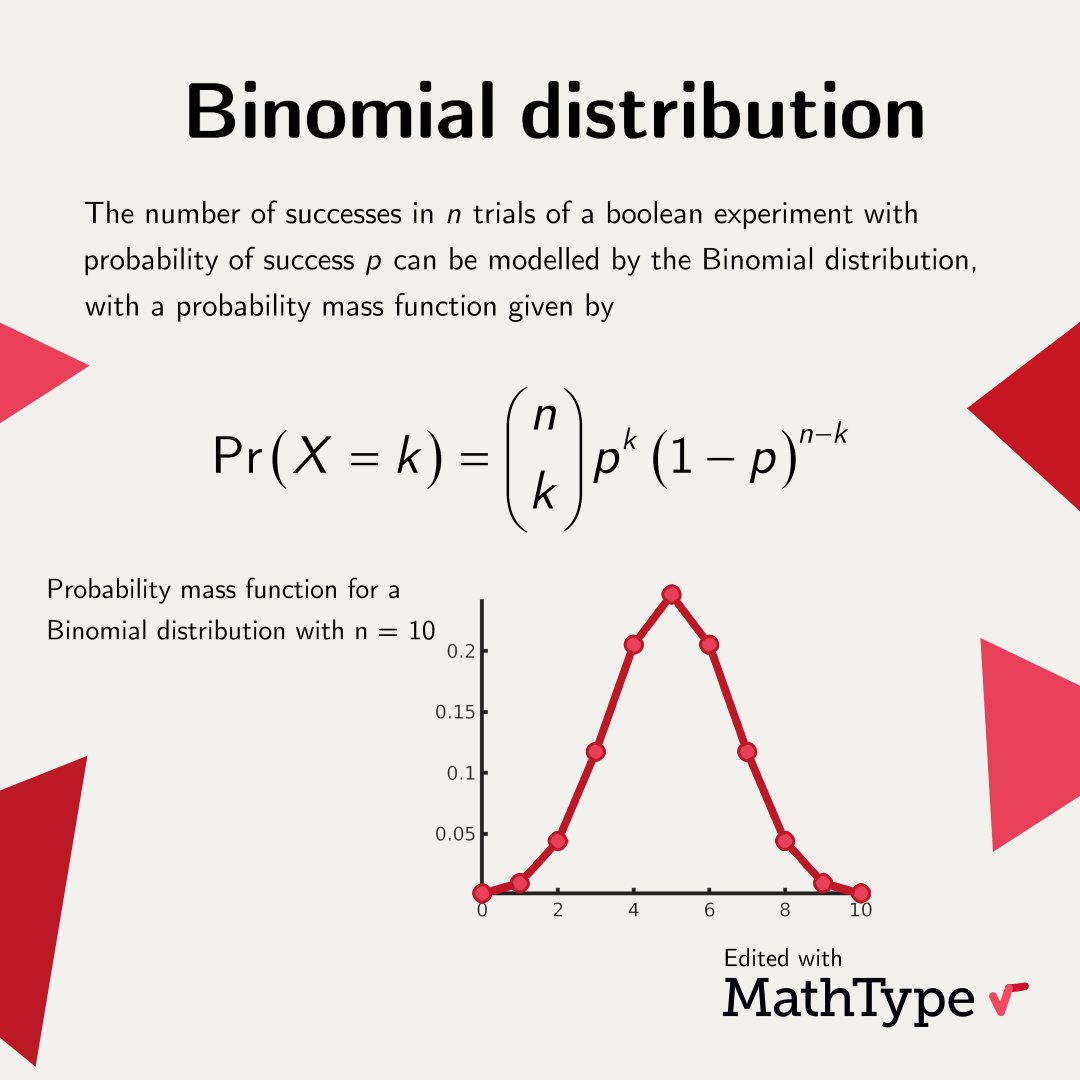
The #binomial distribution was first studied in the context of games of pure chance, and it's now widely used to analyze data in many fields. It models the number of successes when performing n trials of an experiment with a probability of success p.
#MathType #math #mathfacts
12
101
2,451
