Roads of Goa retweeted

Jun 12

1
1
5
338

Jun 12
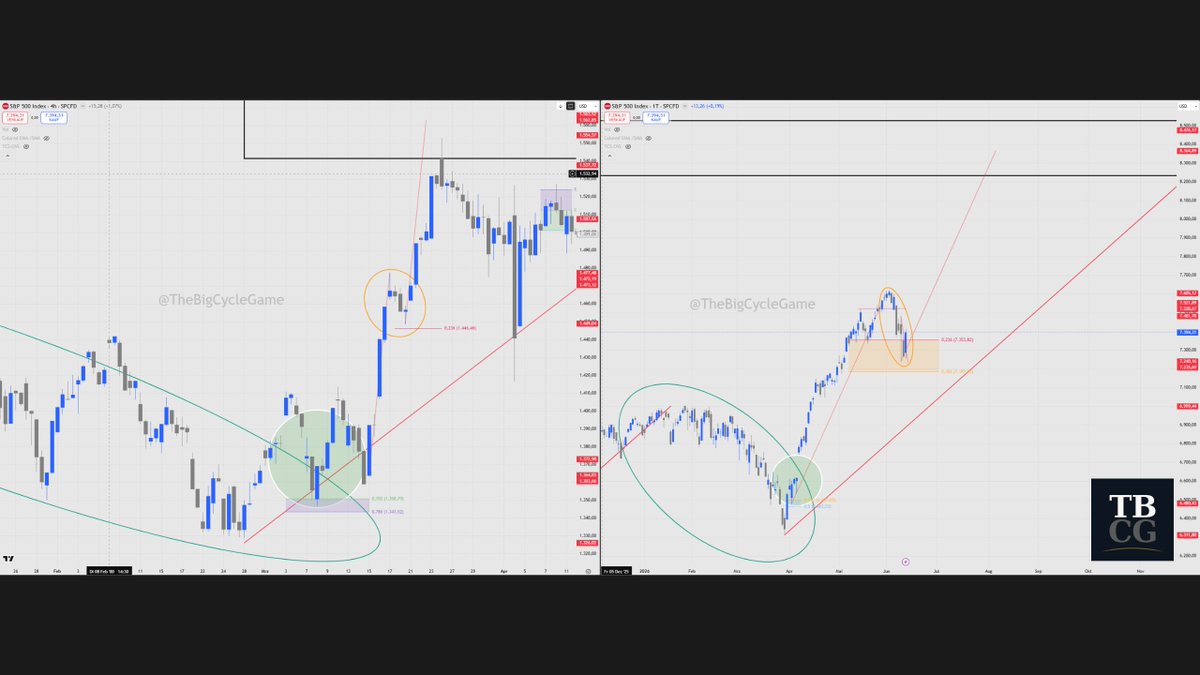
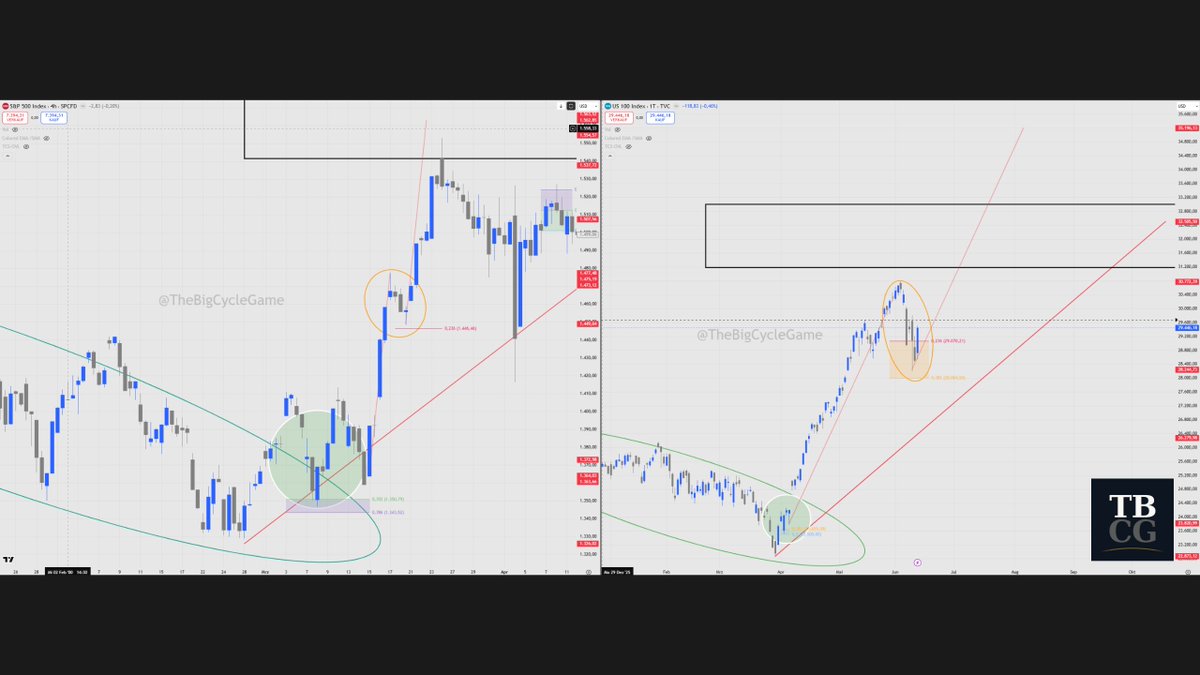
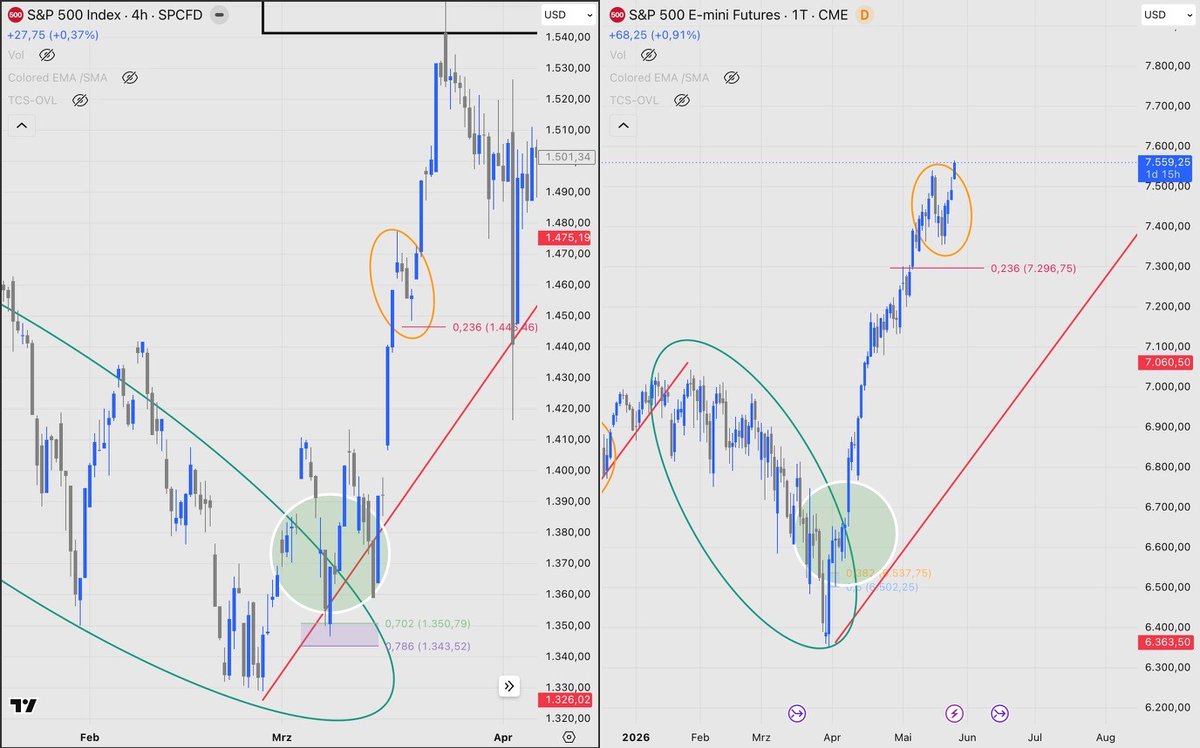
DOT-COM FRACTAL UPDATE — June 12, 2026
S&P 500
From June 2 to June 9 the S&P corrected
approximately 5%. On June 11 a Bullish Engulfing
candle formed on the daily chart. The index closed
above its 0.236 Fibonacci level and sits
approximately 3% below the May ATH.
Target zone: 8,200 — 8,400
Timing: late July to early August
─────────────────
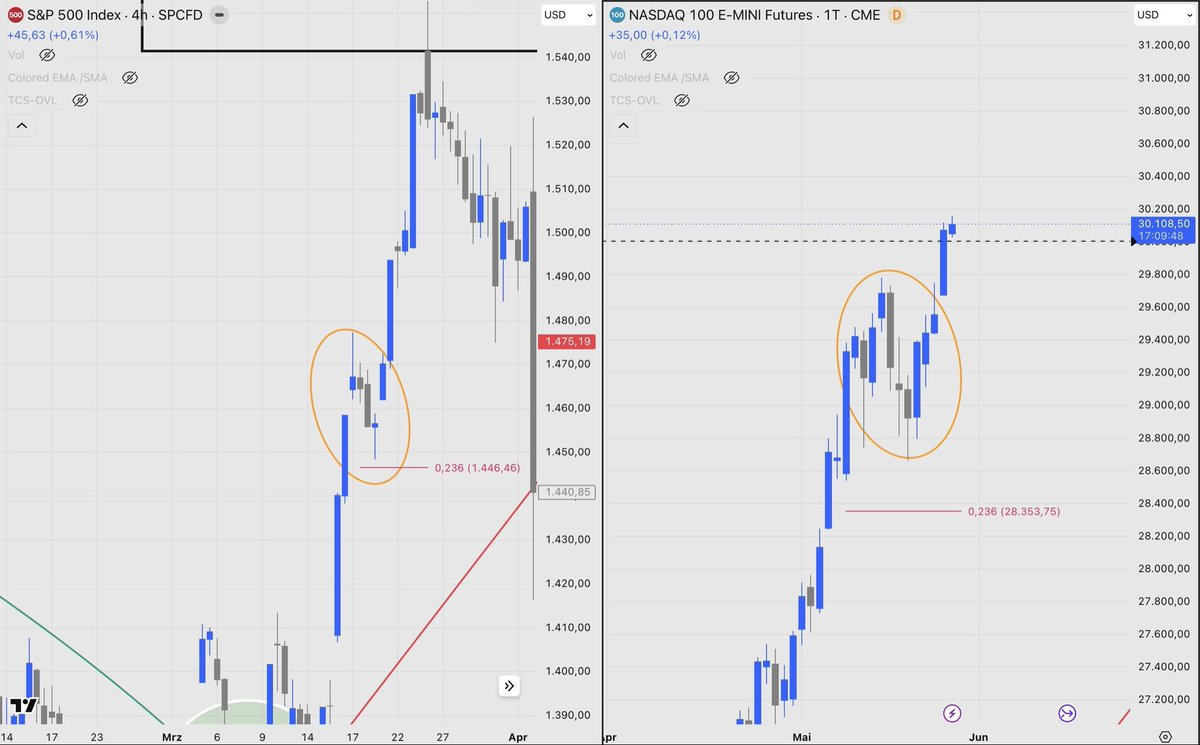
NASDAQ 100
From June 3 to June 9 the Nasdaq corrected
approximately 8.5%. On June 11 a Bullish Engulfing
candle formed on the daily chart. The index closed
above its 0.236 Fibonacci level and sits
approximately 4.5% below the May ATH.
Target zone: 32,000 — 33,500
Timing: late July to early August
─────────────────
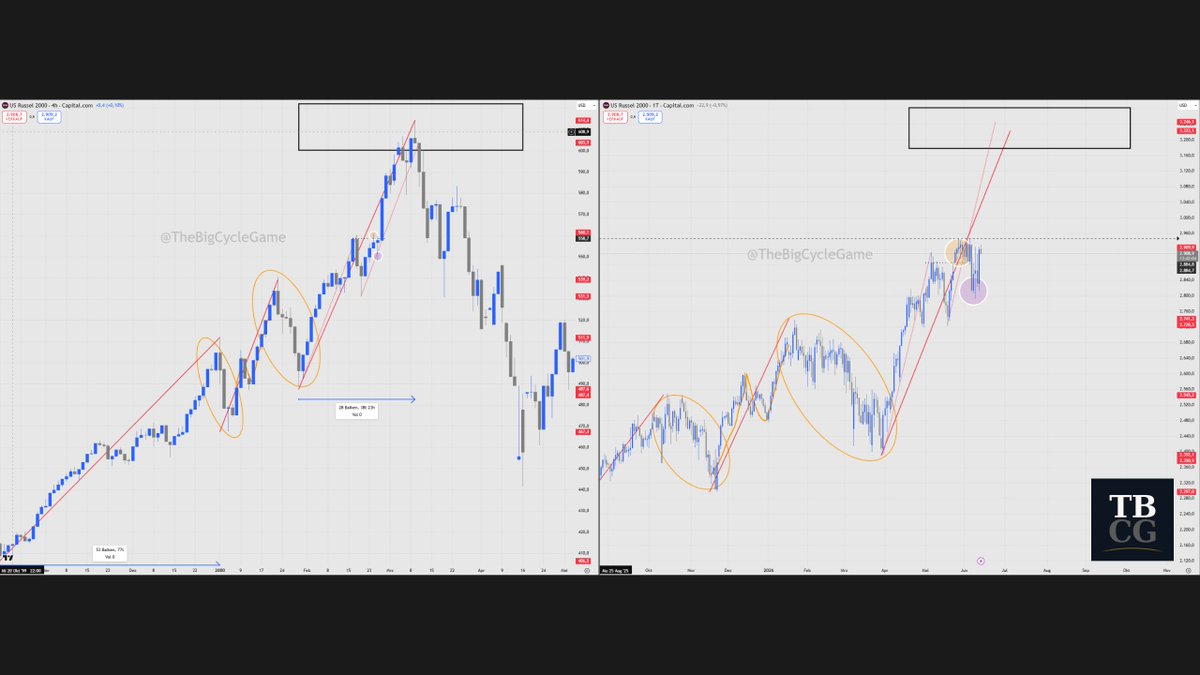
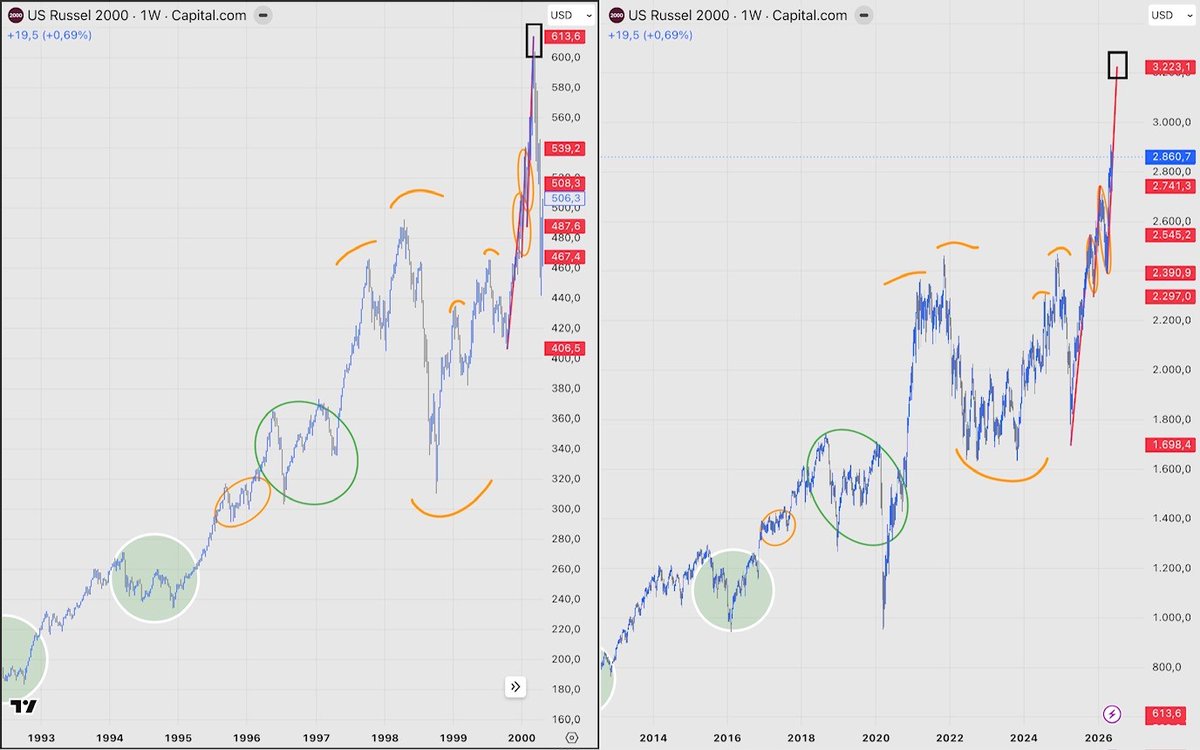
RUSSELL 2000
The Russell set its correction low on June 9
without producing a lower low relative
to the large indices. June 11 performance
exceeded 3%. Fractal alignment remains precise
throughout the entire structure.
Target zone: 3,150 — 3,200
Timing: late June to early July
─────────────────
STRUCTURAL OVERVIEW
Bullish Engulfing candles on the S&P and Nasdaq
on June 11. Both indices closed above
their respective 0.236 Fibonacci levels.
The correction low appears to be in.
Russell leading by approximately two weeks.
S&P and Nasdaq following.
Identical to the sequence in 2000.
The correction did not produce
a broad market selloff.
Selling was concentrated
in semiconductor and software momentum.
The Russell held its levels throughout.
That is a rotation signal, not a reversal.
─────────────────
The next phase will probably be defined
by broadening participation.
Sectors that did not yet benefit
from the primary move are next.
Small caps. Risk assets. And crypto.
Bitcoin and Altcoins are probably part
of this final rotation.
International capital is increasingly
flowing back into US markets
as global indices either top out
or have already done so.
The KOSPI is a visible example.
After its parabolic structure,
a significant pullback has already occurred.
The probability that the KOSPI
has already set its high is substantial.
In the final phase of a global cycle,
capital concentrates in the last
remaining high-beta opportunities.
The last trade of this cycle
points toward risk assets, small caps,
and crypto.
─────────────────
We are inside a significant macro window.
CPI on Wednesday. PPI on Thursday.
SpaceX IPO today.
First Fed meeting under the new Chair
on Wednesday next week.
Iran: unresolved and active.
Each of these events carries the potential
to be the next catalyst for the move.
But it is worth remembering
what happened in late March and early April
when the indices suddenly surged.
There was no narrative.
No single catalyst.
The structure was ready and the market moved.
Not every leg up needs a reason.
CIF: 82/90 — WARNING LEVEL ORANGE.
@TheBigCycleGame
Not financial advice. DYOR.
#DotComFractal #SPX #Nasdaq
#Russell2000 #Bitcoin #Altcoins
#FinalPhase #SectorRotation
#CIF #TheBigCycleGame
5
2
18
726
Jun 5
DOT-COM FRACTAL UPDATE — June 5, 2026
─────────────────
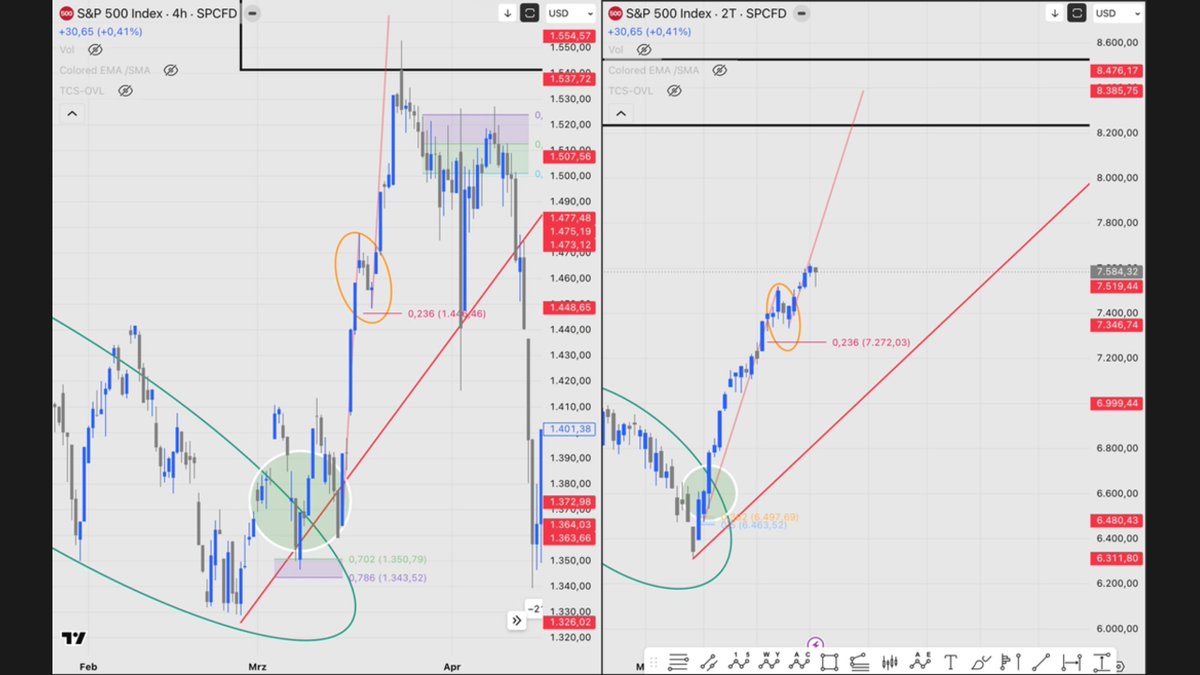
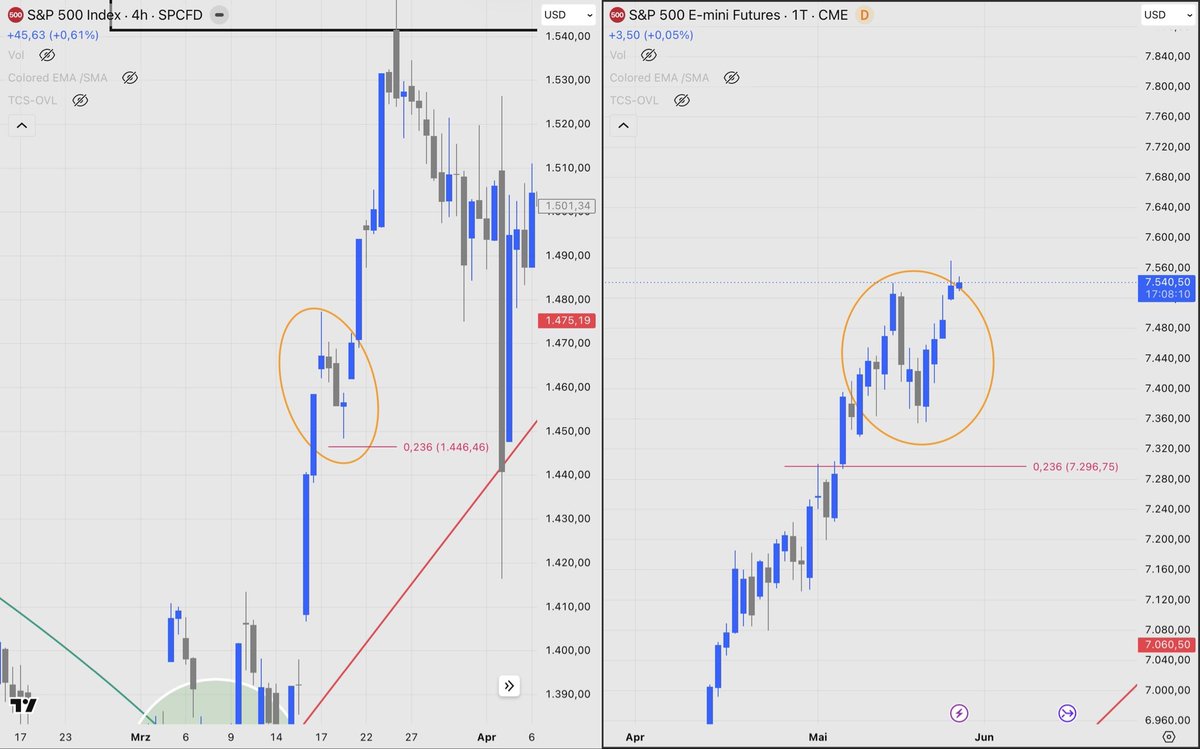
S&P 500
Retested the prior high from before
the short consolidation this week.
Structure intact. New ATHs extended.
Continues to track the Dot-Com parallel
with precision.
Target zone: 8,200 — 8,400.
Remaining upside: ~8%.
─────────────────
NASDAQ 100
Extended new ATHs throughout the week.
Gave back some gains yesterday.
Overall structure fully on track.
Target zone: 32,000 — 32,500.
Remaining upside: ~6%.
Overshoot toward 34,000 remains possible.
─────────────────
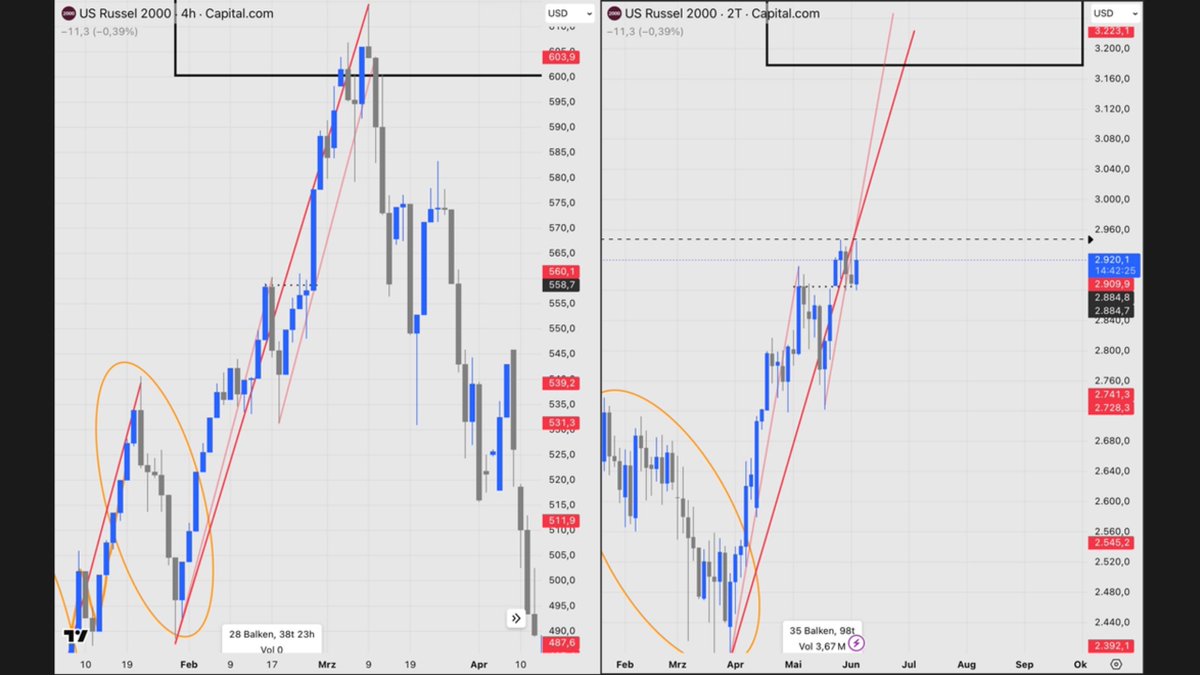
RUSSELL 2000
Still in its own Dot-Com fractal setup.
Momentum has been concentrated
in large caps this week,
which explains the recent stickiness.
Yesterday: retested the breakout level
on the 2-day chart and showed
an impulsive response.
Consistent with the structure.
Target zone: 3,150 — 3,223.
Remaining upside: ~10%.
─────────────────
All three indices continue to follow
their respective Dot-Com parallels.
What is notable this week:
momentum appears to be rotating
out of Tech and Semiconductors
and into broader market participation.
Healthcare, Financials, Regional Banks
and Industrials led yesterday's session.
If this rotation continues,
all three indices stand to benefit.
The Russell in particular
tends to accelerate when breadth expands.
─────────────────
The fractal window remains:
mid-June to early July 2026.
The structure is intact.
The rotation has started.
CIF: 82/90 — WARNING LEVEL ORANGE.
@TheBigCycleGame
Not financial advice. DYOR.
#DotComFractal #SPX #Nasdaq
#Russell2000 #FinalPhase
#CIF #TheBigCycleGame
1
13
503

Jun 5
त्रिपुरा में बोले केंद्रीय गृह मंत्री अमित शाह, कहा-स्मार्ट बॉर्डर प्रोजेक्ट अंतिम चरण में है | JAN TV
youtu.be/2pbP4ymKQ48
#LankamuraNews #AmitShah #TripuraVisit #SmartBorderProject #BorderSecurity #DevelopmentInitiative #FinalPhase #NationBuilding #SafeBorders #Infrastructure #IndiaProgress #jantv_opn @BJP4India @AmitShah @chandanisinghb2

5
26
Jun 1
DOT-COM FRACTAL UPDATE — June 1, 2026
─────────────────
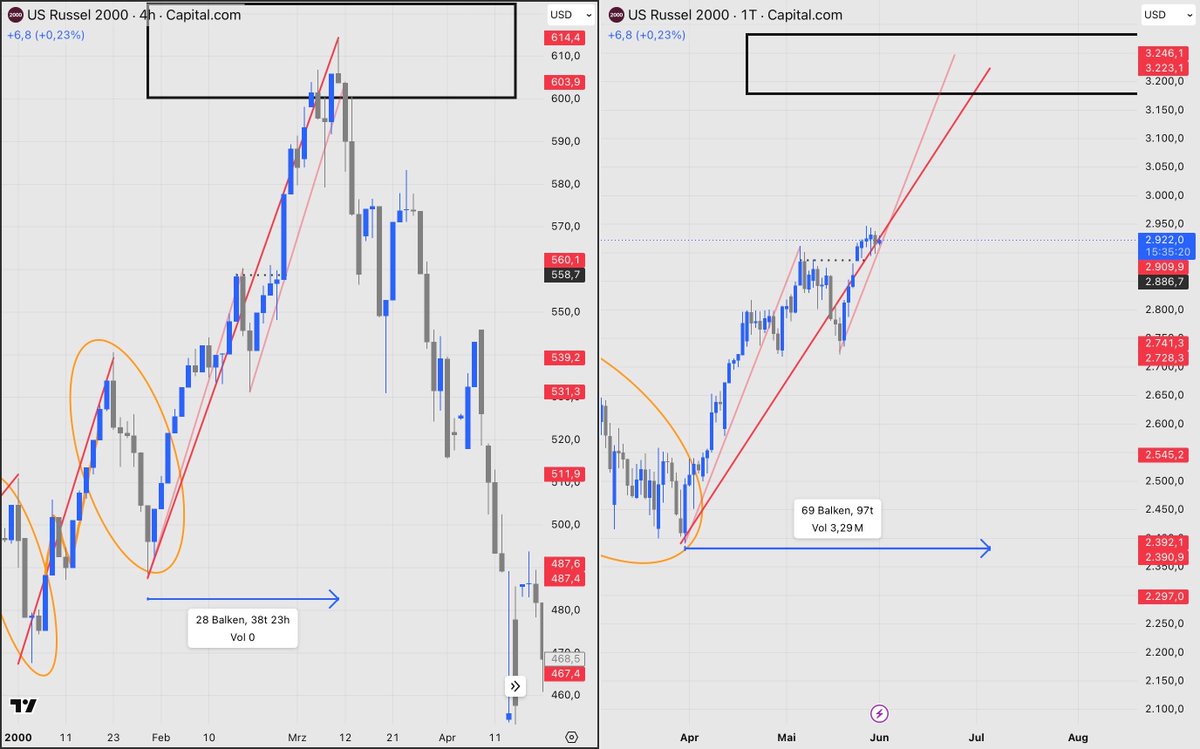
RUSSELL 2000
Current: 2,922
From March low: 21%
Target zone: 3,150 — 3,223
Remaining upside: ~10%
─────────────────
The Russell is following its own
Dot-Com fractal from 1999 to 2000.
Not the S&P structure.
The compression factor: 2.5x.
The parabolic phase is running.
The small consolidation is complete.
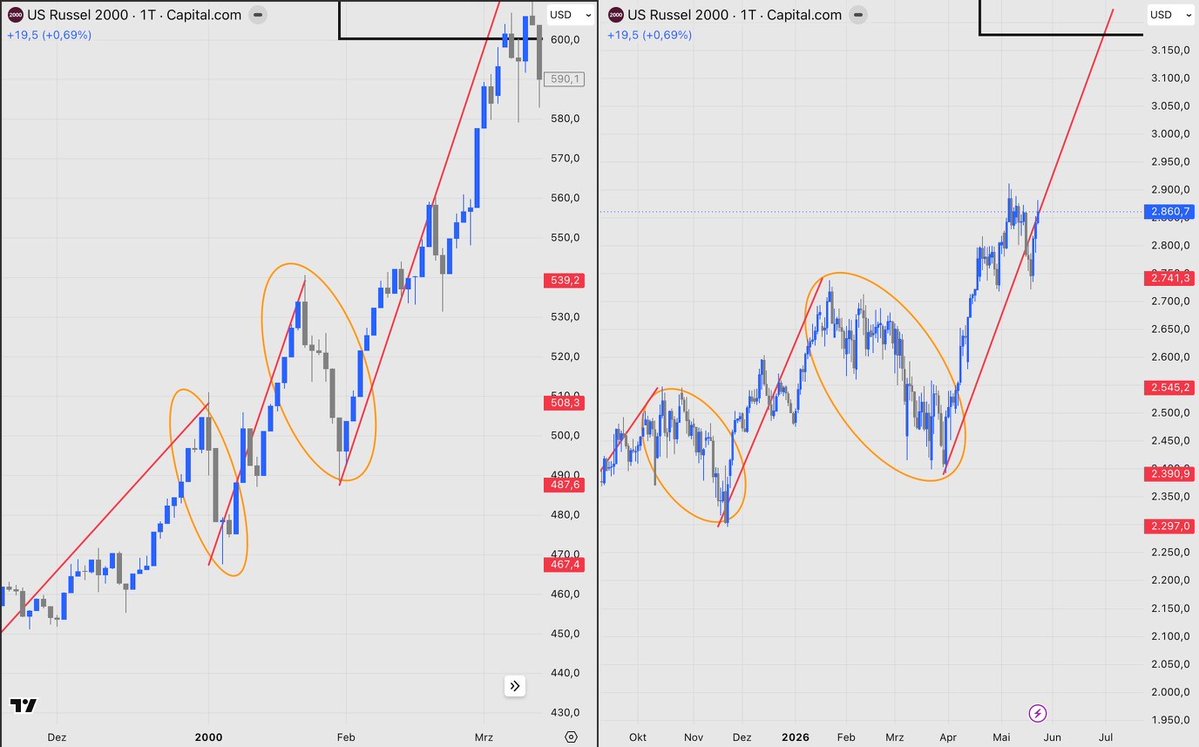
The mirrored trendline
from the current parabolic move,
from the start of the April 2026 acceleration
to the recent shallow consolidation,
reapplied from the consolidation low,
carries the current momentum forward.
That projection points to:
mid-June to early July 2026.
─────────────────
The internal structure of this final move
mirrors the Dot-Com pattern precisely:
Parabola runs.
Shallow correction.
Final push into target zone.
Then done.
The same structure appeared
in the 2002 to 2007 cycle.
Almost identical.
─────────────────
Three indices.
Three independent fractal sources.
Three separate projection methods.
One convergence window:
mid-June to early July 2026.
As long as the structure holds,
the fractal remains intact.
No guarantees. Never are.
But the window is narrowing.
CIF: 82/90 — WARNING LEVEL ORANGE.
@TheBigCycleGame
Not financial advice. DYOR.
#DotComFractal #Russell2000 #FinalPhase
#CIF #TheBigCycleGame
1
10
523
Jun 1
DOT-COM FRACTAL UPDATE — June 1, 2026
─────────────────
NASDAQ 100
Current: 30,333
From March low: 31%
Target zone: 32,000 — 32,500
Remaining upside: ~6%
─────────────────
The Nasdaq is following the S&P 500
Dot-Com structure from 1995 to 2000.
Not its own pattern from that era.
The parabolic phase is running.
The small consolidation is complete.
Two structural projections
point to the same window.
The mirrored trendline
from the April 2025 low
to the October 2025 high,
reapplied from the March 2026 low,
defines the target zone:
32,000 — 32,500.
The mirrored trendline
from the current parabolic move,
from the start of the April 2026 acceleration
to the recent shallow consolidation,
reapplied from the consolidation low,
carries the current momentum forward.
That projection points to:
mid to late June 2026.
─────────────────
One observation worth noting.
The smaller parabolic projection
suggests a potential overshoot
beyond the primary target zone.
If the Nasdaq extends into the 33,000 to 34,000 range,
that would represent the final exhaustion phase
typical of blow-off structures.
It would not break the thesis.
It would be the final chapter of it.
─────────────────
The compression factor of 3.2x
applied to the Dot-Com structure
confirms the same window independently.
─────────────────
As long as the structure holds,
the fractal remains intact.
No guarantees. Never are.
But the window is narrowing fast.
CIF: 82/90 — WARNING LEVEL ORANGE.
@TheBigCycleGame
Not financial advice. DYOR.
#DotComFractal #Nasdaq #FinalPhase
#CIF #TheBigCycleGame
1
1
13
529
Jun 1
DOT-COM FRACTAL UPDATE — June 1, 2026
─────────────────
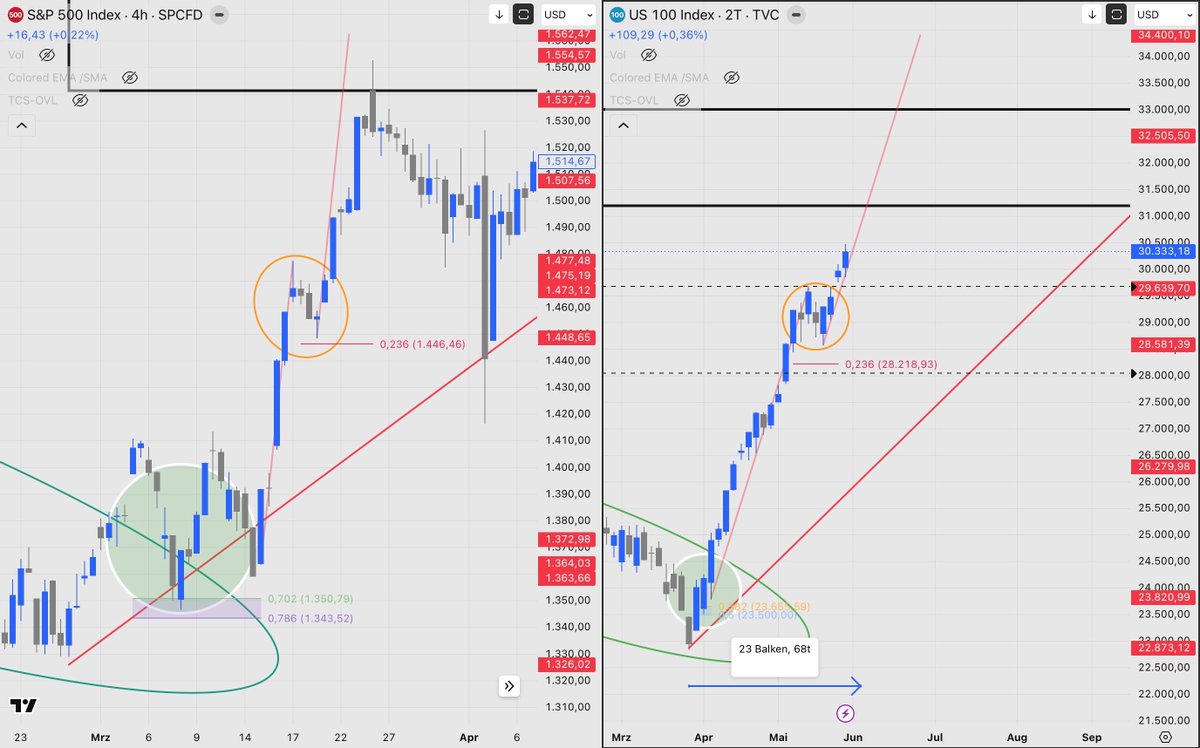
S&P 500
Current: 7,580
From March low: 20%
Target zone: 8,200 — 8,400
Remaining upside: ~10%
─────────────────
The parabolic phase is running.
The small consolidation is complete.
Two structural projections
point to the same window.
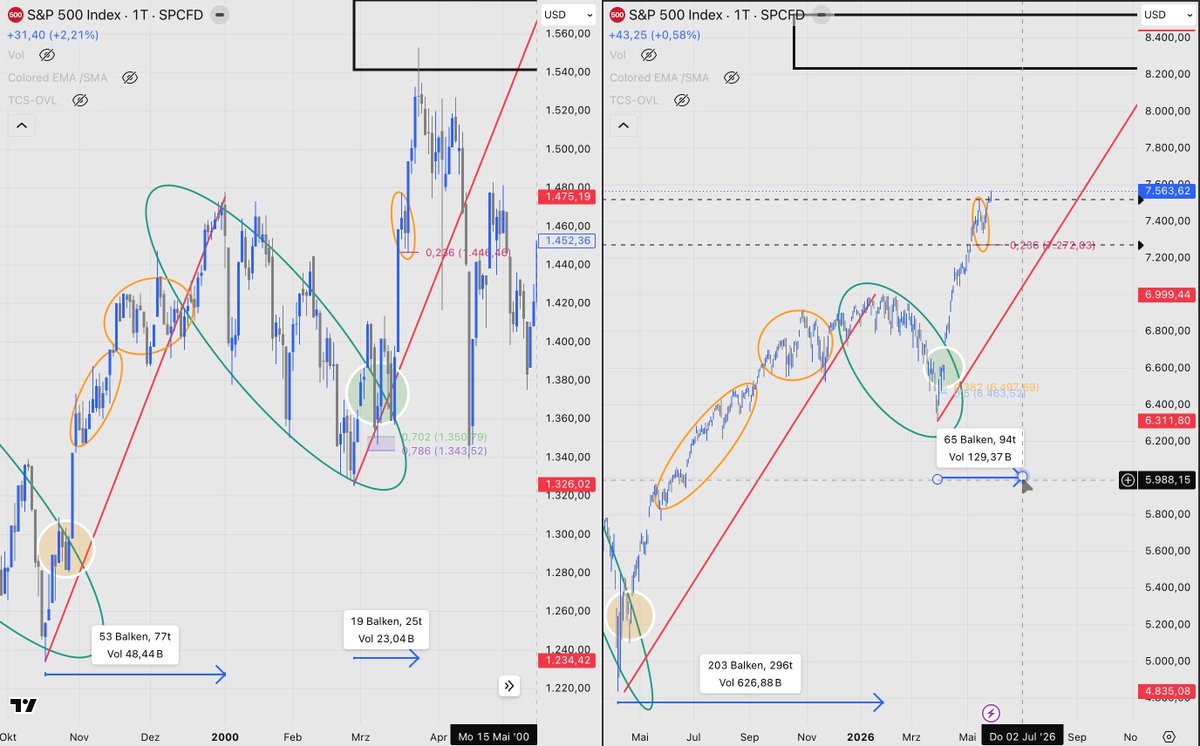
The mirrored trendline
from the prior rally into the January 2026 high
defines the target zone:
8,200 — 8,400.
The mirrored trendline
from the current parabolic move,
from the start of the April 2026 acceleration
to the recent shallow consolidation,
reapplied from the consolidation low,
carries the current momentum forward.
That projection also speaks to the target zone.
And it points to the timing:
mid-June to early July 2026.
─────────────────
The compression factor of 3.2x
applied to the Dot-Com structure
confirms the same window independently.
Three structures. One conclusion.
─────────────────
As long as the structure holds,
the fractal remains intact.
No guarantees. Never are.
But the window is narrowing.
CIF: 82/90 — WARNING LEVEL ORANGE.
@TheBigCycleGame
Not financial advice. DYOR.
#DotComFractal #SPX #FinalPhase
#CIF #TheBigCycleGame
1
2
21
933
May 29
DOT-COM FRACTAL UPDATE — May 29, 2026
─────────────────
NASDAQ 100
Compression factor: 3.2x
Based on S&P Dot-Com structure.
Prior Nasdaq rally:
April 2025 to October 2025 — 204 days.
Divided by 3.2x: ~65 days.
Current rally started end of March 2026.
65 days brings us to:
early to mid-June 2026.
Current: 30,223
Target zone: 32,000 — 32,500
Remaining upside: ~6%
When Big Tech momentum exhausts
at the target zone —
rotation likely begins.
─────────────────
S&P 500
Compression factor: 3.2x
Final leg in Dot-Com: 77 days 25 days.
Current: 7,563
Target zone: 8,200 — 8,400
Remaining upside: ~10%
Final window: mid-June to early July 2026.
─────────────────
RUSSELL 2000
Compression factor: 2.5x
Following its own Dot-Com fractal.
Prior Russell rally:
194 trading days.
Divided by 2.5x: ~97 days.
Current rally at ~97 days.
Structure nearly complete.
Current: 2,932
Target zone: 3,150 — 3,223
Remaining upside: ~10%
Timeline: late June to early July 2026.
─────────────────
Three fractals. Three compression factors.
Three separate structures.
One convergence window:
Mid-June to early July 2026.
Nasdaq could arrives first.
S&P and Russell follow.
When Nasdaq momentum exhausts
rotation likely begins.
That rotation strengthens
the case for what comes next.
The fractal has been precise.
The window is narrowing.
CIF: 82/90 — WARNING LEVEL ORANGE.
@TheBigCycleGame
Not financial advice. DYOR.
#DotComFractal #Nasdaq #SPX
#Russell2000 #FinalPhase
#CIF #TheBigCycleGame


1
1
14
907
May 27
DOT-COM FRACTAL UPDATE — May 27, 2026
─────────────────
S&P 500
Weakest momentum of the three.
But breaking out nonetheless.
Pre-market: testing the prior high.
If pressure holds and momentum
stays on track —
the direction remains up.
CIF: 82/90 — WARNING LEVEL ORANGE.
@TheBigCycleGame
Not financial advice. DYOR.
#DotComFractal #SPX
#FinalPhase #CIF #TheBigCycleGame
May 25

DOT-COM FRACTAL UPDATE — MAY 25, 2026
S&P 500
Closed: 7,473
19% above March 2026 low
8 consecutive green weeks
─────────────────────────────
Fractal structure: intact.
Following its own Dot-Com pattern
on the weekly and the sub-timeframes.
Today — US markets closed (Memorial Day)
S&P futures already printed a new high.
The May 14th high has been taken out
in pre-market trading.
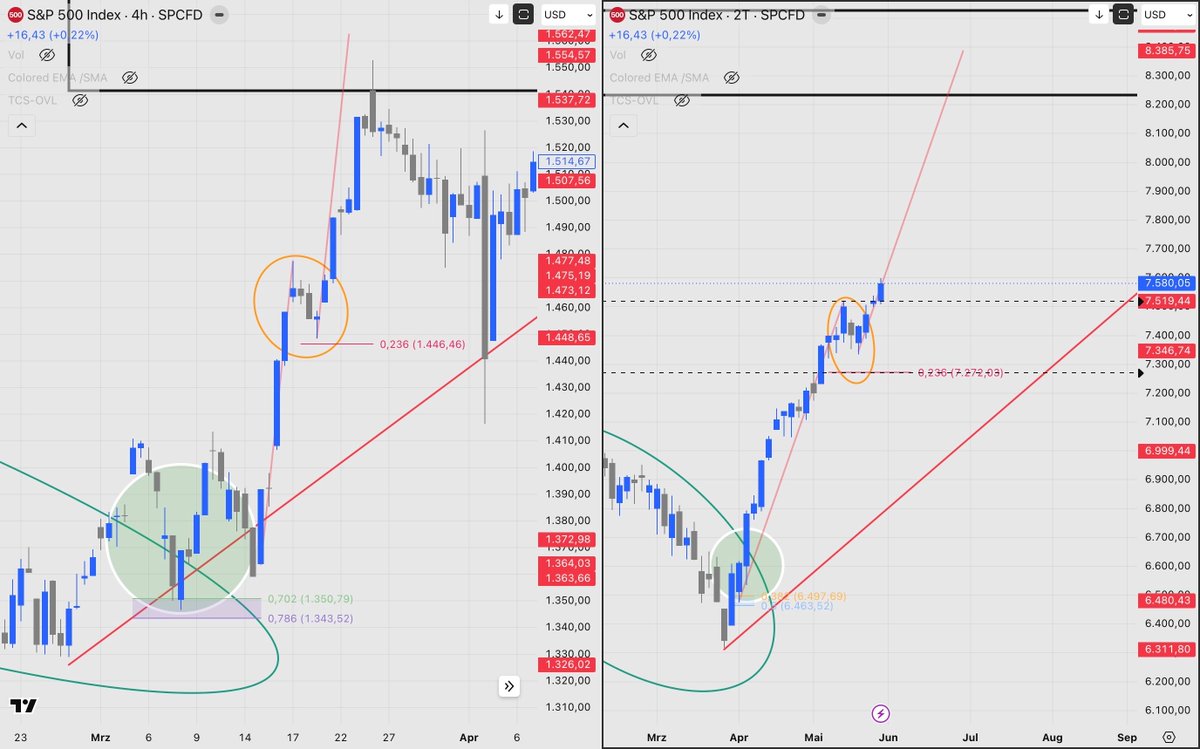
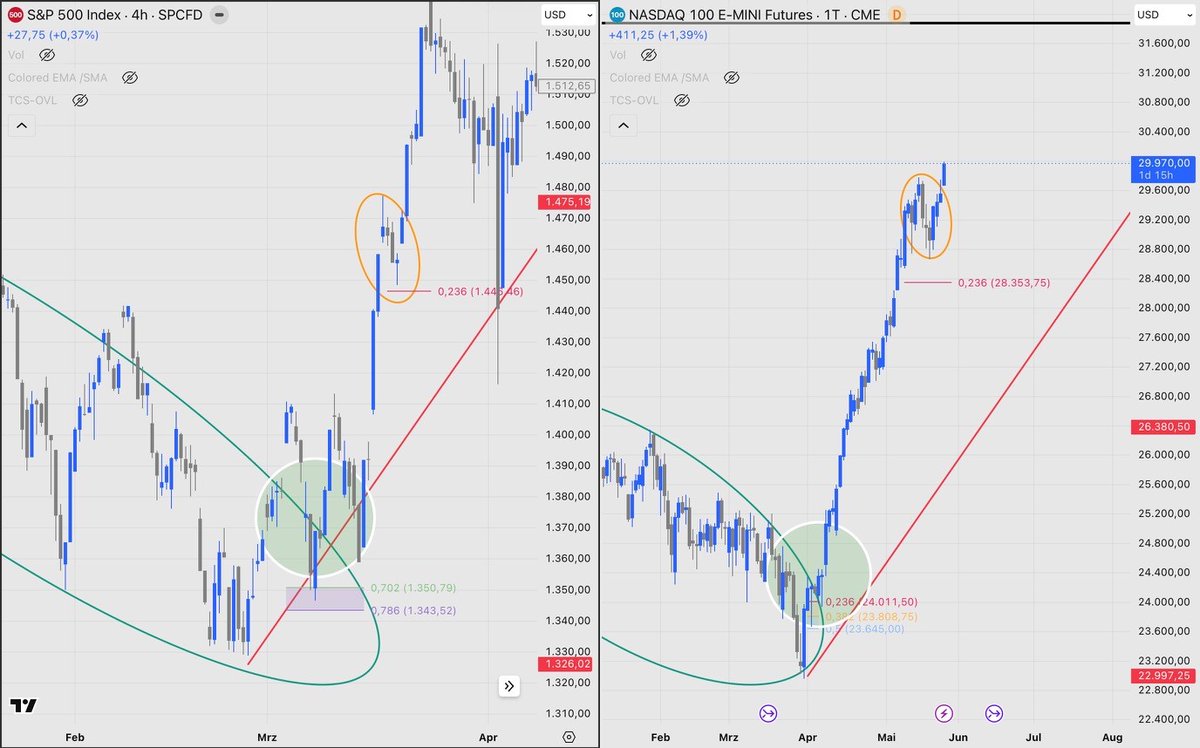
Looking at the 4H sub-structure from 2000:
the Dot-Com correction never fully reached
the 0.236 Fib either.
It turned early — and ran.
The current structure shows the same.
─────────────────────────────
Target zone: 8,100 — 8,400
Upside from here: ~8 — 12%
Structure: final leg pending
Timing projection — Dot-Com compression applied:
Mid to late June 2026.
Timing analysis is inherently imprecise.
This is a structural projection only —
derived from Dot-Com pattern compression.
As long as the structure holds,
the timing picture remains broadly intact.
@TheBigCycleGame
Not financial advice. DYOR.
#SPX #DotComFractal #MacroAnalysis
#FinalPhase #CIF #TheBigCycleGame
1
1
13
1,610
May 27
DOT-COM FRACTAL UPDATE — May 27, 2026
─────────────────
RUSSELL 2000
Clean breakout.
Substructure following the Dot-Com
parallel with remarkable precision.
Buying pressure intact.
If momentum holds
the final move has likely started.
CIF: 82/90 — WARNING LEVEL ORANGE.
@TheBigCycleGame
Not financial advice. DYOR.
#DotComFractal #Russell2000
#FinalPhase #CIF #TheBigCycleGame

May 25
DOT-COM FRACTAL UPDATE — MAY 25, 2026
RUSSELL 2000
Closed: 2,862
~19% above March 2026 low
6 green weeks — week 7 first red — week 8 green again
Bullish weekly close
─────────────────────────────
The Russell follows its own Dot-Com fractal
independent of the S&P and Nasdaq.
Three separate fractals.
Three independent structures.
All pointing to the same window.
Today the Russell is within 0.1%
of its all-time high.
Currently challenging the May 6th high.
The structure remains clean.
The momentum remains intact.
─────────────────────────────
Target zone: 3,100 — 3,300
Upside from here: ~8 — 15%
Structure: final leg pending confirmation
Timing projection — Dot-Com compression applied:
Late June to early July 2026.
Timing analysis is inherently imprecise.
This is a structural projection only.
As long as the structure holds,
the timing picture remains broadly intact.
─────────────────────────────
Three fractals. Three structures. One window.
The S&P and Nasdaq futures are already
at new highs today — Memorial Day.
The Russell is 0.1% away.
The momentum is larger than the fundamentals.
The pattern says: the move wants to continue.
CIF: 82/90 — WARNING LEVEL ORANGE.
@TheBigCycleGame
Not financial advice. DYOR.
#RUT #DotComFractal #MacroAnalysis
#FinalPhase #CIF #SmallCaps #TheBigCycleGame

1
11
787
May 27
DOT-COM FRACTAL UPDATE — May 27, 2026
─────────────────
As noted Monday:
two scenarios remained open.
Retest of the 0.236 retracement.
Or direct continuation.
The market appears to have chosen.
─────────────────
NASDAQ 100
Breakout.
Strong momentum.
Buying pressure from below intact.
If this holds —
the final move according to
the Dot-Com parallel
has likely started.
─────────────────
S&P 500 and Russell 2000 updates follow.
CIF: 82/90 — WARNING LEVEL ORANGE.
@TheBigCycleGame
Not financial advice. DYOR.
#DotComFractal #Nasdaq
#FinalPhase #CIF #TheBigCycleGame
May 25
DOT-COM FRACTAL UPDATE — MAY 25, 2026
NASDAQ 100
Closed: 29,481
~30% above March 2026 low
6 green weeks — week 7 first red — week 8 green again
─────────────────────────────
Many analysts track the Nasdaq
against its own Dot-Com fractal.
That reading points to two more years.
That is not the fractal I track.
The Nasdaq is following the S&P 500
Dot-Com fractal — not its own.
The structural overlap is remarkable.
Today with US markets closed
Nasdaq futures have already printed
a new all-time high.
The May 14th high has been taken out.
The 0.236 Fib (~28,218) was approached
but never fully touched.
In the 2000 sub-structure,
the same happened - the correction turned early
without completing the Fib level.
─────────────────────────────
Target zone: 32,000 — 33,000
Upside from here: ~8 — 12%
Structure: final leg in motion
Timing projection — Dot-Com compression applied:
Early to mid-June 2026.
Timing analysis is inherently imprecise.
This is a structural projection only.
As long as the structure holds,
the timing picture remains broadly intact.
@TheBigCycleGame
Not financial advice. DYOR.
#NDX #DotComFractal #MacroAnalysis
#FinalPhase #CIF #TheBigCycleGame
1
2
17
1,179
May 26
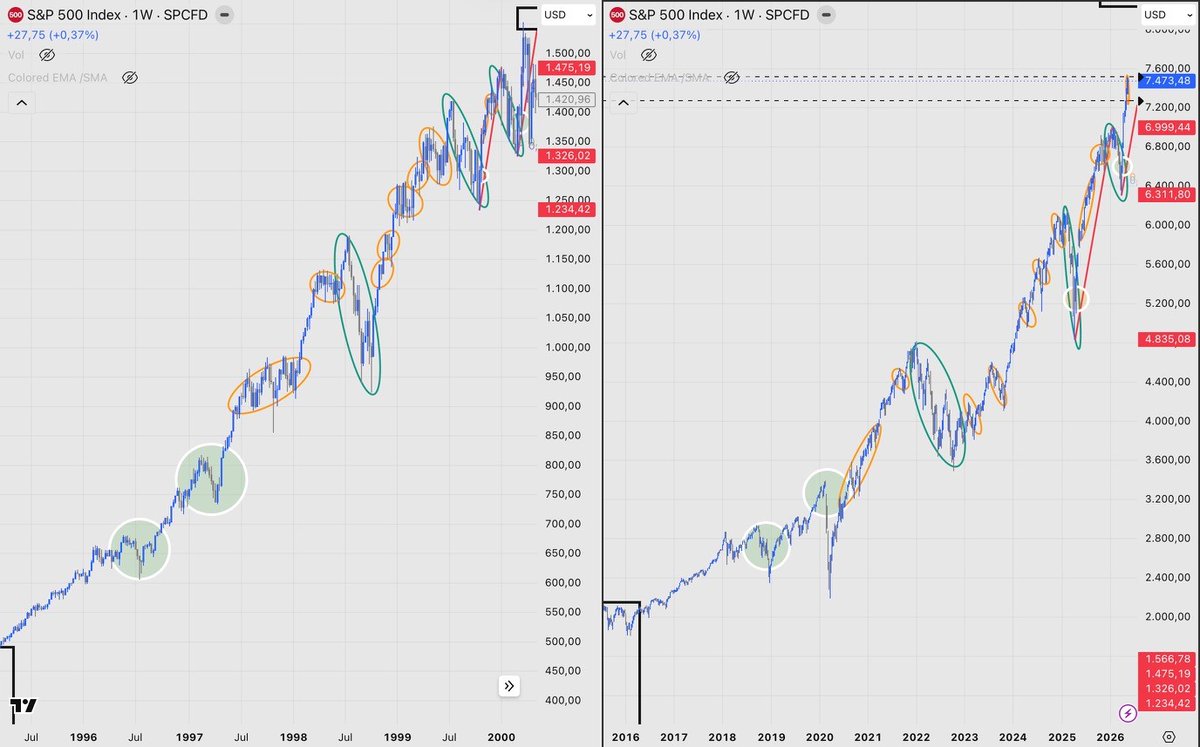
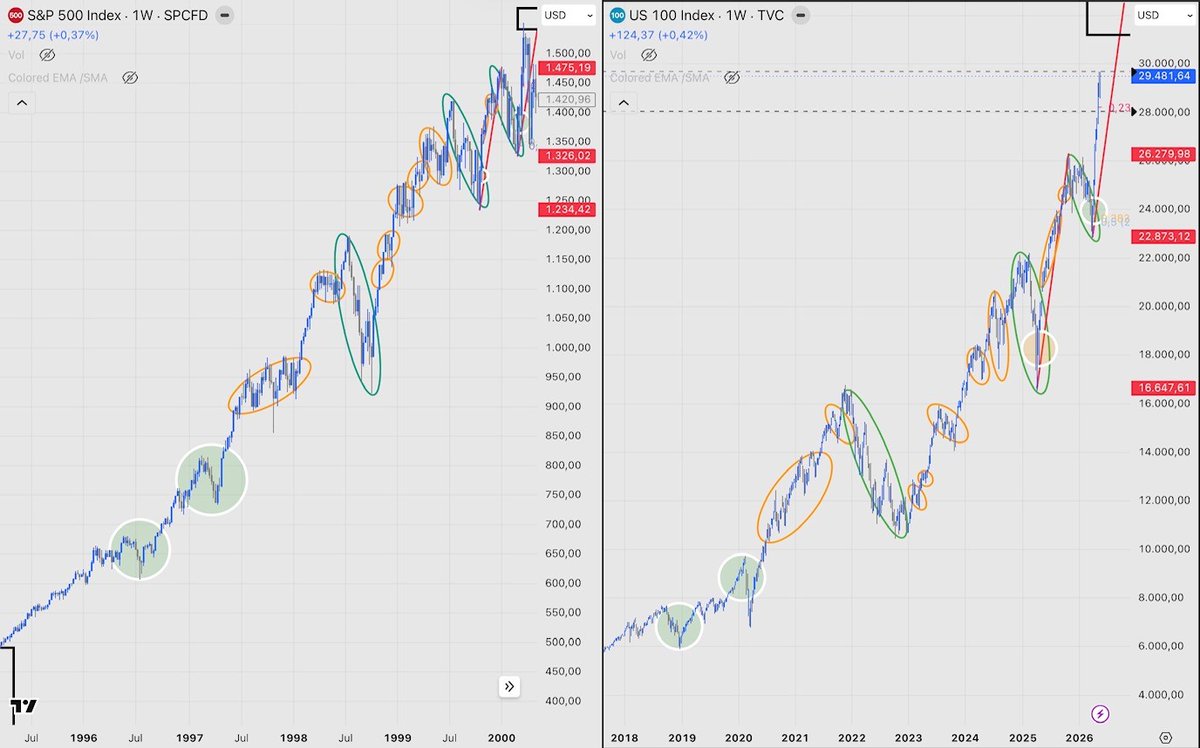
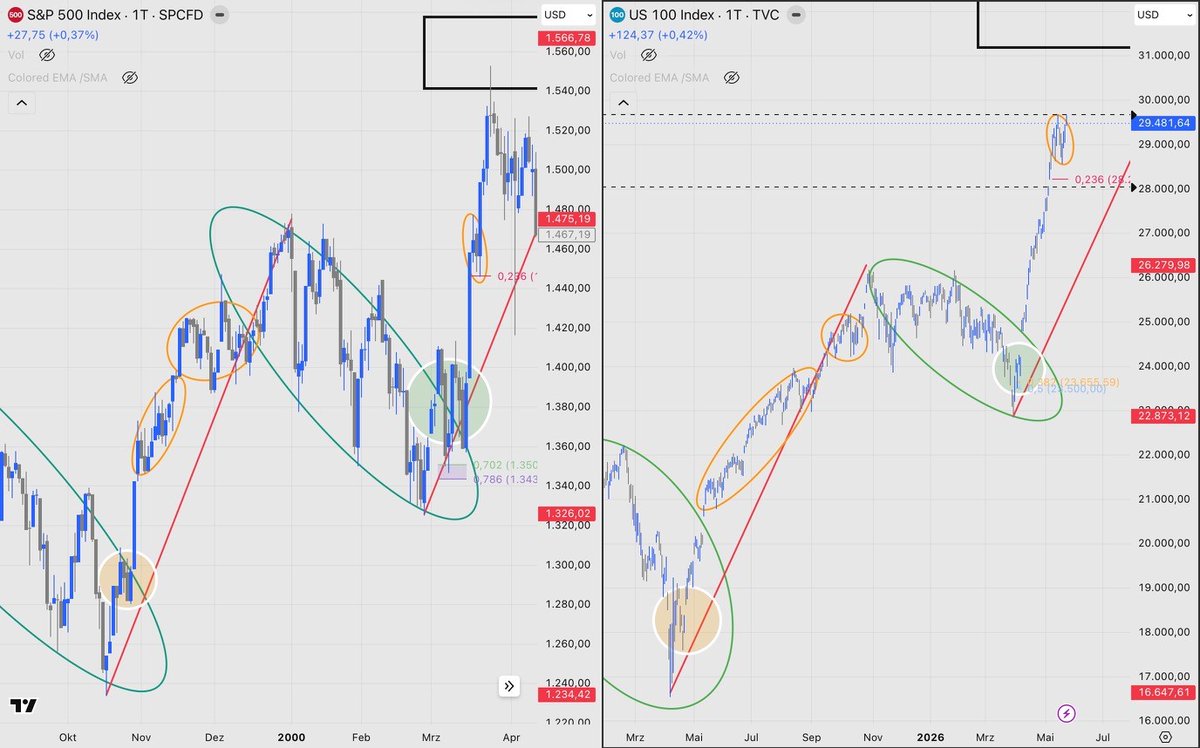
THREE CHARTS. ONE SIGNAL.
Keep it simple.
1996 – 2000 S&P 500.
2018 – 2026 S&P 500.
2018 – 2026 Nasdaq.
Three independent structures.
Same sequence. Same pattern. Same position.
The final move is likely already underway.
No guarantees. Never are.
But be prepared.
CIF: 82/90 — WARNING LEVEL ORANGE.
@TheBigCycleGame
Not financial advice. DYOR.
#DotComFractal #SPX #Nasdaq
#FinalPhase #CIF #TheBigCycleGame

2
2
27
1,542
May 25
DOT-COM FRACTAL UPDATE — MAY 25, 2026
RUSSELL 2000
Closed: 2,862
~19% above March 2026 low
6 green weeks — week 7 first red — week 8 green again
Bullish weekly close
─────────────────────────────
The Russell follows its own Dot-Com fractal
independent of the S&P and Nasdaq.
Three separate fractals.
Three independent structures.
All pointing to the same window.
Today the Russell is within 0.1%
of its all-time high.
Currently challenging the May 6th high.
The structure remains clean.
The momentum remains intact.
─────────────────────────────
Target zone: 3,100 — 3,300
Upside from here: ~8 — 15%
Structure: final leg pending confirmation
Timing projection — Dot-Com compression applied:
Late June to early July 2026.
Timing analysis is inherently imprecise.
This is a structural projection only.
As long as the structure holds,
the timing picture remains broadly intact.
─────────────────────────────
Three fractals. Three structures. One window.
The S&P and Nasdaq futures are already
at new highs today — Memorial Day.
The Russell is 0.1% away.
The momentum is larger than the fundamentals.
The pattern says: the move wants to continue.
CIF: 82/90 — WARNING LEVEL ORANGE.
@TheBigCycleGame
Not financial advice. DYOR.
#RUT #DotComFractal #MacroAnalysis
#FinalPhase #CIF #SmallCaps #TheBigCycleGame
2
1
14
1,512
May 25
DOT-COM FRACTAL UPDATE — MAY 25, 2026
NASDAQ 100
Closed: 29,481
~30% above March 2026 low
6 green weeks — week 7 first red — week 8 green again
─────────────────────────────
Many analysts track the Nasdaq
against its own Dot-Com fractal.
That reading points to two more years.
That is not the fractal I track.
The Nasdaq is following the S&P 500
Dot-Com fractal — not its own.
The structural overlap is remarkable.
Today with US markets closed
Nasdaq futures have already printed
a new all-time high.
The May 14th high has been taken out.
The 0.236 Fib (~28,218) was approached
but never fully touched.
In the 2000 sub-structure,
the same happened - the correction turned early
without completing the Fib level.
─────────────────────────────
Target zone: 32,000 — 33,000
Upside from here: ~8 — 12%
Structure: final leg in motion
Timing projection — Dot-Com compression applied:
Early to mid-June 2026.
Timing analysis is inherently imprecise.
This is a structural projection only.
As long as the structure holds,
the timing picture remains broadly intact.
@TheBigCycleGame
Not financial advice. DYOR.
#NDX #DotComFractal #MacroAnalysis
#FinalPhase #CIF #TheBigCycleGame
1
3
18
2,349
May 25
DOT-COM FRACTAL UPDATE — MAY 25, 2026
S&P 500
Closed: 7,473
19% above March 2026 low
8 consecutive green weeks
─────────────────────────────
Fractal structure: intact.
Following its own Dot-Com pattern
on the weekly and the sub-timeframes.
Today — US markets closed (Memorial Day)
S&P futures already printed a new high.
The May 14th high has been taken out
in pre-market trading.
Looking at the 4H sub-structure from 2000:
the Dot-Com correction never fully reached
the 0.236 Fib either.
It turned early — and ran.
The current structure shows the same.
─────────────────────────────
Target zone: 8,100 — 8,400
Upside from here: ~8 — 12%
Structure: final leg pending
Timing projection — Dot-Com compression applied:
Mid to late June 2026.
Timing analysis is inherently imprecise.
This is a structural projection only —
derived from Dot-Com pattern compression.
As long as the structure holds,
the timing picture remains broadly intact.
@TheBigCycleGame
Not financial advice. DYOR.
#SPX #DotComFractal #MacroAnalysis
#FinalPhase #CIF #TheBigCycleGame
2
22
3,885
May 22
Handelsblatt. Today.
"AI boosts Asian stocks."
"Technology stocks are driving markets
in Japan and other Asian markets
significantly higher.
Chip and AI companies in particular
are benefiting from the recent recovery
of the US sector."
───────────────
Same day: a second article.
A handful of stocks where hedge funds
see more than 25% upside remaining.
Calm. Analytical. Measured.
No superlatives. No urgency.
───────────────
Asian markets are not just starting.
KOSPI: 320% since April 2025.
Nikkei: running its own blow-off.
Global markets in parabolic phases
reported like a routine morning update.
───────────────
This is worth paying attention to.
In 1999 into early 2000,
mainstream media coverage shifted.
The broad media landscape
began reporting euphorically —
right around the top.
During the top.
And in the weeks after.
By then, the move was already ending.
Right now:
coverage is still measured.
Still analytical.
Still finding reasons for more upside.
That gap between
what is happening in markets
and what the media is reflecting
is closing.
Slowly. But it is closing.
When that gap closes completely
when the headlines match the moves
that is historically the final signal.
We are not there yet.
But the direction is clear.
CIF: 82/90 (91.1%) — Warning Level Orange.
@TheBigCycleGame
Not financial advice. DYOR.
#MacroAnalysis #EndCycle #CIF
#Handelsblatt #Media #FinalPhase
#Nasdaq #SPX #Contrarian
#BlowOffTop #DotcomFractal

2
1
9
489
May 22
A possible path for crypto.
One that almost nobody is currently discussing.
Most analysts are positioned for one of two scenarios:
Extended range for months or even years.
Or a bear market following the large correction
in traditional markets.
Both are valid.
But there is a third scenario
that fits the current structure —
and that very few are considering.
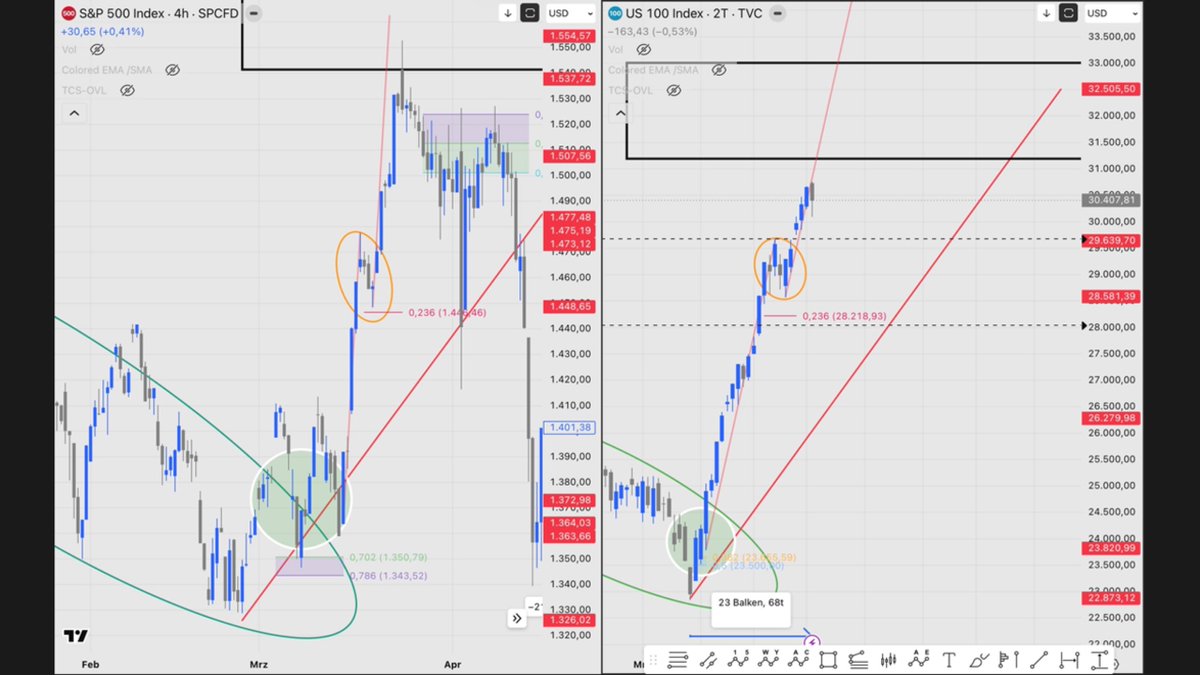
───────────────
The S&P 500 has been tracking the Dot-Com fractal
with remarkable precision for months.
Three phases. Here is how they map.
The timeline and boxes shown are derived
from the Dot-Com compression factor
and projected onto today's structure.
They represent a rough orientation —
not a prediction, not a guarantee.
Phase I — Now:
S&P completes Wave 4.
The current consolidation finishes its structure.
Crypto largely sideways.
Phase II — Final leg:
S&P begins its last move higher
into the target zone.
This is the window where crypto
has the opportunity to move with it.
Bitcoin and altcoins begin closing the gap.
Phase III — The correction begins:
Traditional markets top out.
First sharp corrective move lower.
Crypto corrects with it.
Then the B-wave relief rally in traditional markets.
This is where crypto completes its final move.
───────────────
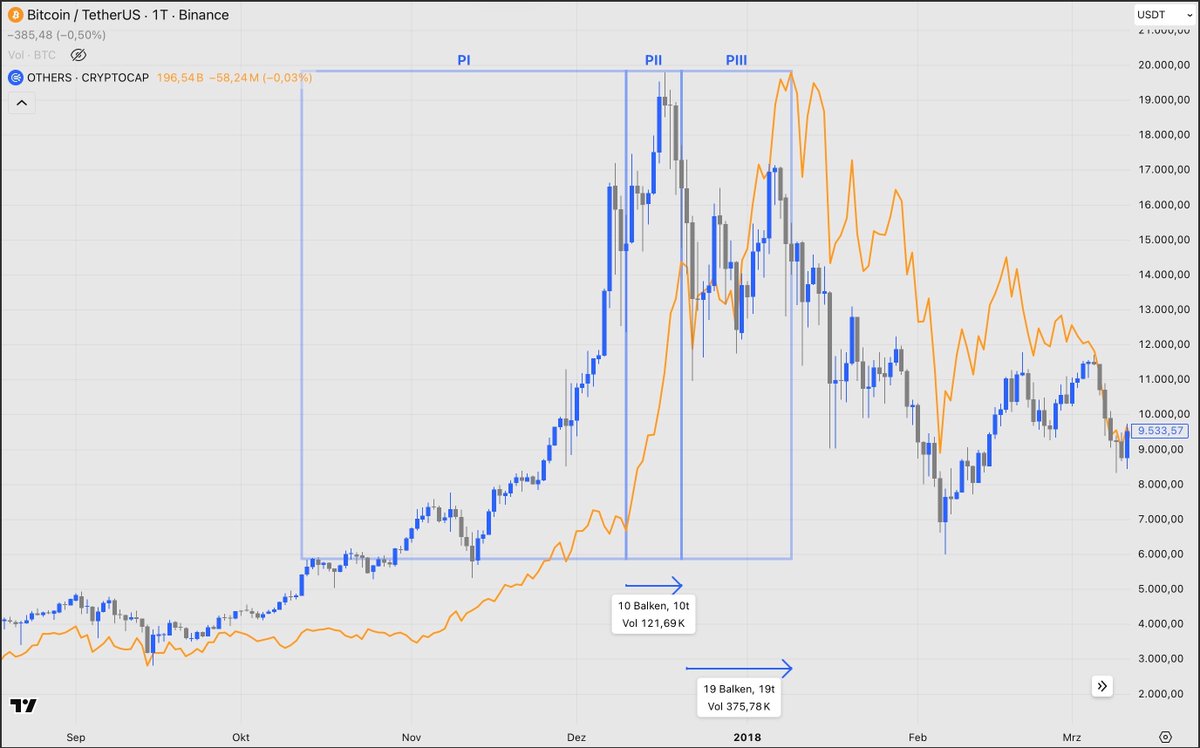
To illustrate the rotation mechanic
not as a direct comparison, but as a reference
2017 showed how this can work.
It was a mid-cycle move in a very different
macro environment. The mechanics, however,
are worth understanding.
Phase I: Bitcoin runs.
Altcoins participate, but without velocity.
Phase II: Bitcoin enters its final move.
Altcoins accelerate.
Phase III: Bitcoin corrects.
Altcoins complete their final move
in Bitcoin's relief rally.
That entire sequence played out
in roughly one month.
Now apply a Dot-Com compression factor.
What took weeks in a linear cycle
could take days in a compressed one.
───────────────
Whether Bitcoin makes a new all-time high
in this scenario the structural data
is not conclusive enough yet to make that call.
That question stays open for now.
───────────────
Could this play out differently? Absolutely.
I track the Dot-Com fractal closely
and I believe in the structural thesis.
But I hold that conviction without arrogance.
Markets do not owe anyone a specific outcome.
This is a structural projection — not a guarantee.
What I can say:
the scenario most people are not considering
is often the one that plays out.
CIF: 82/90 — WARNING LEVEL ORANGE.
@TheBigCycleGame — Not financial advice. DYOR.
#Bitcoin #Crypto #DotComFractal #Rotation
#BlowOffTop #FinalPhase #CIF #Altcoins
#MacroAnalysis #TheBigCycleGame

4
1
27
994
May 21
EXPONENTIAL VS. LINEAR
Most crypto analysts are looking
at the last four-year cycle.
They see the pattern.
Structures build over months.
Then they unwind in the final weeks.
Step by step. Signal by signal.
Confirmation before the move.
That is linear thinking.
And it worked — until it didn't.
───────────────
The traditional market just showed us
what the alternative looks like.
April 2025: -21% correction.
Everyone called it the end.
Structures broken. Recession incoming.
Recovery to ATH: 80 days.
March 2026: -10% correction.
Same calls. Same conclusions.
Recovery to ATH: 15 days.
Half the correction depth.
One fifth of the time.
That is not linear.
That is acceleration.
───────────────
And while that was happening
the S&P ran 19% from its lows.
The Nasdaq 30%.
Annual returns processed in weeks.
Structures that should have taken months
completed in days.
Most participants missed it
because they were waiting
for the linear setup that never came.
The market did not wait for confirmation.
It moved without permission.
───────────────
Now the question everyone is asking:
How can crypto possibly close the gap
in the time that remains?
The gap is too large.
The structures are not forming.
The setup is not there.
That question assumes linear logic
still applies.
In a phase where exponential moves
have replaced linear progression
gaps close fast.
Structures form and complete
before most participants recognize them.
The crypto market has always been capable
of violent, fast moves
when momentum ignites.
Add a blow-off rotation from traditional markets.
Add the compression factor
we have observed across every index.
Add the highest-beta asset class in the world
sitting largely unloved and underpositioned.
The theory is clear:
the gap does not need months to close.
It can close in weeks.
───────────────
This post is not about FOMO.
It is about preparation.
The bear market scenario is not off the table.
It never is.
But in a phase where traditional markets
are running exponentially
where rotation into risk assets
is the structural logic of blow-off tops
the probability that crypto participates
is higher than the consensus currently prices.
Not because of a signal.
Not because of a setup.
Because of what phase we are in.
───────────────
The last phase is not linear.
It does not announce itself.
It does not wait for indicators to align.
It does not care about the 200-day moving average.
It moves.
Fast. Hard. Without warning.
Anyone still applying the logic
of the last cycle to this one
is using the wrong map.
There is no blueprint for this phase.
Crypto has never been here before
alongside a blow-off top
in traditional markets simultaneously.
But the rotation logic is structural.
And structural logic
does not ask for permission either.
CIF: 82/90 (91.1%) — Warning Level Orange.
@TheBigCycleGame
Not financial advice. DYOR.
#Bitcoin #Crypto #EndCycle
#CIF #Contrarian #FinalPhase #Rotation
#MacroAnalysis #BlowOffTop
#Altcoins

13
7
67
5,917
May 20
BONDS ARE RISING.
MARKETS ARE RISING.
THIS HAS HAPPENED BEFORE.
───────────────
10-year Treasury yields above 4.6%.
Headlines warning of market danger.
Social media: this is the crash signal.
Before concluding that —
it is worth looking at what happened
the last time this narrative dominated.
───────────────
October 1999 to January 2000.
10-year yields rose from ~4.2% to ~6.8%.
Fed raised rates 1.75% across the cycle.
No QE. No accommodation. No rate cuts.
The S&P ran its final parabolic push anyway.
Bonds and equities rose simultaneously.
The market ignored every rate signal.
Then it topped.
Then it crashed.
Not because yields were rising.
Because the business cycle turned.
───────────────
Today: yields above 4.6%.
Today: S&P tracking the same fractal
with remarkable precision.
The parallel is not one data point.
It is seven independent dimensions
converging simultaneously.
The fractal — weekly, monthly, daily — identical.
Rally without QE — then and now.
Rising yields during the final push — then and now.
Bonds and equities rising together — then and now.
Third-worst market breadth in this run —
dotcom had the second-worst.
IPO wave — then: internet.
Now: AI. SpaceX June 12. OpenAI. Anthropic.
Time compression factor — 3.5-3.7x
confirmed across S&P, Nasdaq, Russell.
Seven dimensions.
All pointing the same direction.
All consistent with late 1999.
───────────────
The crypto market is currently pricing in
a world where only lower rates
lead to rallies.
That model has never been tested
against a dotcom-style finale.
Because in the 1990s,
crypto did not exist.
The Russell never needed rate cuts.
It ran 21% from March lows anyway.
The S&P never needed QE.
It ran 19% regardless.
The rates argument
is the most crowded reason
to miss the final move.
───────────────
Yields may still rise further.
A rate hike in July is being discussed.
That is not new information.
In 1999 it was also not new information.
The market ran anyway.
The finale does not require
the conditions the crowd expects.
It requires the crowd to be
positioned for the wrong scenario.
Right now — they are.
───────────────
History does not repeat.
But when seven independent dimensions
align with a prior cycle simultaneously —
that is not coincidence.
That is structure.
And structure ends
whether it is convenient or not.
CIF: 82/90 (91.1%) — Warnstufe Orange.
@TheBigCycleGame
Not financial advice. DYOR.
#MacroAnalysis #EndCycle #CIF
#Bonds #Yields #DotcomFractal
#SPX #Nasdaq #FinalPhase
#Contrarian #BusinessCycle

1
1
21
1,289