
That's why I like C: it's uses the environment instead of a bloated runtime. Enable coredump, use gdb and be happy with stacktrace and lot of more useful tools.
21

New in Laravel Tackle: Sentry integration.
The AI agent can now read your Sentry issues directly (exception, stacktrace, breadcrumbs, request context) and fix the bug without you leaving the terminal.
90


Jun 8
real functional bros use 138 levels of recursion, `head -n5` the stacktrace and uninstall valgrind before writing any code
5
174

Jun 4
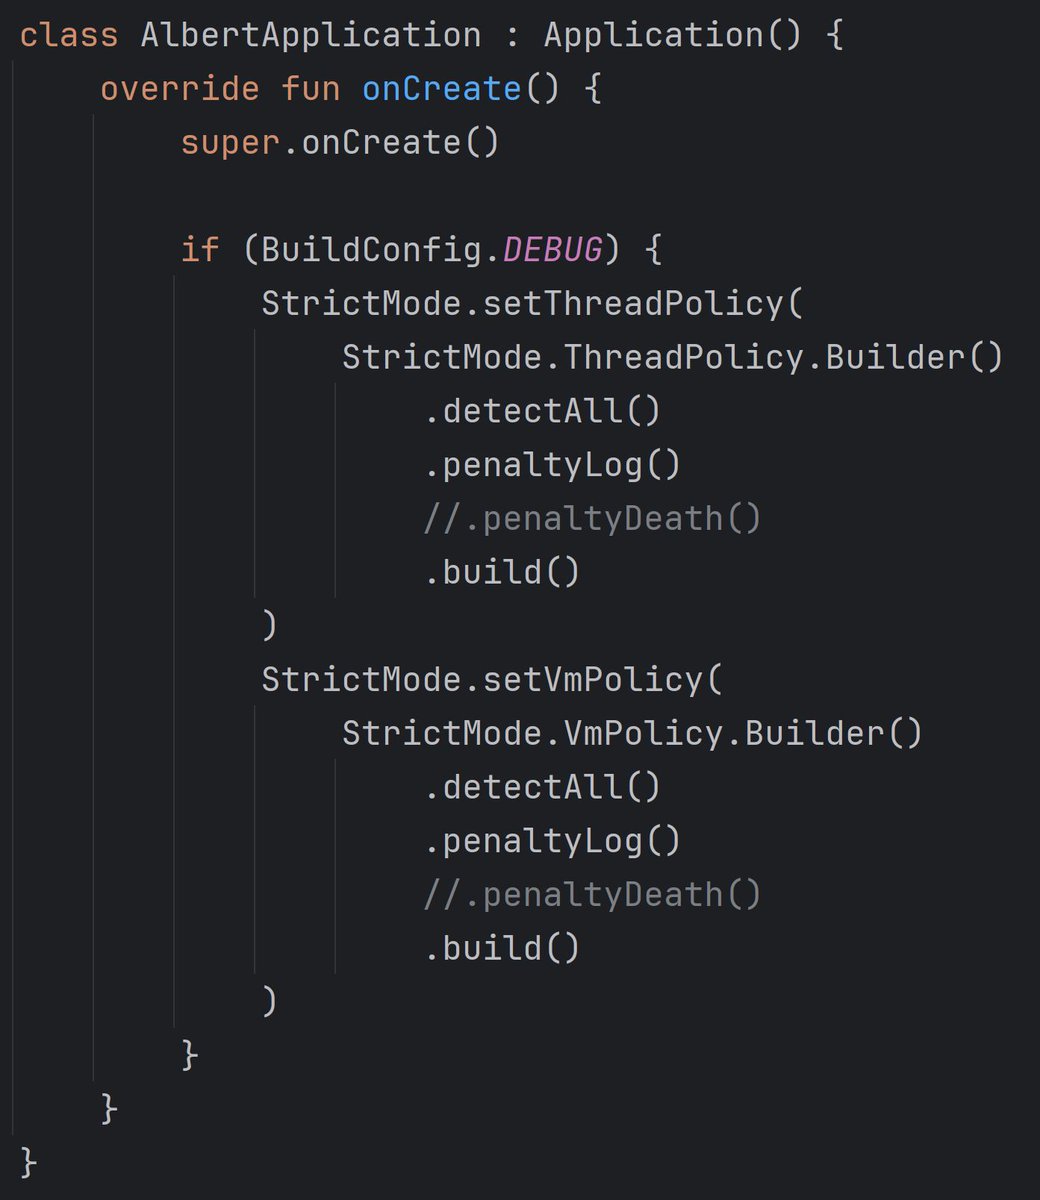
StrictMode is a developer tool which detects things you might be doing by accident and brings them to your attention so you can fix them.
StrictMode.ThreadPolicy among others can detect:
- slow (blocking) operations on UI thread (detectCustomSlowCalls())
- blocking disc reads/writes on UI thread (detectDiskReads()/detectDiskWrites())
- mismatches between defined resource types and getter calls (detectResourceMismatches())
StrictMode.VmPolicy among others can detect:
- leaks of Activity subclasses (detectActivityLeaks())
- when an SQLiteCursor or other SQLite object is finalized without having been closed. (detectLeakedSqlLiteObjects())
- when your app is blocked from launching a background activity or a PendingIntent created by your app cannot be launched (detectBlockedBackgroundActivityLaunch())
- when the calling application exposes a file:// Uri to another app (detectFileUriExposure())
- attempts to invoke a method on a Context that is not suited for such operation (detectIncorrectContextUse())
For both of them, we can specify a penalty:
- penaltyLog() - Logs detected violations to the system log.
- penaltyDeath() - Crashes the whole process on violation.
- penaltyDialog() - Shows an annoying dialog to the developer on detected violations, rate-limited to be only a little annoying.
- penaltyDropBox() - Enables detected violations log a stacktrace and timing data to the DropBox on policy violation.
- penaltyFlashScreen() - Flashes the screen during a violation.
- penaltyListener(…) - Set specific listener on violation.
1
10
71
3,142


May 30
The next article in my "Understanding the Go Runtime" series is about something every Go programmer has stared at: the stacktrace you get when your program panics.
What I love is how cleanly it splits into two parts:
First the unwinder climbs your stack and recovers the program counter of each function call, from the panic all the way up.
Then the symbolization takes each of those raw program counters and resolves it into something readable: the function name, the source file, and the line number. It does this by querying a metadata table the compiler baked into your binary.
I'm following the path from the moment you panic() all the way to the trace printed on your terminal.
Article coming Monday!
Want these articles directly in your inbox? Subscribe to the newsletter: internals-for-interns.com/ne…
#Go #Golang #Runtime
2
7
56
1,468

May 29
Compared to terminal program just failing with a stacktrace, I find those explosion just add to the beauty of rocket engineering.
1
7
23
626

May 26
9 trilhões de tokens.
garanto q metade disso aí é os dev com preguiça de ler log e jogando o erro inteiro da stacktrace pro deepseek resolver.
agente sustenta esses cluster chinês puramente com débito técnico e choro.
May 26

here comes DeepSeek freakout 2.0:
Weekly usage of Chinese AI models reached 9.223 trillion tokens, a 19.89% increase compared to the previous week; while the weekly usage of US AI models was 4.93 trillion tokens, a 16.27% increase compared to the previous week. Chinese models have surpassed the US in weekly usage for 4 consecutive weeks and remain the world's number one. DeepSeek-V4-Flash topping the charts
stcn.com/article/detail/3925…

3
401

May 25
Go has something similar - it models errors as values. Though you can choose to not handle it and it doesn’t block compilation (unless you are creating an unused variable)
IMO even though exceptions have stacktrace associated - I’ve always found them hard to reason about cause it causes weird jumps in control flows. An exception at any part of the code may bubble up and handled in unexpected ways. Also the shape of try / catch it introduces considering separate higher / lower functions is also somewhat ugly.
Errors as values on the orher hand make it explicit. There is no weird jumps in control flows and its much more clear what errrors a function throws. (I am speaking about Go’s frame ofc - don’t know if works similarly in Rust)
1
7
528


May 24
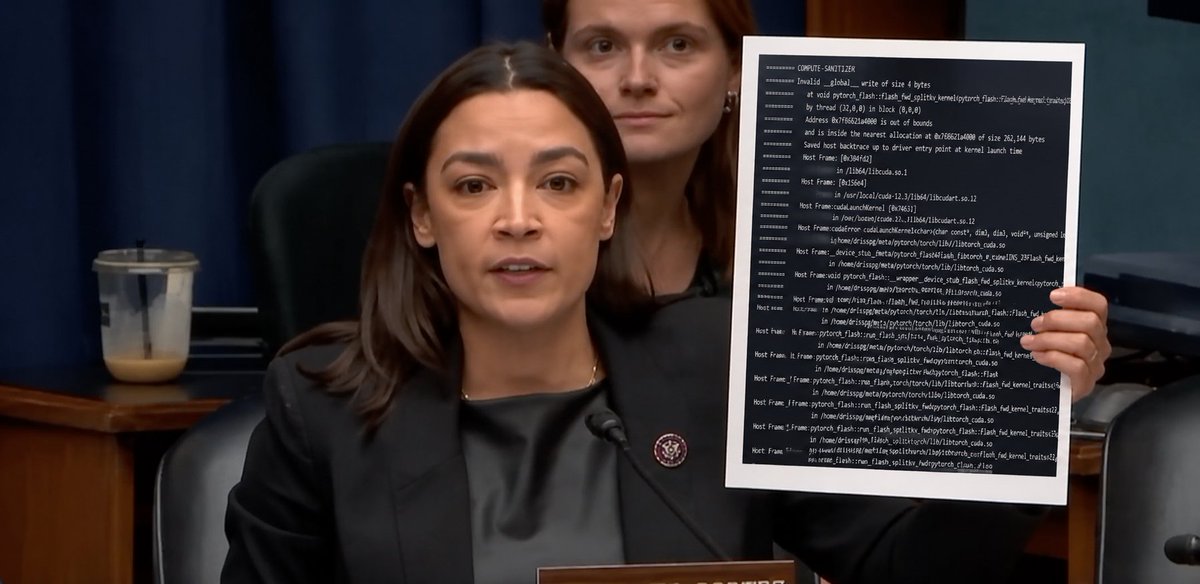
I have a stacktrace right here. This is stable diffusion in pytorch, right after flash-attention was updated. The only difference between clean wholesome image generation and this compute-sanitizer IMA was that flash-attention upgrade removing head dim 160 kernels. This is what stable diffusion now looks like in pytorch.
1
83
3,786


May 14
The single most important clue is 3:17.
That's not a time a human picks (3:00, 3:15, 3:30) are human-scheduled crons. 3:17 screams "something with a randomized offset"
Before I touch anything, I'd let it happen one more night with a profiler armed and a packet capture running.
If the stack trace points into our code, we have a scheduled job we don't know about.
If it points into the JVM/runtime or kernel, it's GC, JIT, or system-level.
If it points into a library, it's probably a background thread someone added in a transitive dep.
The answer is in the stacktrace
7
2,104
May 13
esse tweet tá parecendo uns ticket q pm abre no jira sexta a tarde. "eita aconteceu isso mesmo".
cadê o payload? cadê o stacktrace? cadê os log?
agente q lute pra debugar a fofoca no escuro pq o cara tem preguica de mandar o contexto da request.
3
67
25,555

May 12
More likely that a proper stacktrace just cannot be generated without the PDB, not the cause of the crash.
2
95