
21 Feb 2023
New in @ESAMonographs:
Underlying geology and climate interactively shape climate change refugia in mountain streams
doi.org/10.1002/ecm.1566
With #OpenData in @datadryad
#StreamConservation #FreshwaterBiodiversity #Geodiversity
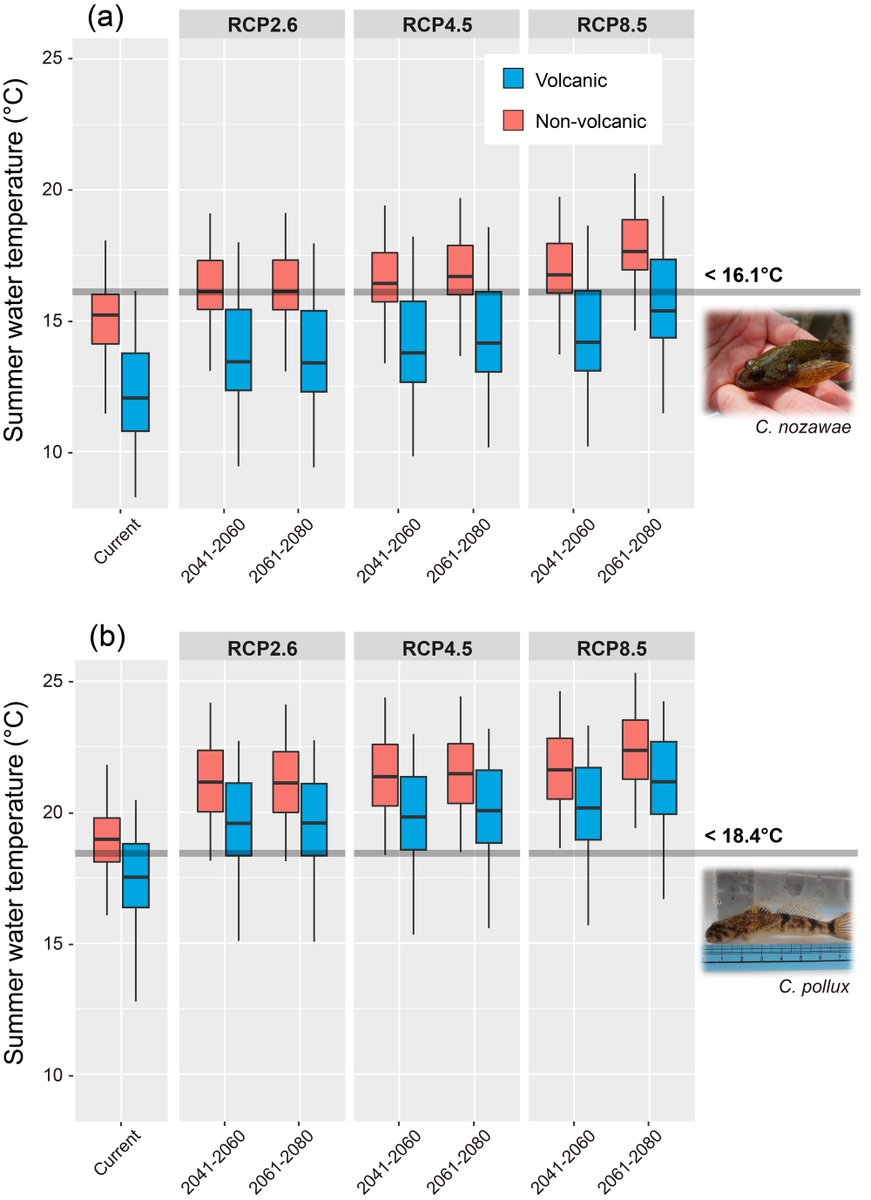
ALT The current and future mean summer water temperature and the relation to the thermal threshold for lotic sculpins in (a) northern Japan and (b) central Japan. Predictions are shown by each period and the RCP
1
3
546

31 Jan 2023
From our #FreshwaterEcology track:
Do @EPA's Indices of Watershed & Catchment Integrity (indicators of landscape condition) capture what makes a healthy stream?
doi.org/10.1002/ecs2.4350
#WaterQuality #StreamConservation #Watersheds #CleanWater #OpenAccess @EPAresearch
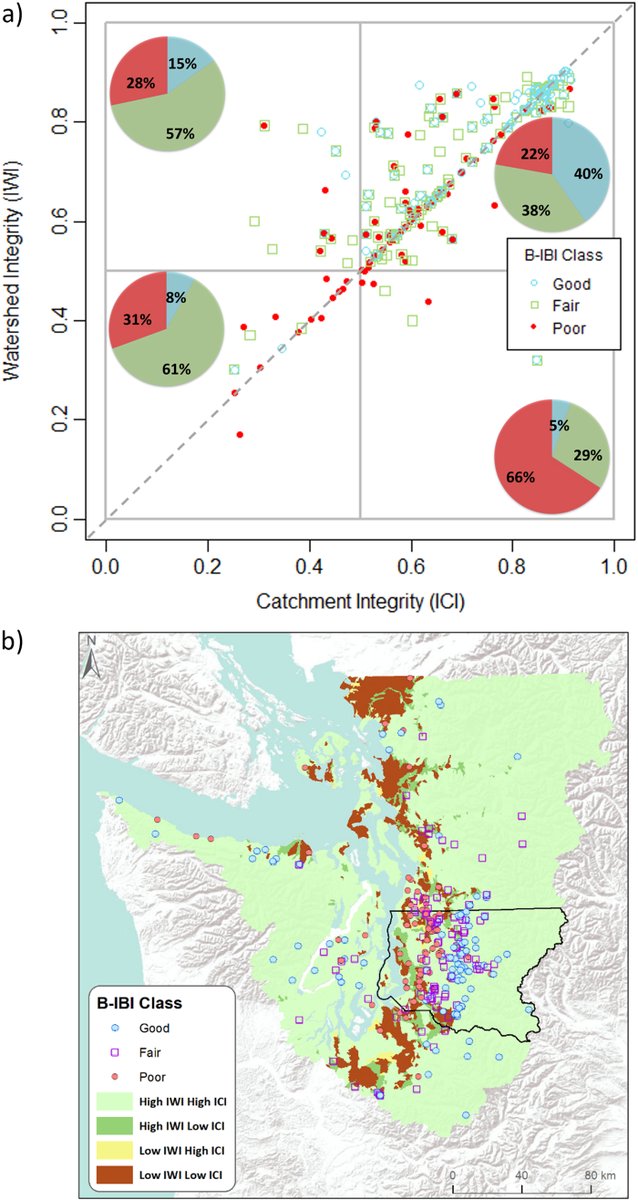
ALT (a) Plot using macroinvertebrate Benthic Index of Biotic Integrity (B-IBI) data for study area streams, showing the relationship between B-IBI condition and corresponding Index of Watershed Integrity (IWI) and Index of Catchment Integrity (ICI) values. Pie charts give the distribution of each B-IBI class in each quadrant. (b) Map showing study area catchments’ IWI and ICI levels, & sample locations & B-IBI conditions
1
2
1,917

27 Aug 2020
New in @ESAApplications, w/ #OpenData in @NCBI ’s Seq. Read Archive:
Fine sediment and flow velocity impact bacterial community and functional profile more than nutrient enrichment
@jaypiggott
@Freshinvert
#Microbiome #Biomonitoring #StreamConservation
doi.org/10.1002/eap.2212
4
6

17 Nov 2017
Good stream #stewardship is vital to the #conservation of our natural resources. Learn how you can support the effort to keep Ohio's streams healthy for future generations to enjoy: ow.ly/8YOB30gE74M #fishohio #streamfish #streamconservation #darterfish
1
6