
Apr 14
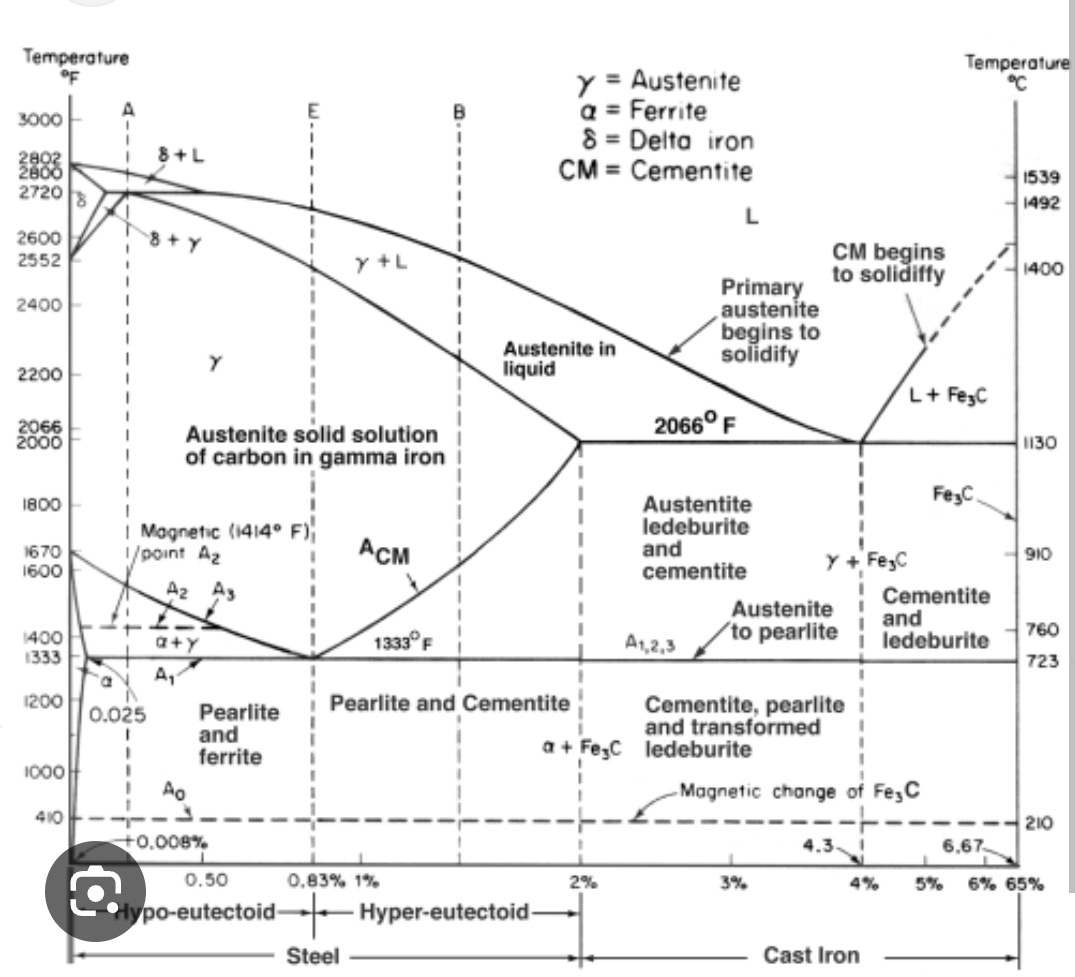
kitchenware ,fabrics are frequencies as well.
That's why they replaces coton & wool by viscose & polyester for mass populations .
& Inox & cast iron by TEFLON
Electeomagnetic warfare can be prevented ...
#FrequencyPhysics
#TwitterXOFF
#TeamPhysics

1
4
5
340
Feb 6
Soldiers in #Vietnam reported seeing strange things and entities during battle when they used "Starlight Scopes"made with dicyanin or Dyson dye which were discontinued afterward
#StringTheory
#TeamPhysics
1
2
214
10 Aug 2025
Let's honor these legends ...
#NikolaTesla & #MarkTwain
📸 of Mark Twain @ “Tesla’s Oscillator and Other Inventions".
Nikola Tesla # his Colorado Springs lab 📸 showing 1899. Tesla's “magnifying transmitter”
©️ The Century Magazine
#TeamPhysics


1
1
55

22 May 2024
“If all of mathematics disappeared, #Physics would be set back by exactly one week, and if nature were not worth knowing, life would not be the same. In order to keep your balance, you must keep moving.”- #AmazingNUSA
Good luck to our #TeamYear11 this morning! #TeamPhysics ⚡️🔋
1
5
1,107

25 Apr 2024
I have to admit the night before the SQA exam i thibk i feel almost as nervous as some of our learners. Then I remember how they have absolutely smashed it all year and are going to use today to show off their skills.
You’ve got this #TeamPhysics, lets do this 💪💪💪
9
289

20 Apr 2024
1
1
182

13 Mar 2024
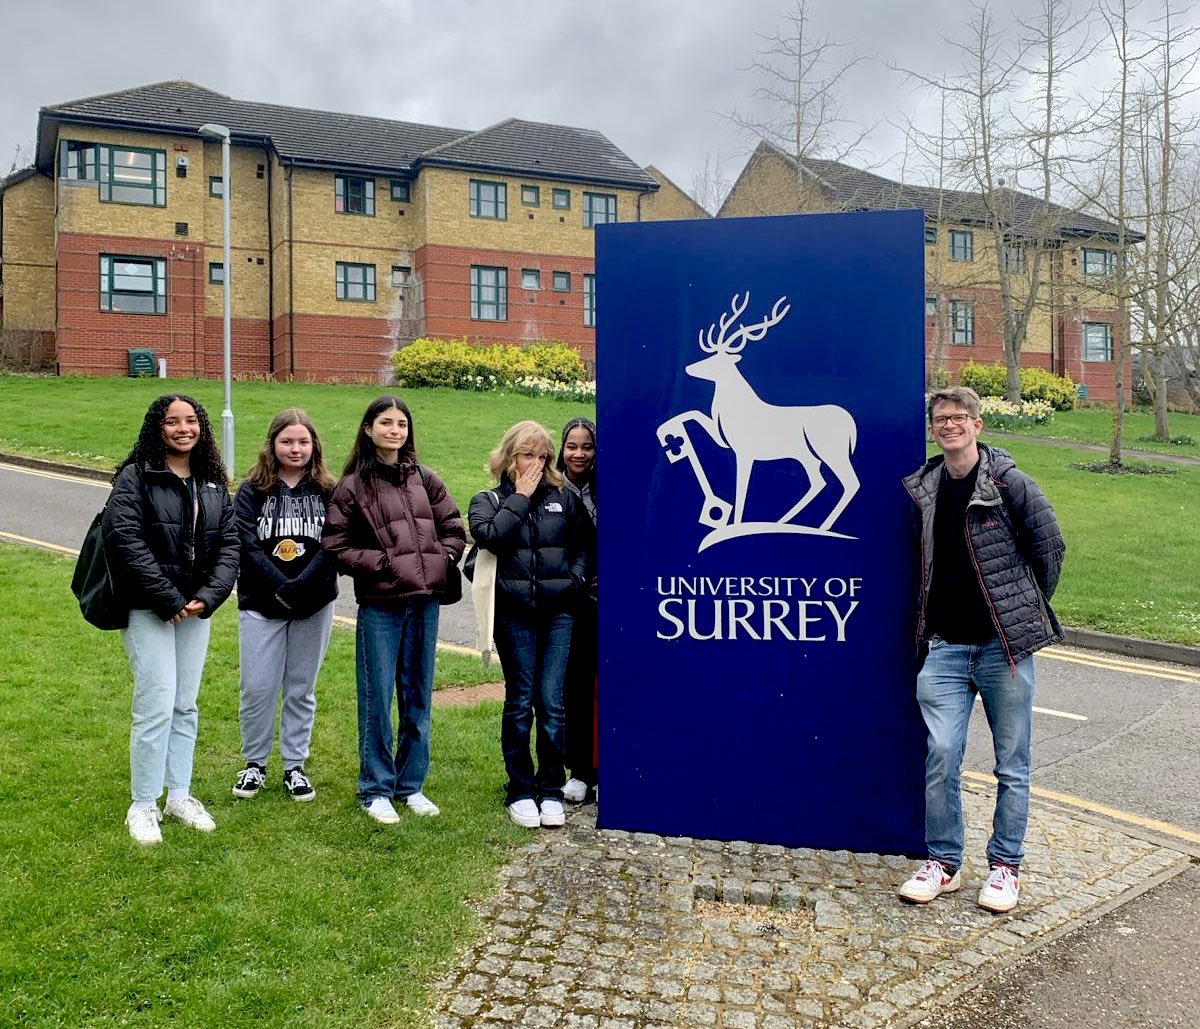
These very lucky Y11’s had a great day out at the @UniOfSurrey Physics Academy day including meeting Physics Royalty Jim Al-Khalili 👏💜💪 #TeamPhysics #OrielScience

4
721

11 Dec 2023
Happy to see this paper out by @uwradonc #TeamPhysics Dominic Maes, Evan Gates, Juergen Meyer, Stephen Bowen! Our dept did quant qual analysis of multiple auto-seg tools across dosi MD (@EmilyWegMD!), which we used to decide which product to integrate
authors.elsevier.com/c/1iDfO…


ALT Figure 3. Scatter plot of ROI volume versus DSCs for 527 patient-specific ROIs for AI1, AI2, and AI3. Artificial intelligence autocontouring solutions with (A) several select ROIs and (B) distribution of DSC across several select ROIs, which are represented by kernel density plots across all 3 artificial intelligence solution-generated contours. Abbreviations: DSC = dice similarity coefficient; ROI = region of interest.

1
3
12
869

15 Nov 2023
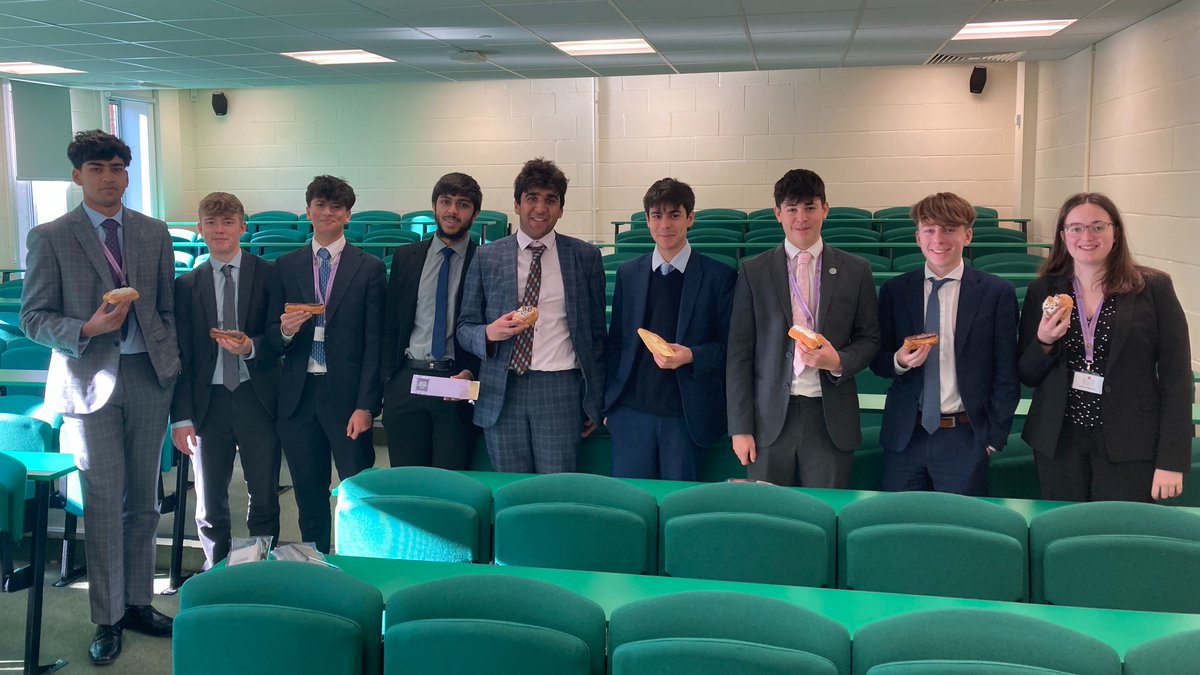
Our @LGS_Senior @TheBPhO Olympians enjoying a well-deserved refuel after nearly 3 hours of Physics fun! A great effort from our Upper Sixth Physicists! #TeamPhysics #NoRippleTanks
2
1,303

7 Nov 2023
Esse dia foi foda. Joguei com o joelho todo fodido. Sdds TeamPhysics.
2
221
7 Sep 2023
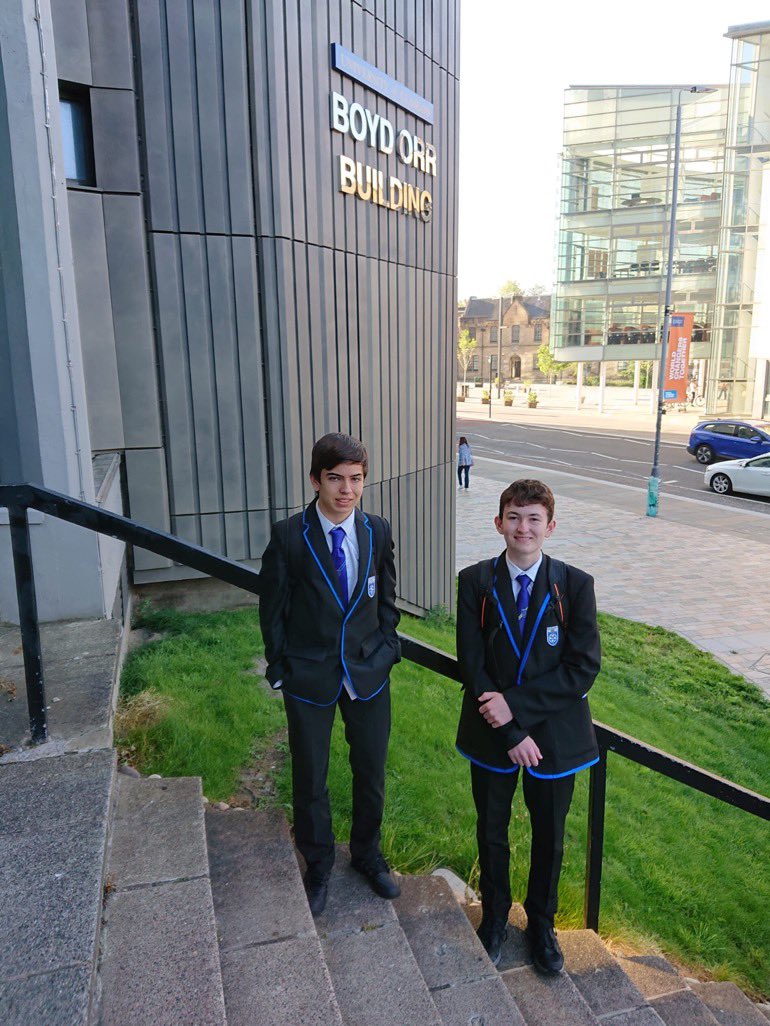
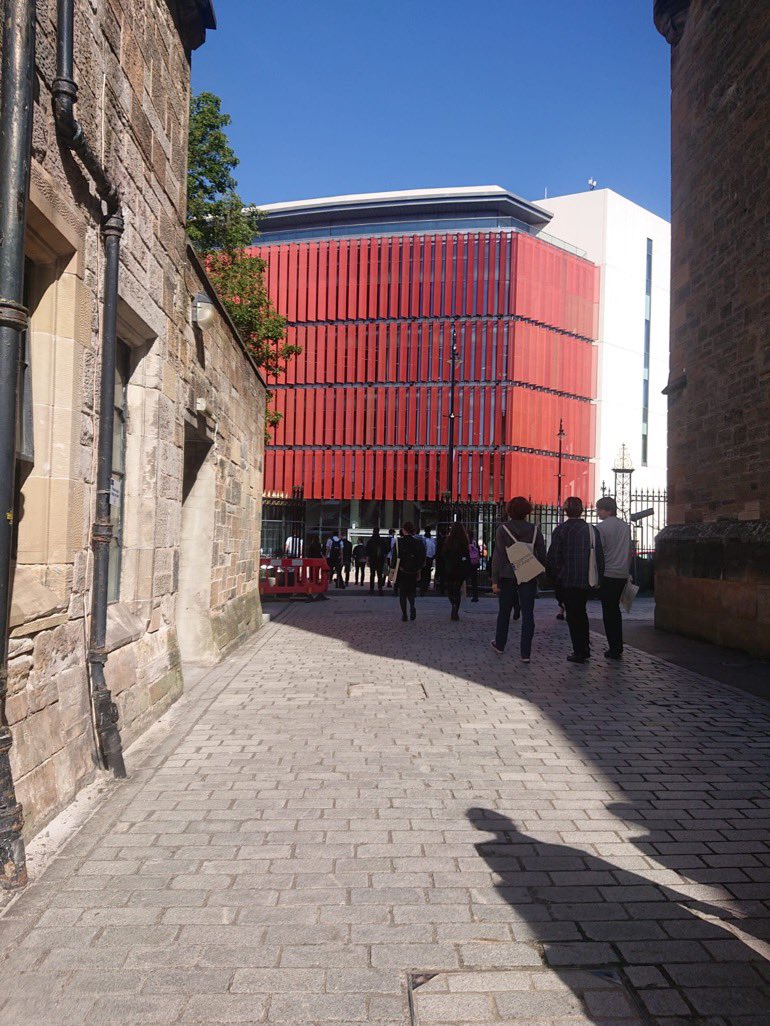
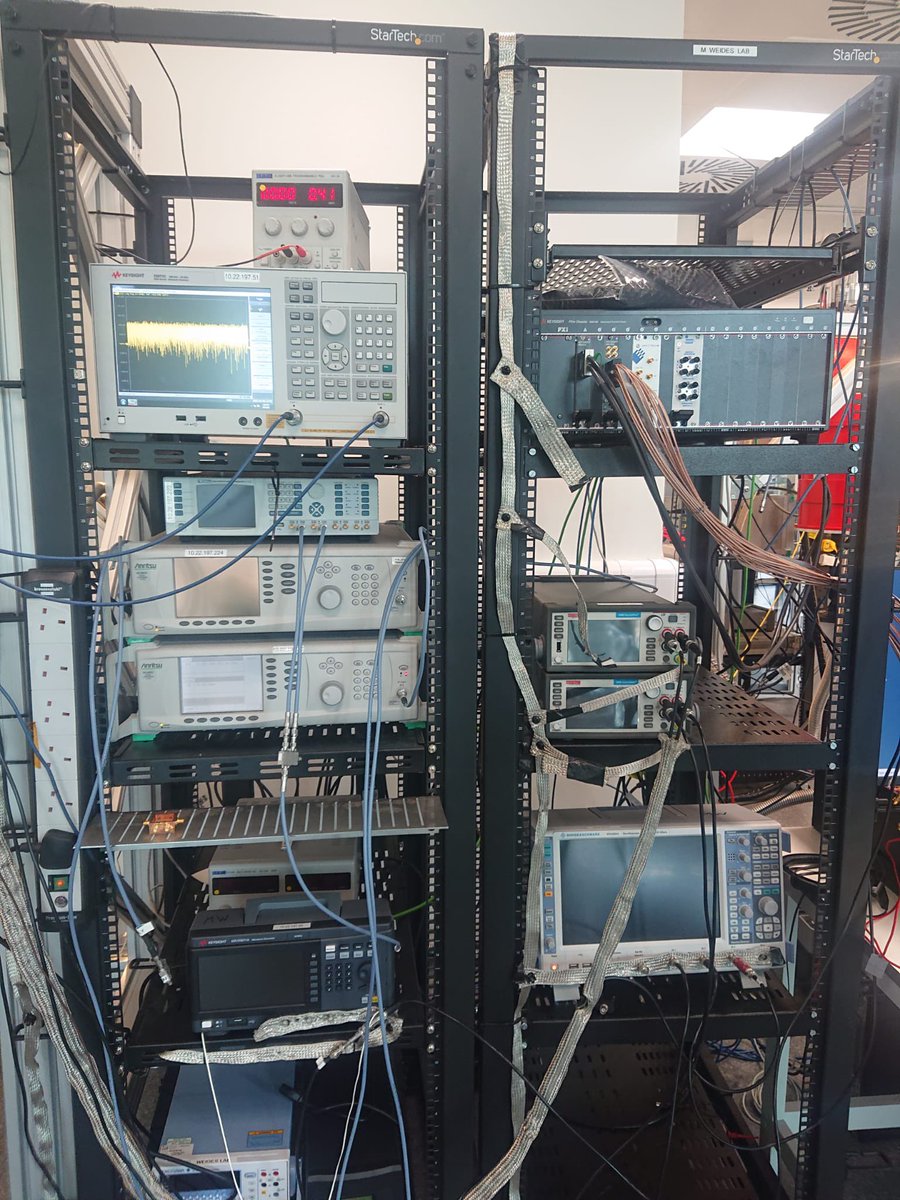
Great to have #TeamPhysics represented @UofGPhysAstro Quantum Technology School. Fraser and Hamish were far too busy for pictures. Well done! We cant wait to hear all about it! @CarlukeHS_Sci @CarlukeHS
4
11
1,149

6 Sep 2023
Great to see our new collaboration space for science being used this morning by our physics team! #RHSHappy #partofRHS #TeamPhysics
6 Sep 2023

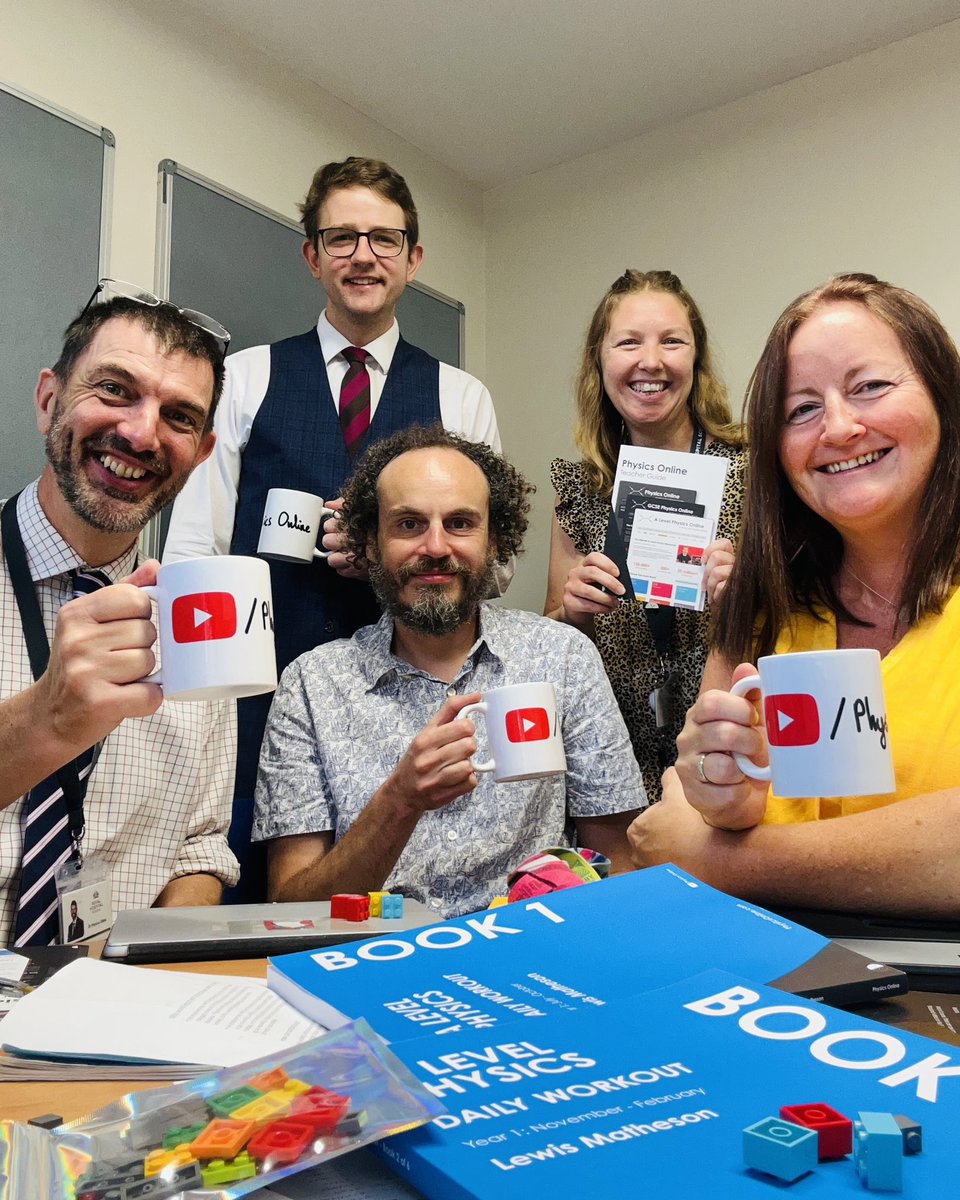
#TeamPhysics starting strong 💪🏻 Thanks for the fantastic resources @legophysicsguy 🤩 We are all very pleased with our teacher guides and coffee mugs 🙌🏻 #WeTeachPhysics #PhysicsTeachers @ChatPhysics
13
367

6 Sep 2023
#TeamPhysics starting strong 💪🏻 Thanks for the fantastic resources @legophysicsguy 🤩 We are all very pleased with our teacher guides and coffee mugs 🙌🏻 #WeTeachPhysics #PhysicsTeachers @ChatPhysics
10
1,989

8 May 2023
8 May 2023

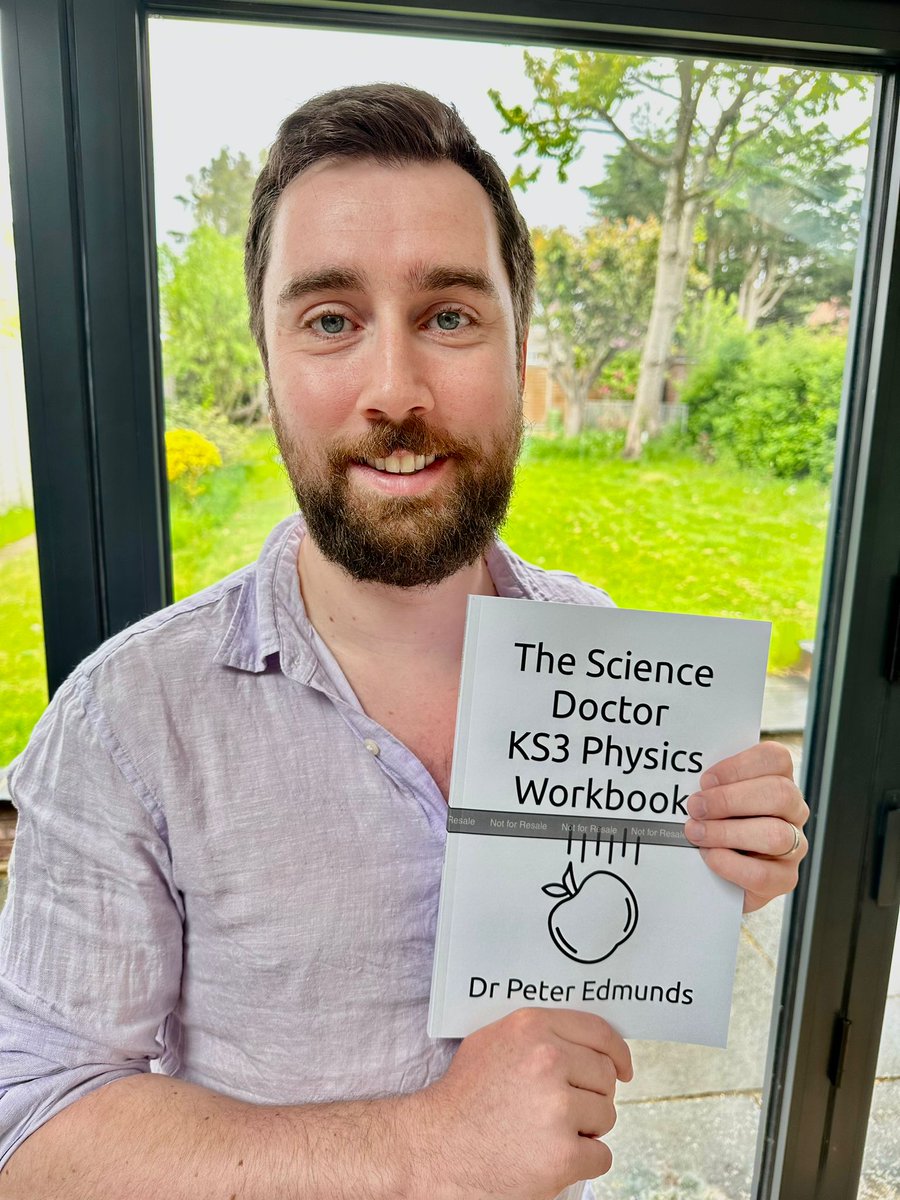
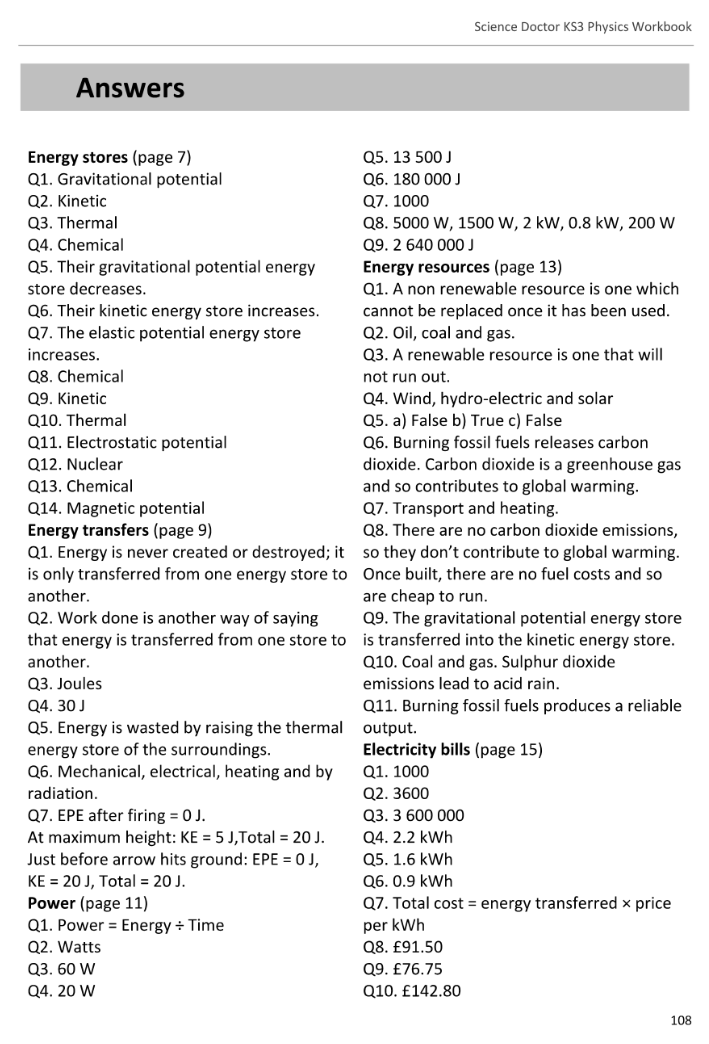
***KS3 PHYSICS BOOK***
My KS3 book is now a physical thing and live on Amazon.
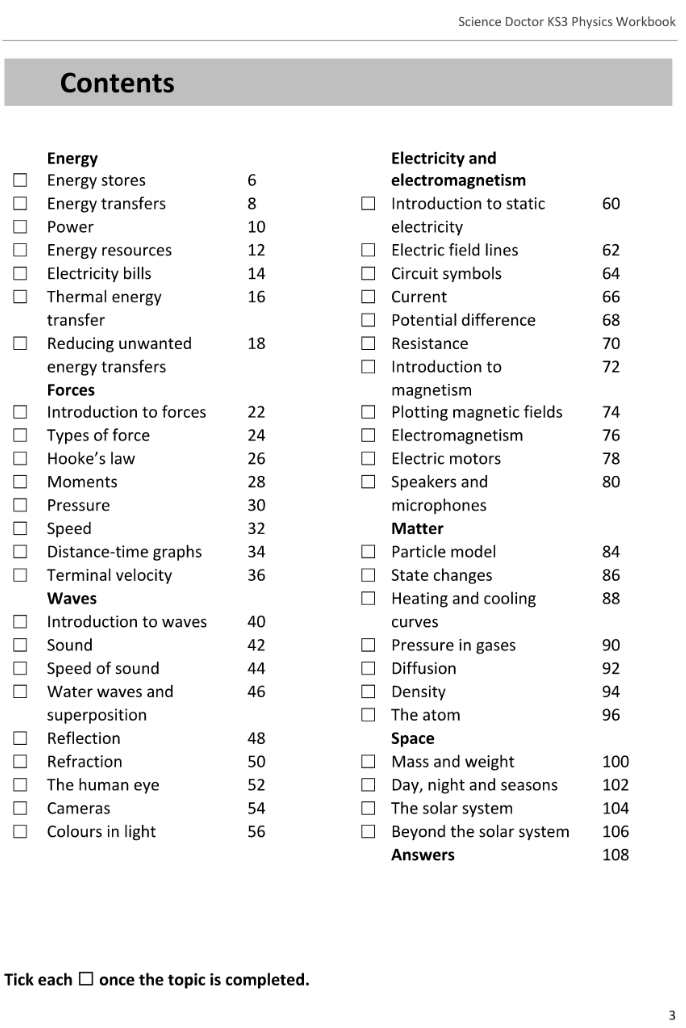
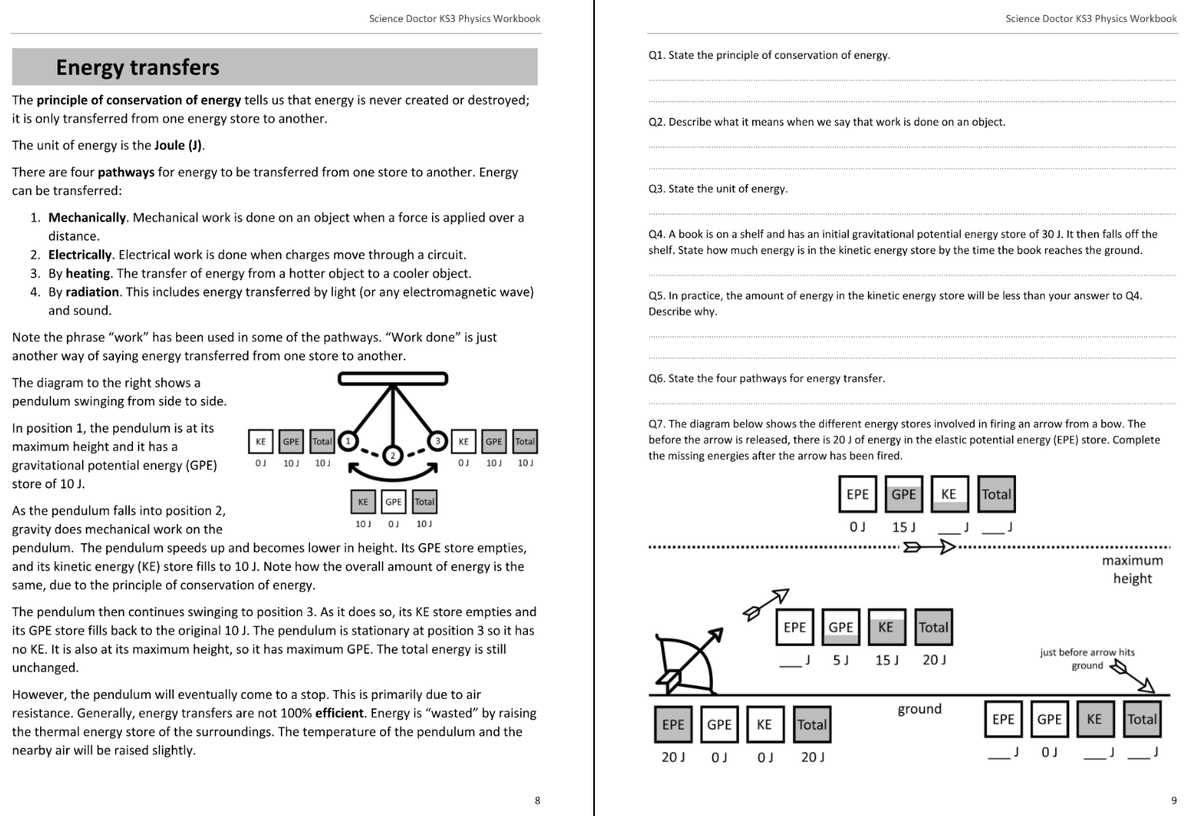
With coverage of the KS3 national curriculum, each topic has a page of core notes and a page of questions on those notes.
It now also has complete *answers* at the back.
amazon.co.uk/dp/B0C47NWRPV/r…
1
1
3
1,470

18 Apr 2023
Y también a tres de mis físicos (as) favoritas: @ferminacevesd @SolmarVarela y @chayito09 .
Ok. Chayito no es física estrictamente pero es miembro honorario del #TeamPhysics por su gusto en estos temas.
FIN
5
20
2,223

29 Mar 2023
Well, that's a new challenge passed. CPAC Inspection and being the person in charge. I know we all do a great job, but the stress when it's your responsibility remains. Thanks Team 😊
#TeamPhysics
2
3
267
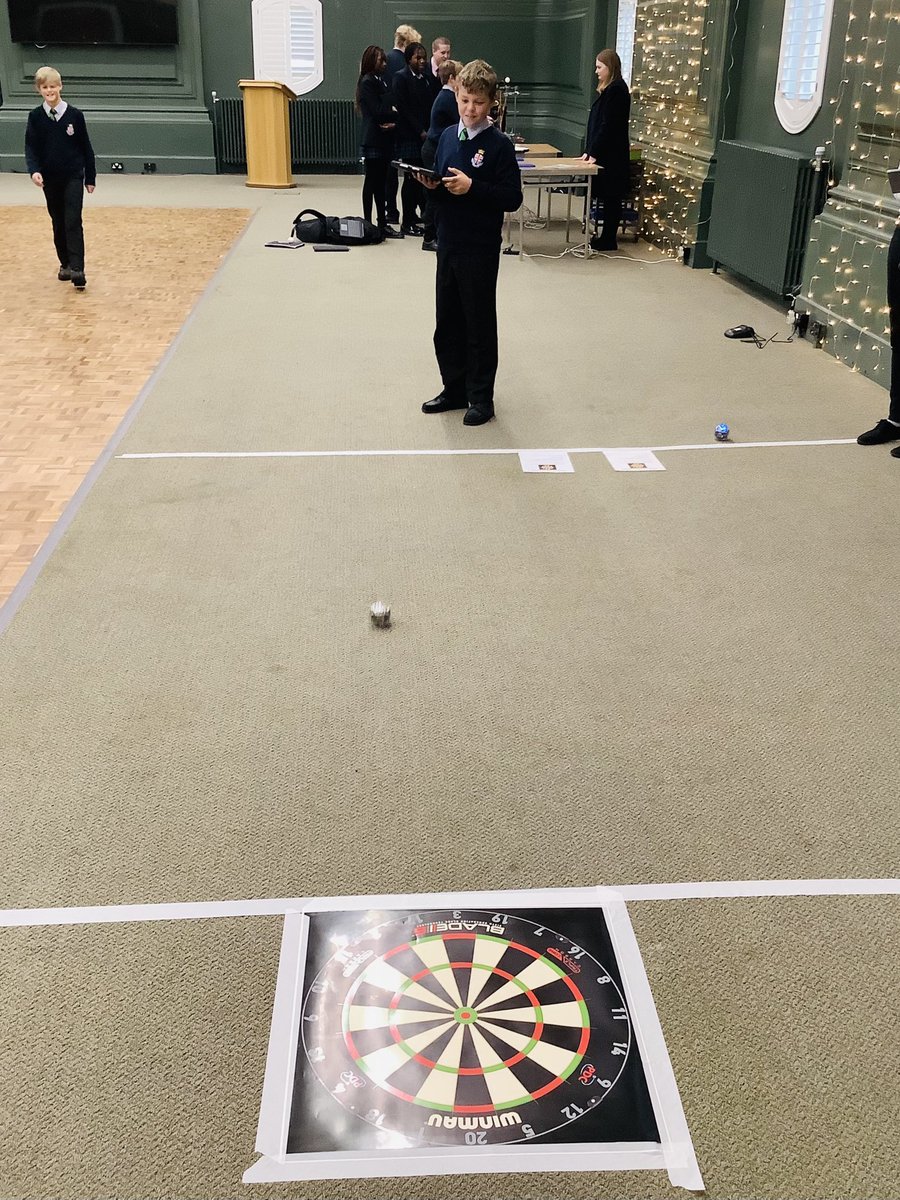
17 Mar 2023
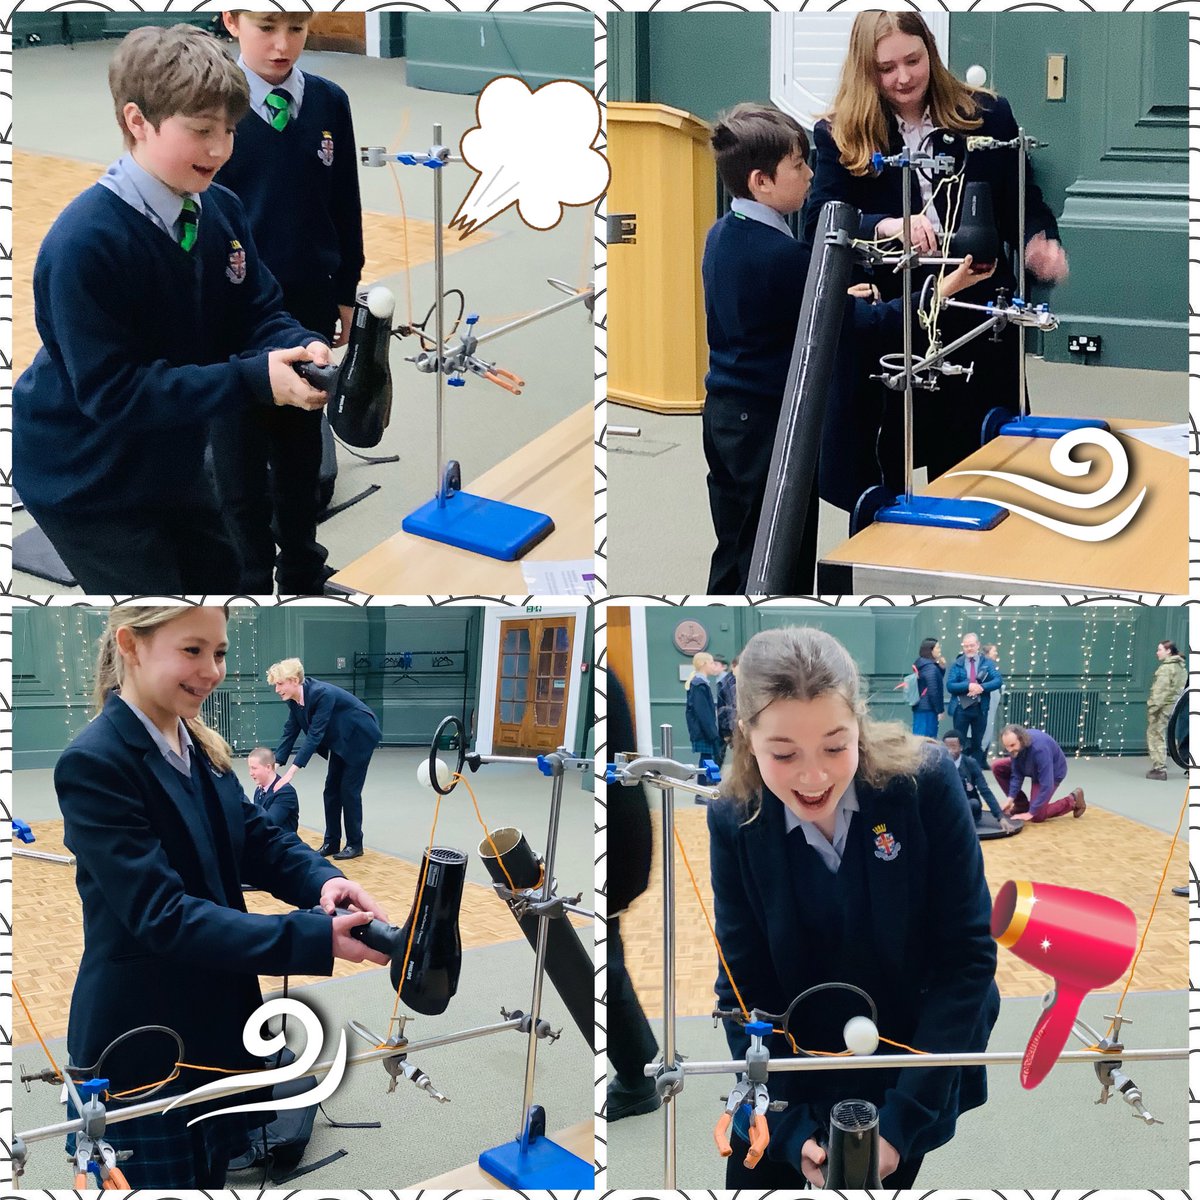
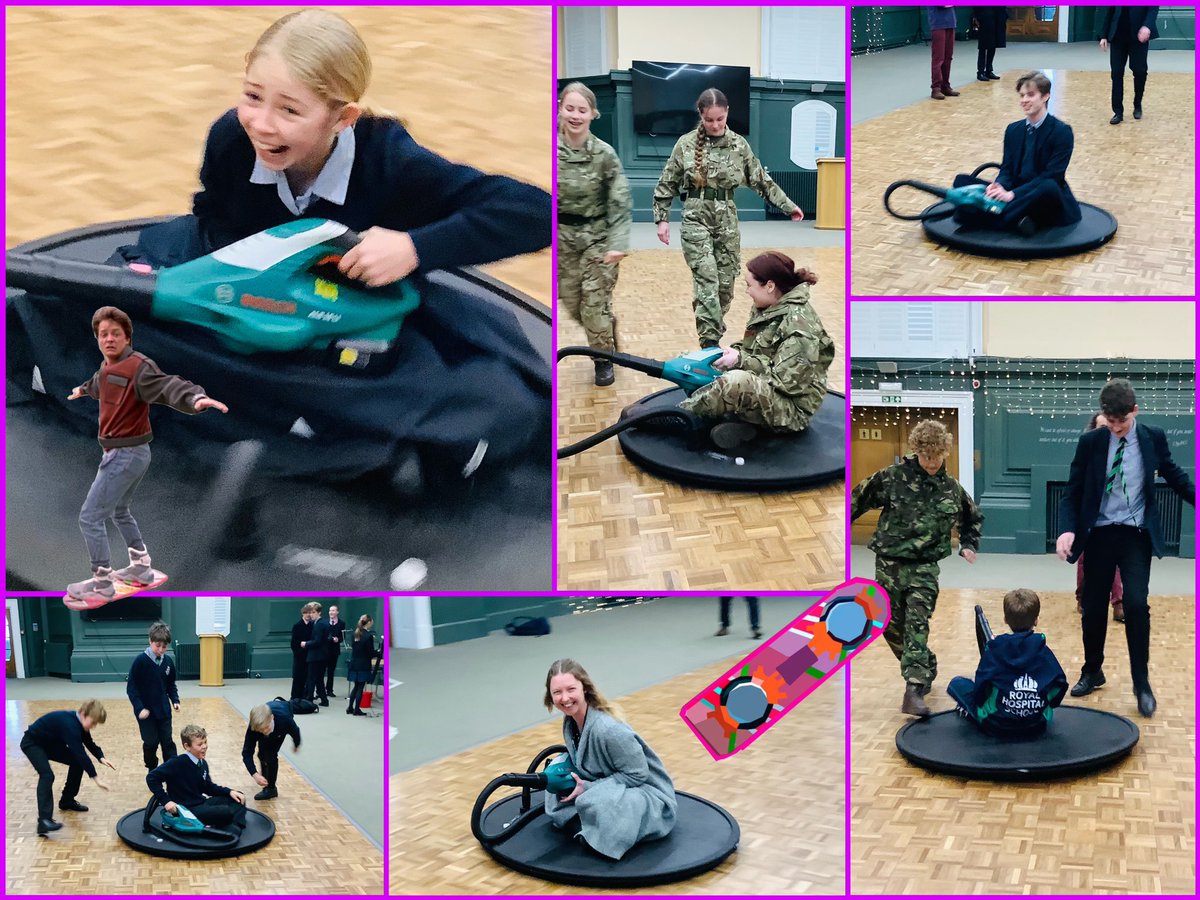
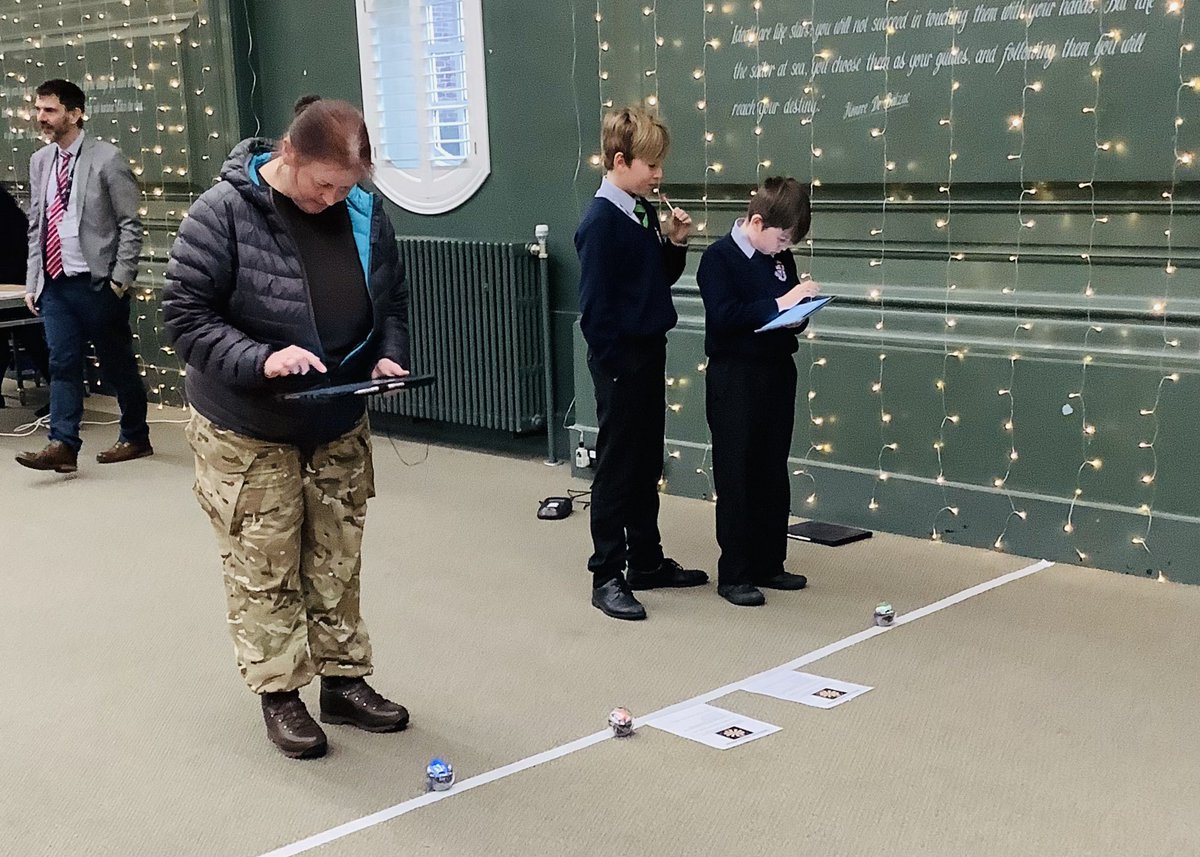
#TeamPhysics @RHSSuffolk treated the pupils to a lunchtime of ‘levitation races’, @Sphero darts and hoverboard fun! We 💙 @ScienceWeekUK 💨 🤖 #BSW23 #physics #connections #codinglife #PartofRHS @STEM_RHS
3
9
598