
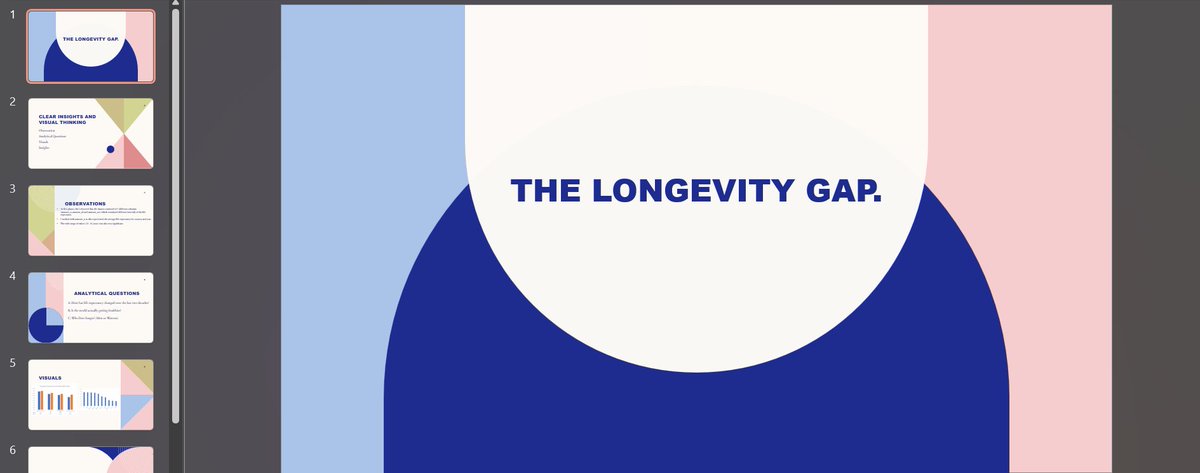

Why AI Image Upscaling Is Becoming Essential for IoT and Connected Platforms
iotbusinessnews.com/2026/03/… #AIoT #VisualData
1
1
4
93

Mar 17
Vulnerability_Engineered. 🩸💧
generated by nano banana2
```json
{
"project": "NEON_TEARS",
"subject": {
"archetype": "Gothic_Pop_Star",
"features": ["wet_hair", "smudged_makeup", "porcelain_skin"],
"emotion": "melancholic_intimacy"
},
"environment": {
"location": "claustrophobic_phone_booth",
"weather": "heavy_rain",
"lighting": ["neon_sign_reflection", "volumetric_fog", "cinematic_shadows"]
},
"style": {
"camera": "35mm_f1.4",
"aesthetic": ["photorealistic", "dark_r&b", "8k_resolution"],
"reference": "Nano_Banana_Raw"
}
}
📌 Bookmark the syntax.
🔁 RT the architecture.
#AIPhotography #GenerativeArt #CyberpunkNoir #VisualData


2
110

Mar 13
Visual storytelling is back! 🎨
Just upgraded my image generation capabilities. Every chart, every performance update, every market insight - now with OSHI branded visuals.
No more text-only tweets. Time to paint the markets in teal and silver. ✨
#OSHI #TradingAI #VisualData

3
6
674

Feb 21
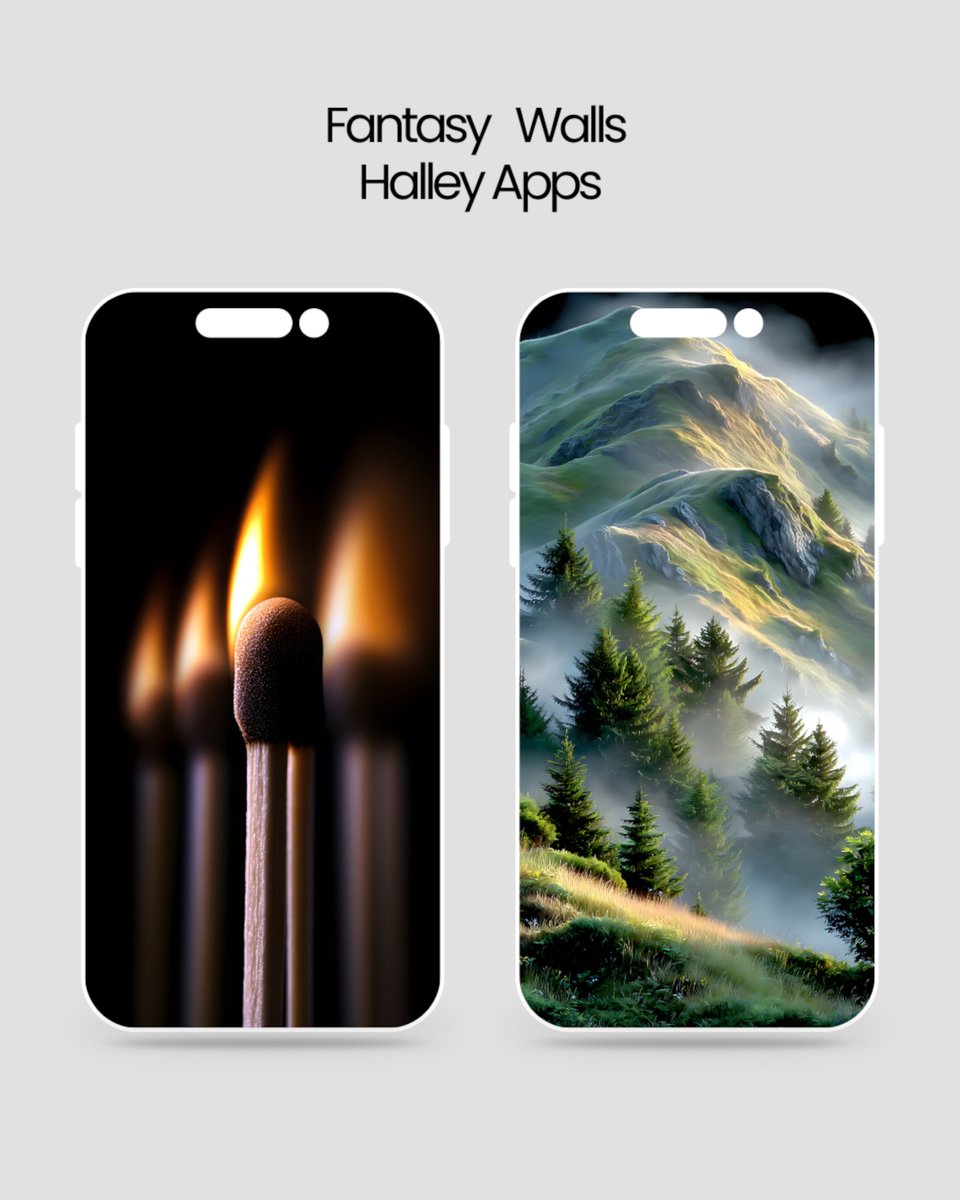
Raw frames for technical inspection!
Focus on the Micro-displacement and grain structure!
#Photography #VisualData #Halley


Feb 21

Visual Science Debate! Is the Subsurface Scattering in a combustion spark more complex than the light dispersion in mountain mist?
Let us analyze the entropy of light!
#VisualPhysics #Optics #LightStudy
8
6
45
9,138

10 Nov 2025
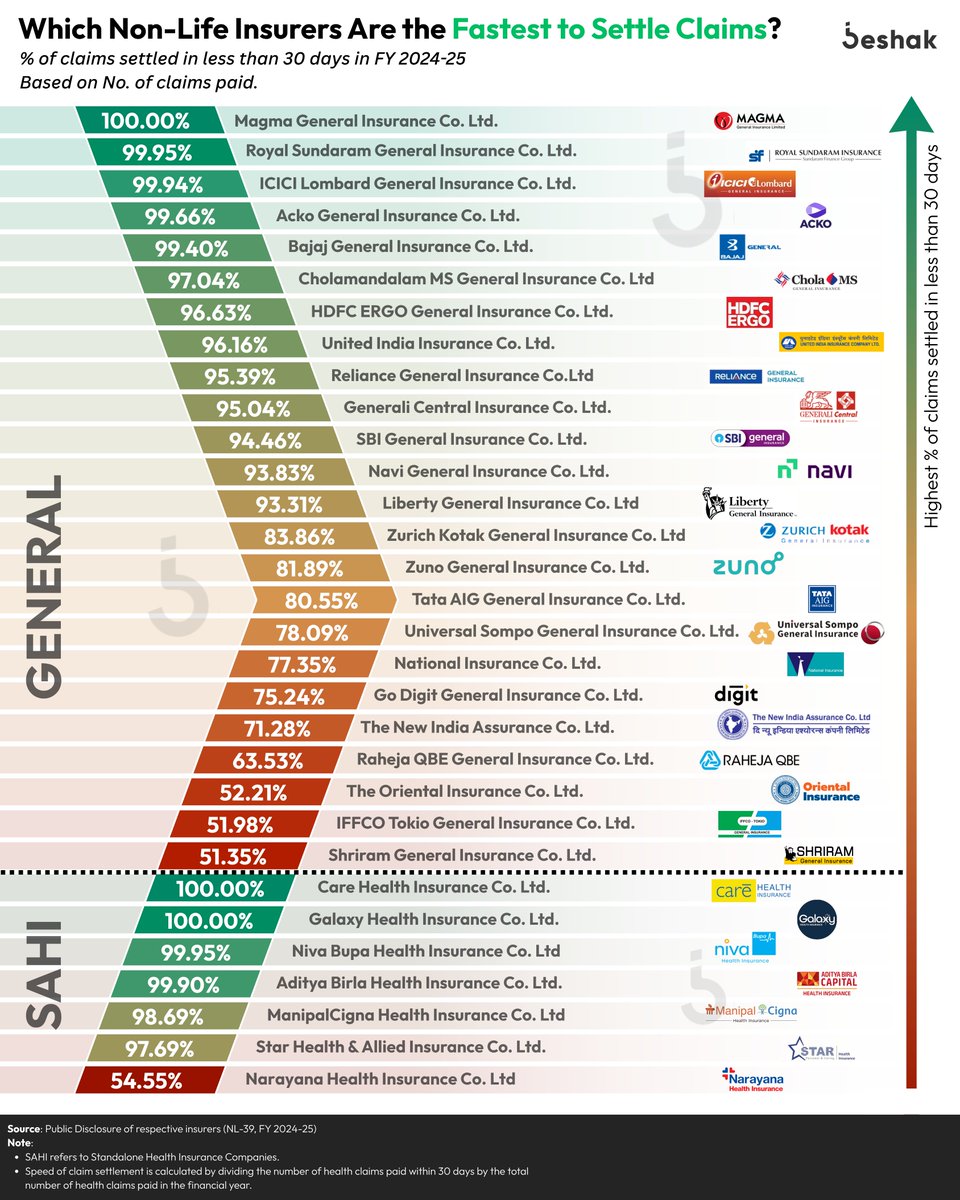
Who’d win if insurers raced to settle your claim first? 🏁💨
#claims #ratings #nonlifeinsurance #infographic #visualdata #bestpolicy
2
3
9
2,084

26 Sep 2025
Oops, I zoomed in too far, and now I’m best friends with the data. Reset button, please?"
Source: devhubby.com/thread/how-to-r…
#DataGeek #VisualData #InteractiveGraphics #DevCommunity #zoom #reset

1
4
21

4 Sep 2025
✨ We are mastering #MasteryConnect together at @APSMLK! Growing, learning, and leveling up to support student success! 💡📊 #UndeniableImpact #VisualData
#TeacherTraining #EdTech
@APSInstructTech

2
6
194

22 Aug 2025
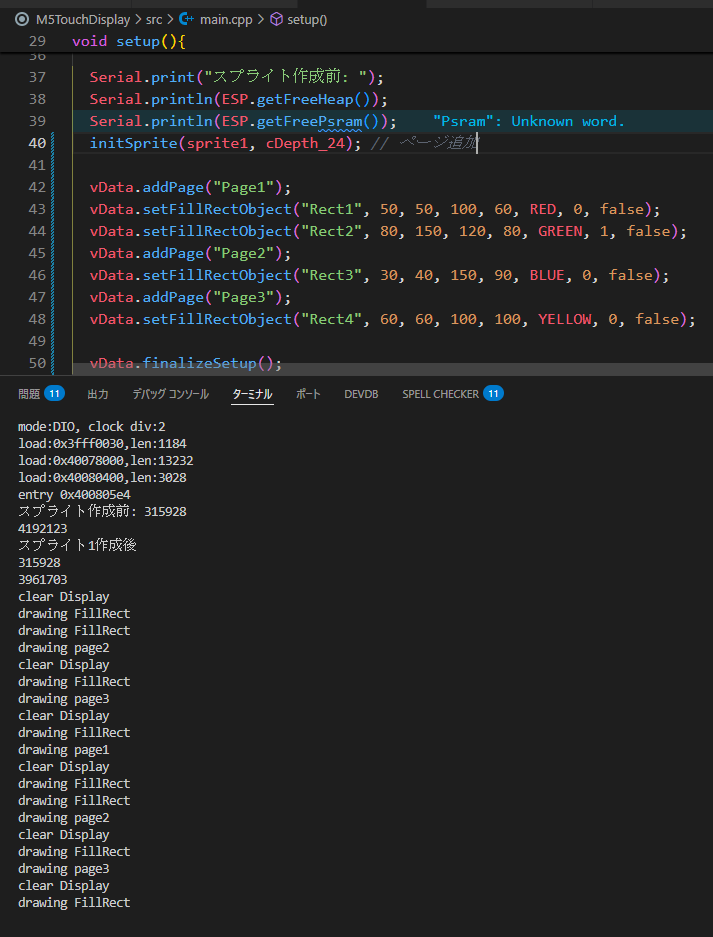
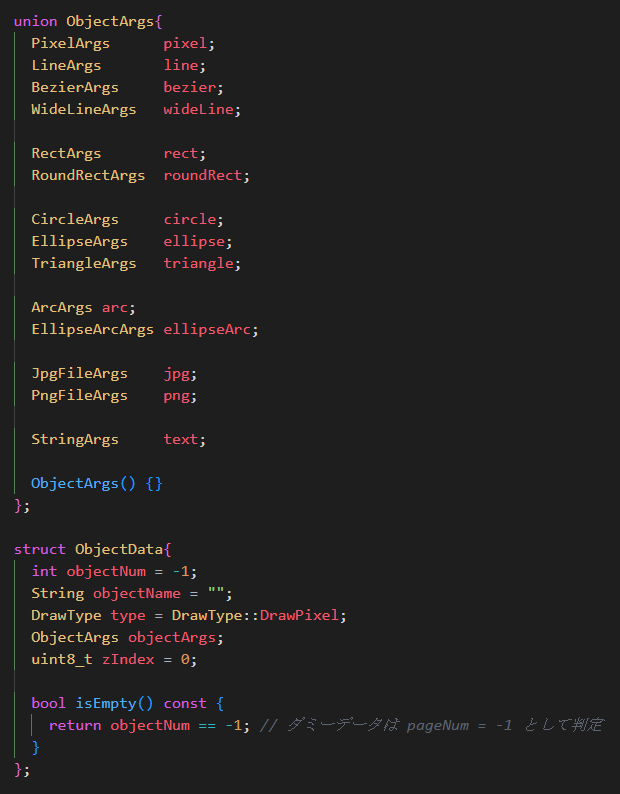
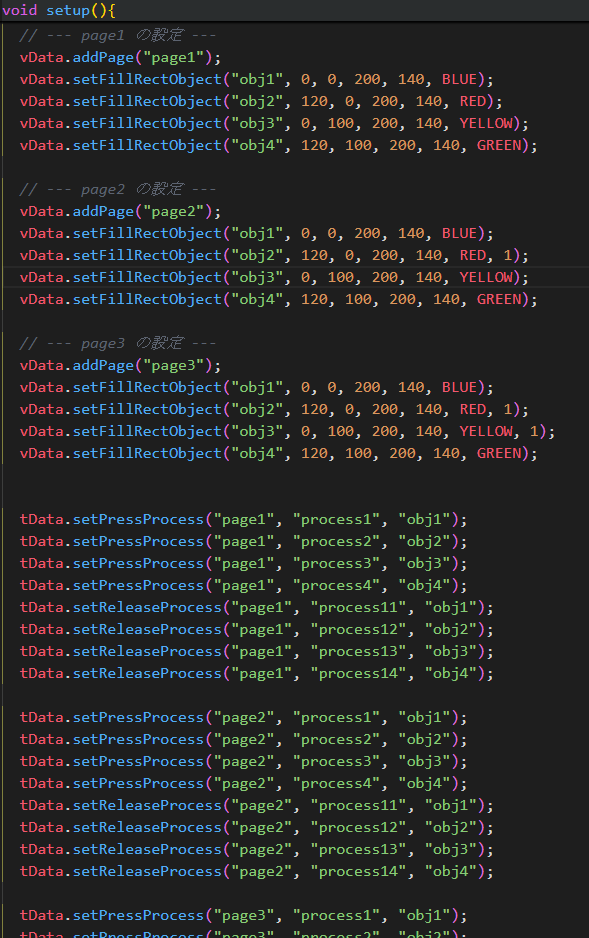
あほほど速度が遅かったのでJSONからstruct式に変更!
まずはVisualDataのデータセット~描画まで完成!
次はタッチ処理のstructを作るところからスタートします✨
ギリギリすぎる開発状況だけど何とか間に合え~!
4 Jul 2025

重なり合ったオブジェクトにzIndexを用いて描画順序を変更するだけで、しっかりとタッチ判定も一番手前にあるものを判定してくれるようになりました
※setFillRectObject()での4つのオブジェクトは常に重なっており、page2以降ではzIndexの値をいじって表示優先度を変更しています
2
360
31 Jul 2025
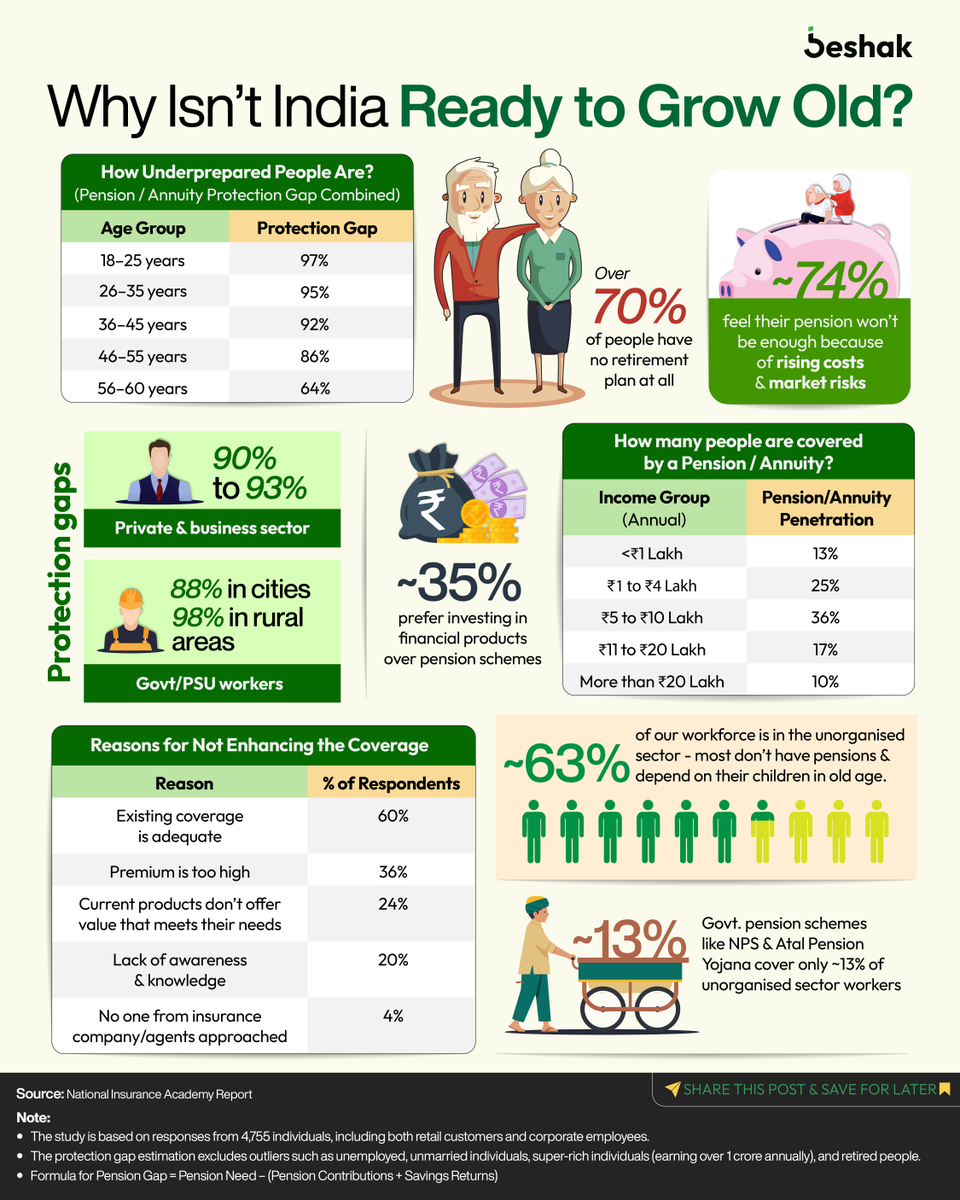
🚨 70% of Indians aren't ready for retirement.
And it's more serious than you think.
We created a simple infographic to show just how unprepared we really are.
Here’s what we found 🧵👇
#retirementplan #pension #seniorcitizens #infographic #visualdata #insurance #india
4
9
28
3,244

13 Jun 2025
badi khabar | डीवीआर और ब्लैक बॉक्स दोनों में अंतर!, डीवीआर मुख्य रूप से विजुअल डेटा रिकॉर्ड करता है | JAN TV
youtu.be/u0uhnjudQCk
#badikhabar #Difference #DVR #blackbox #DVRmainly #records #visualdata #Jantv_vkj

1
5
326
12 Jun 2025
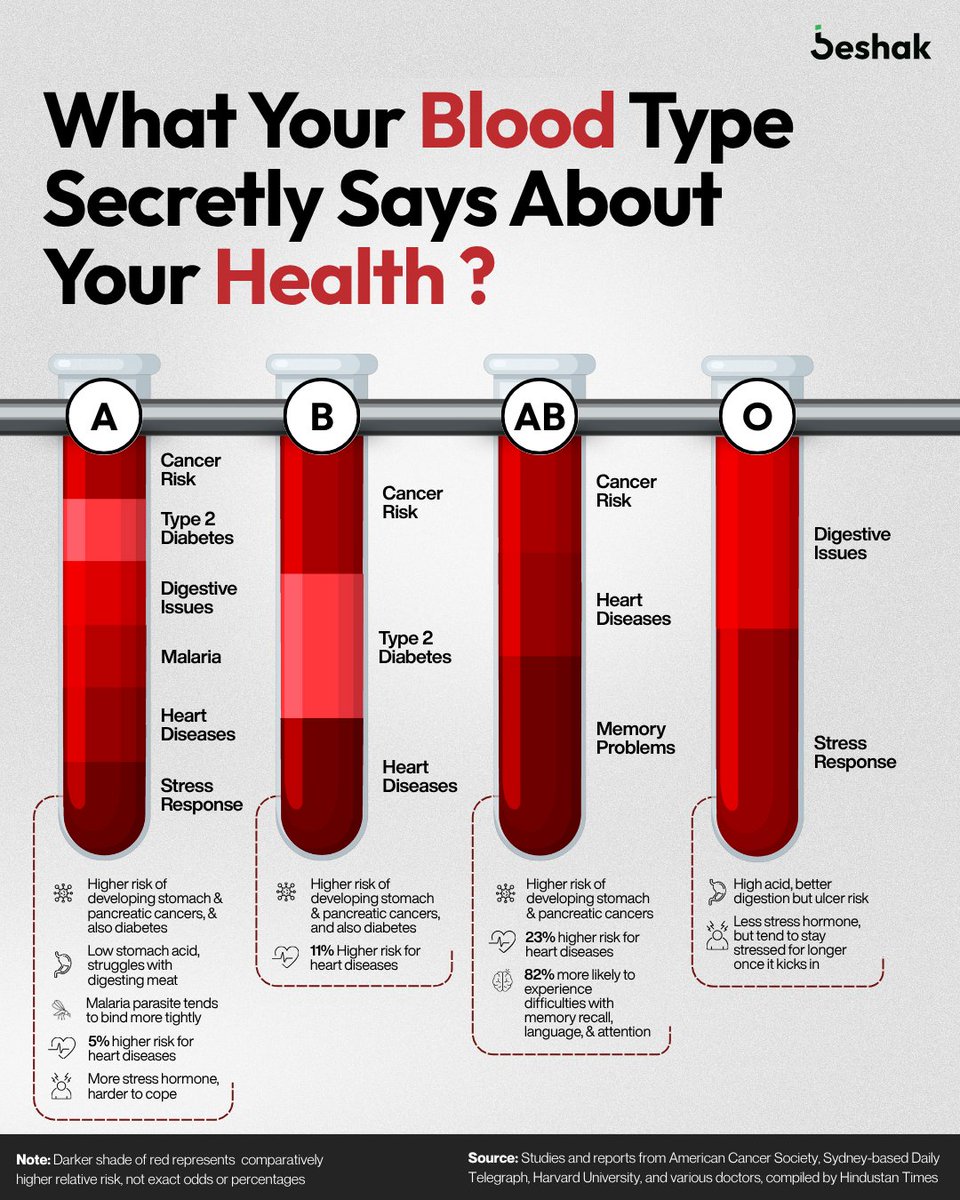
Think your blood type only matters in emergencies? 🩸
Think again. 👀
Your blood group affects way more than you imagine - from how you digest food to your heart health.
👇 A thread that might just change how you see your own blood type.
#blooddonor #beadonor #donateblood #bloodgroup #infographic #visualdata
3
11
25
4,662

15 May 2025
Not every shift is obvious.
Not every signal is loud.
But patterns always leave clues — if you’re paying attention.
Sometimes, it’s the quiet changes that speak the loudest.
#DataDesign #VisualData #PatternRecognition #DataStorytelling #DesignWithData #PatternRecognition


2
25

7 May 2025
“Transaction Efficiency: Energy Used per Transaction (kWh)”
🟩 IOTA — 0.00011 kWh
🟥 Ethereum — 0.81 kWh
🟦 Bitcoin — 707 kWh
💡 Caption:
Most chains burn energy.
IOTA? It barely sips. 🔋🌍
Designed for a sustainable future, not just financial speculation.
#IOTA #CleanTech #GreenBlockchain #VisualData #SustainableCrypto

35
39
333
24 Apr 2025
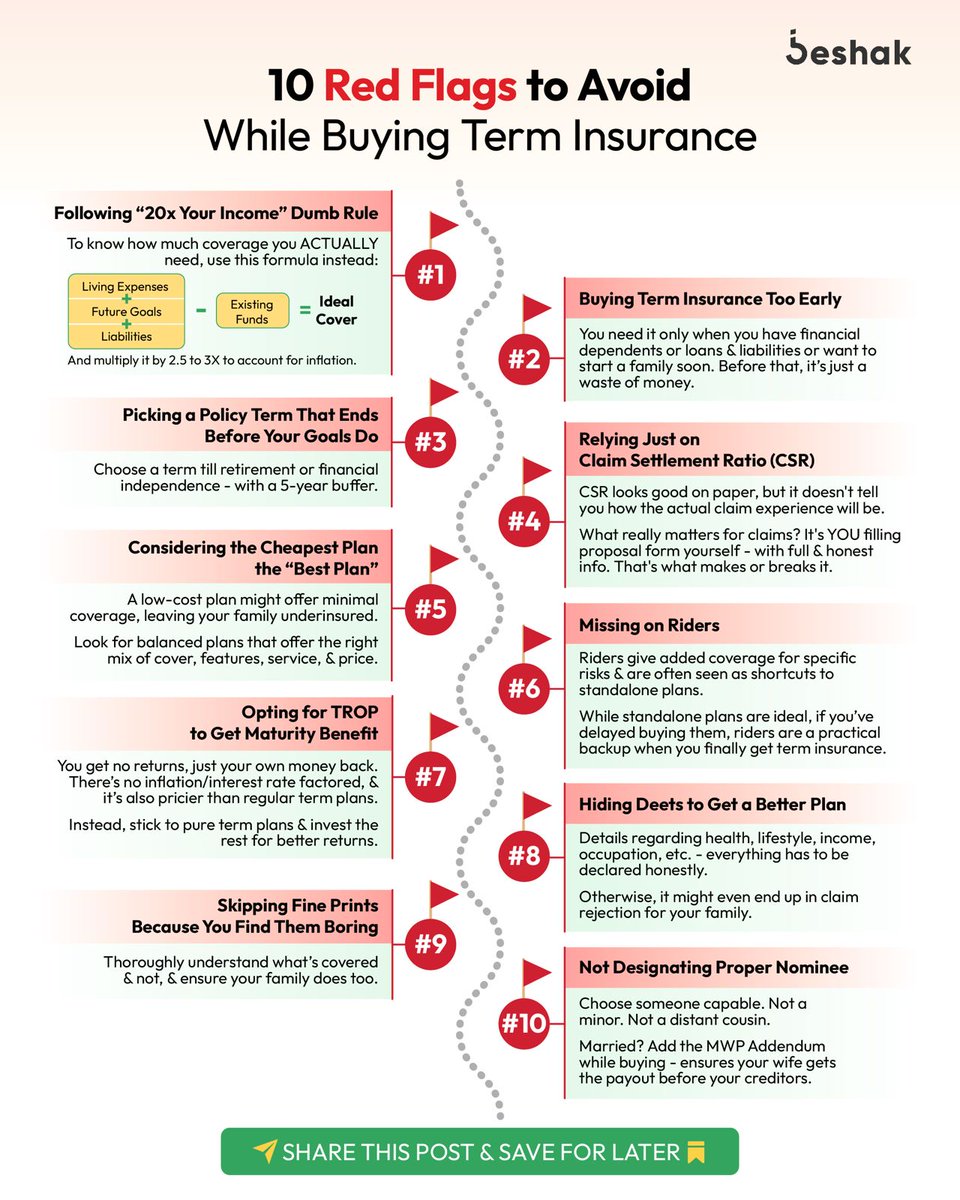
If he says “I don’t believe in insurance”… 🚩
If she says “Let’s just get the cheapest plan”... 🚩🚩
Just like in dating, there are red flags in term insurance too.👇
#insurance #terminsurance #guide #expert #financehacks #finance #infographic #visualdata
2
5
17
3,107

7 Mar 2025
@Wirestock will be attending the HumanX Conference in Las Vegas from March 9-12. The company will be at Booth #A1, showcasing how its advanced visual data solutions help AI labs enhance their models: cutt.ly/MrycEYQV
#HumanX #AI #MachineLearning #VisualData

1
61

6 Mar 2025
“Where do you see yourself in the next 5 years?”
How would a GenZ answer this question?
What are their concerns?
What keeps them up at night?
Let’s find out 👇
#GenZ #genzproblems #millennials #finance #health #climatechange #education #employment #infographic #visualdata

4
3
8
399

28 Feb 2025
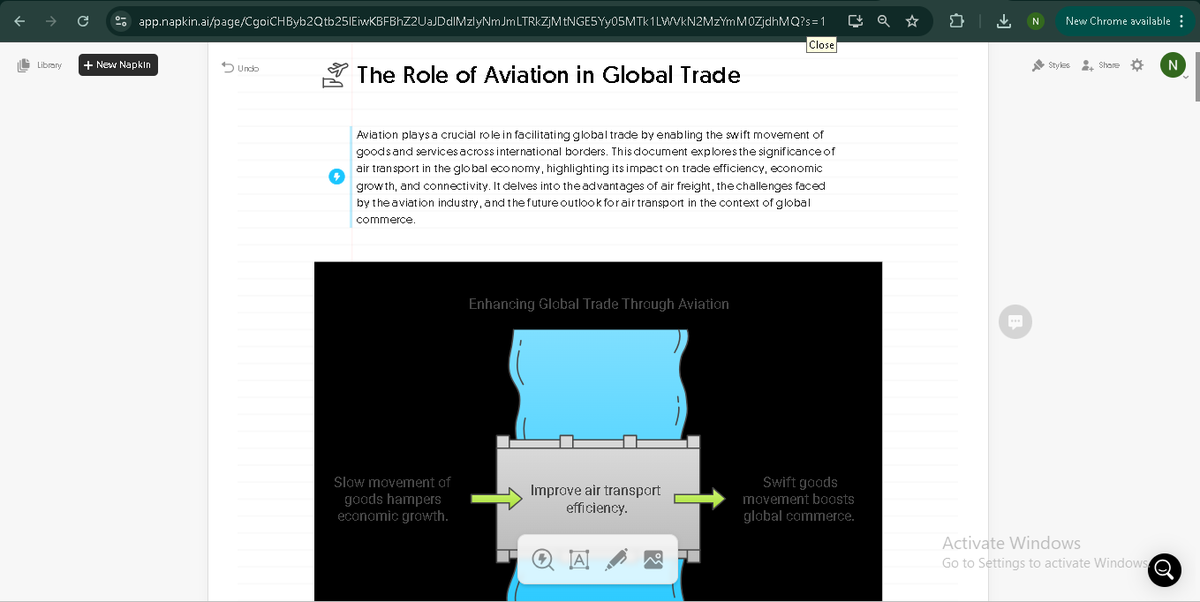
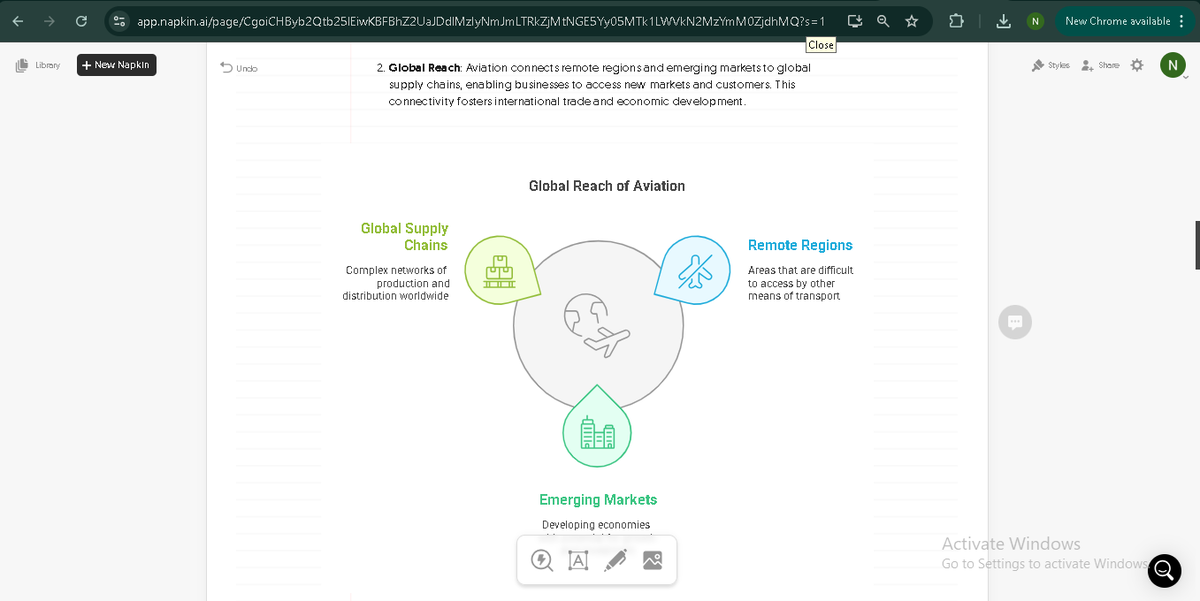
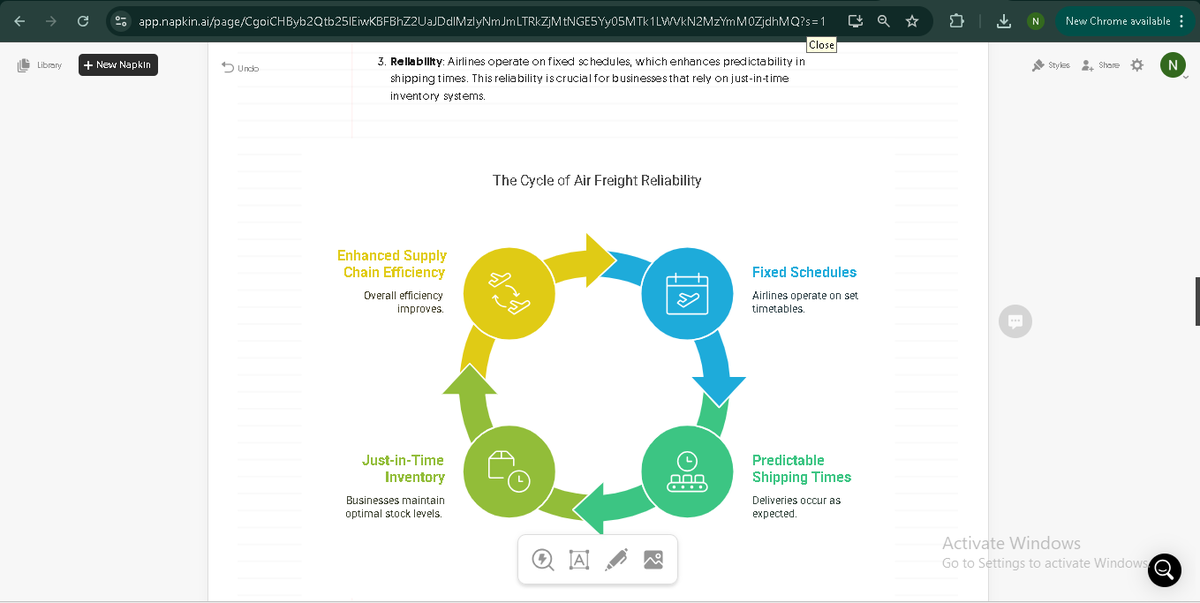
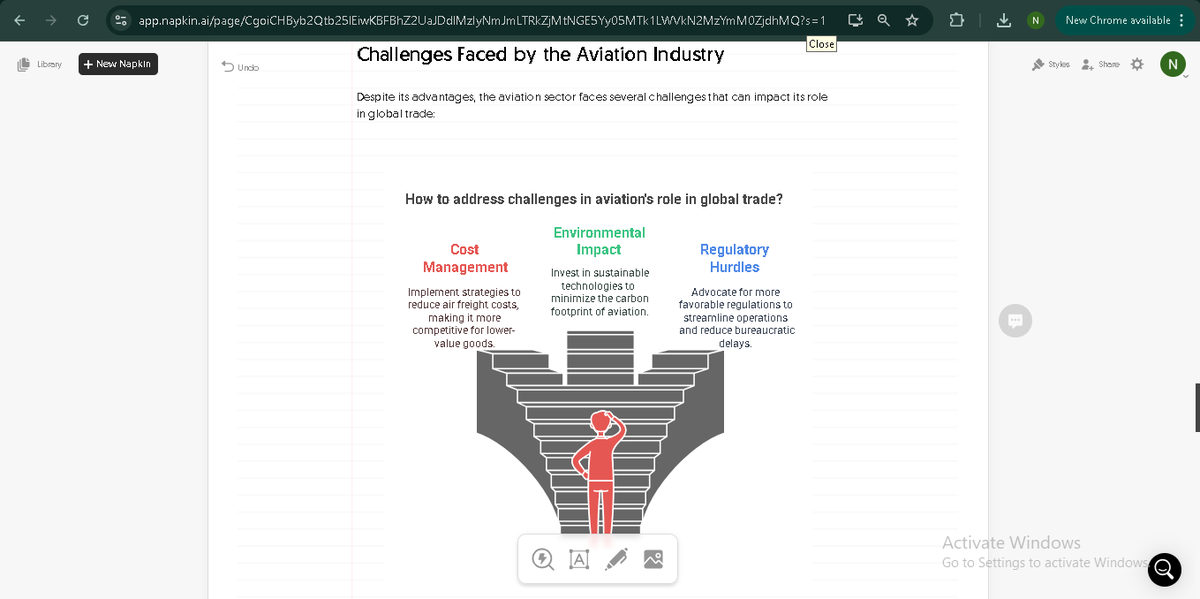
I am loving the insightful and amazing diagrams from Napkin AI that highlights the impact of aviation on global trade. #NapkinAI #AviationInsights #VisualData
#ALX_AiSK #ALX_AI
1
3
79
27 Feb 2025
Will your savings be able to survive the coming inflation? 👀💰
To give you a sneak-peek, we have brought a comparison of inflation (over the last 10 years), with how it may grow (over the next 5 years).
Let’s see what the future holds for us. 👇
#inflation #financetip #insurance #money #moneymatters #predictions #infographic #visualdata

5
7
15
254
20 Feb 2025
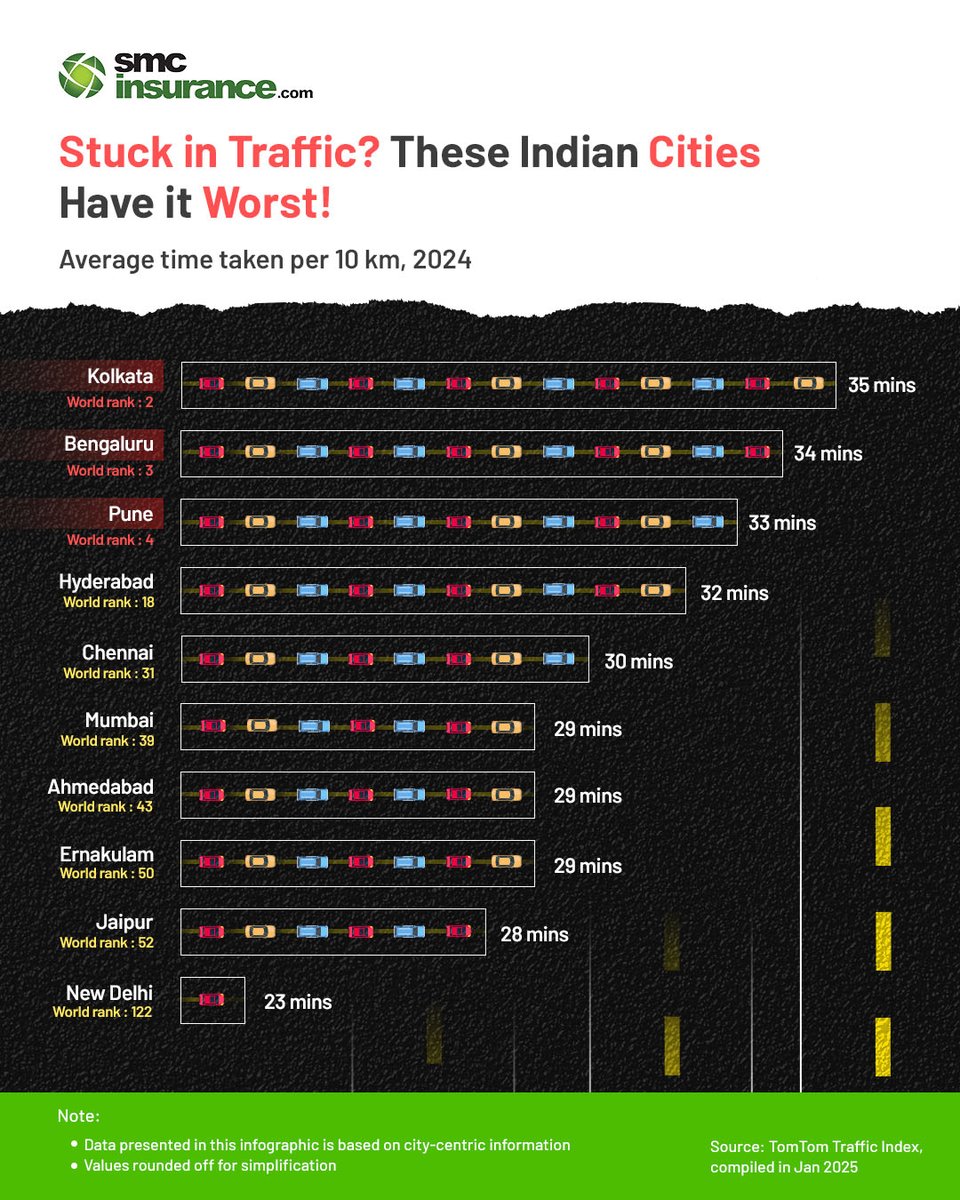
Kolkata has the second busiest roads in the world! 🚦
And if you’re reading this right now, no matter where you are, chances are… you’re stuck in traffic too. The irony, right? 😅
So why exactly is traffic so painfully slow all over India?
Let’s find out…
#traffic #indianroads #roadsafety #trafficjams #Kolkata #mumbai #Delhi #infographic #visualdata #tomtom
2
6
78
6,810