
Python library for hive plot visualizations of networks.
Joined September 2022
- Tweets 50
- Following 19
- Followers 29
- Likes 16
26 Photos and videos


Pinned Tweet

Apr 11
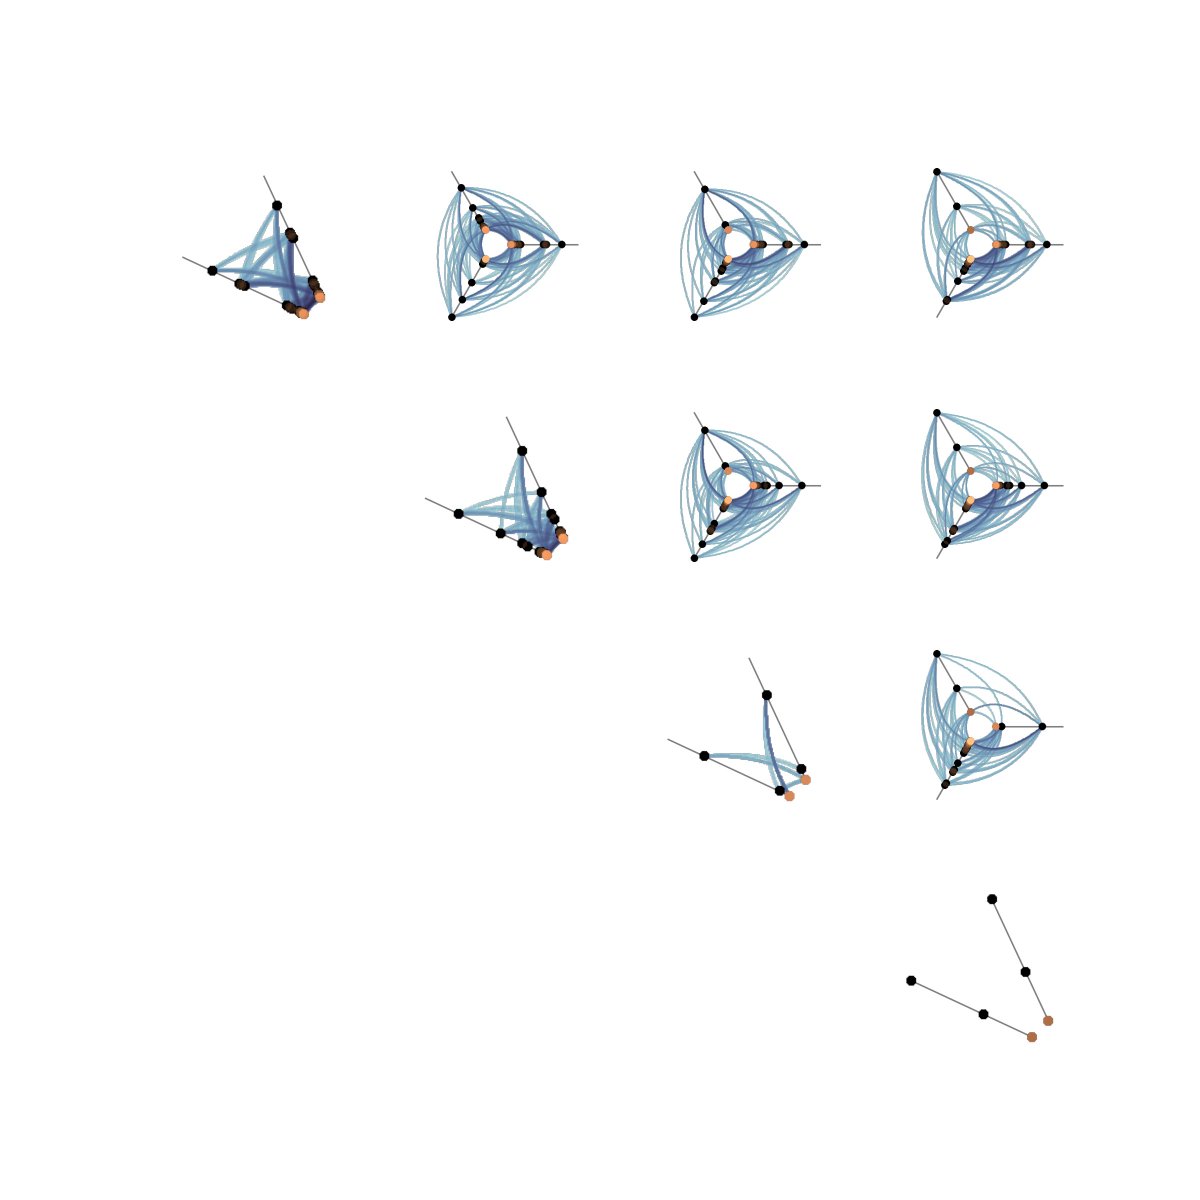
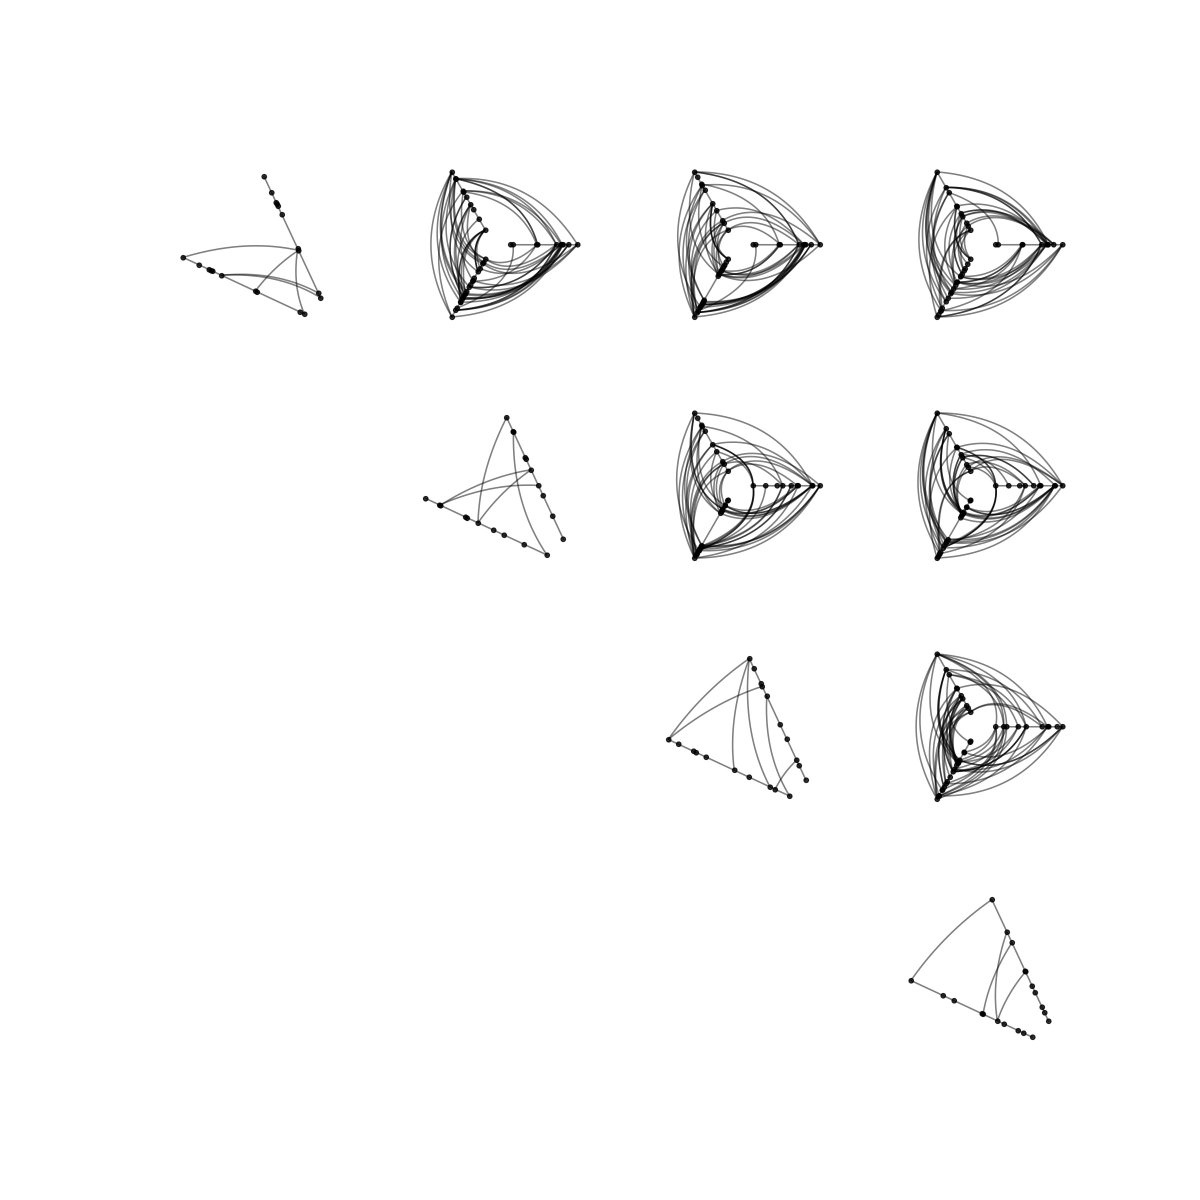
Hiveplotlib 0.27.0 is here! This release supports Hive Plot Matrices for network exploration, plus major speedups via @numba_jit and parallelization. Check out the thread below for more info.
1
17
Apr 11
Hiveplotlib 0.27.0 is here! This release supports Hive Plot Matrices for network exploration, plus major speedups via @numba_jit and parallelization. Check out the thread below for more info.
1
17
Apr 11
For more on how we sped up hive plot construction and visualization, check out our blog post: hiveplotlib.readthedocs.io/s…

1
6
11 Oct 2025
If you’re struggling to make your hive plot, but can’t find what you’re looking for in our docs, let us know! DM us on X or make an issue in our Gitlab repository here: gitlab.com/geomdata/hiveplot…
34
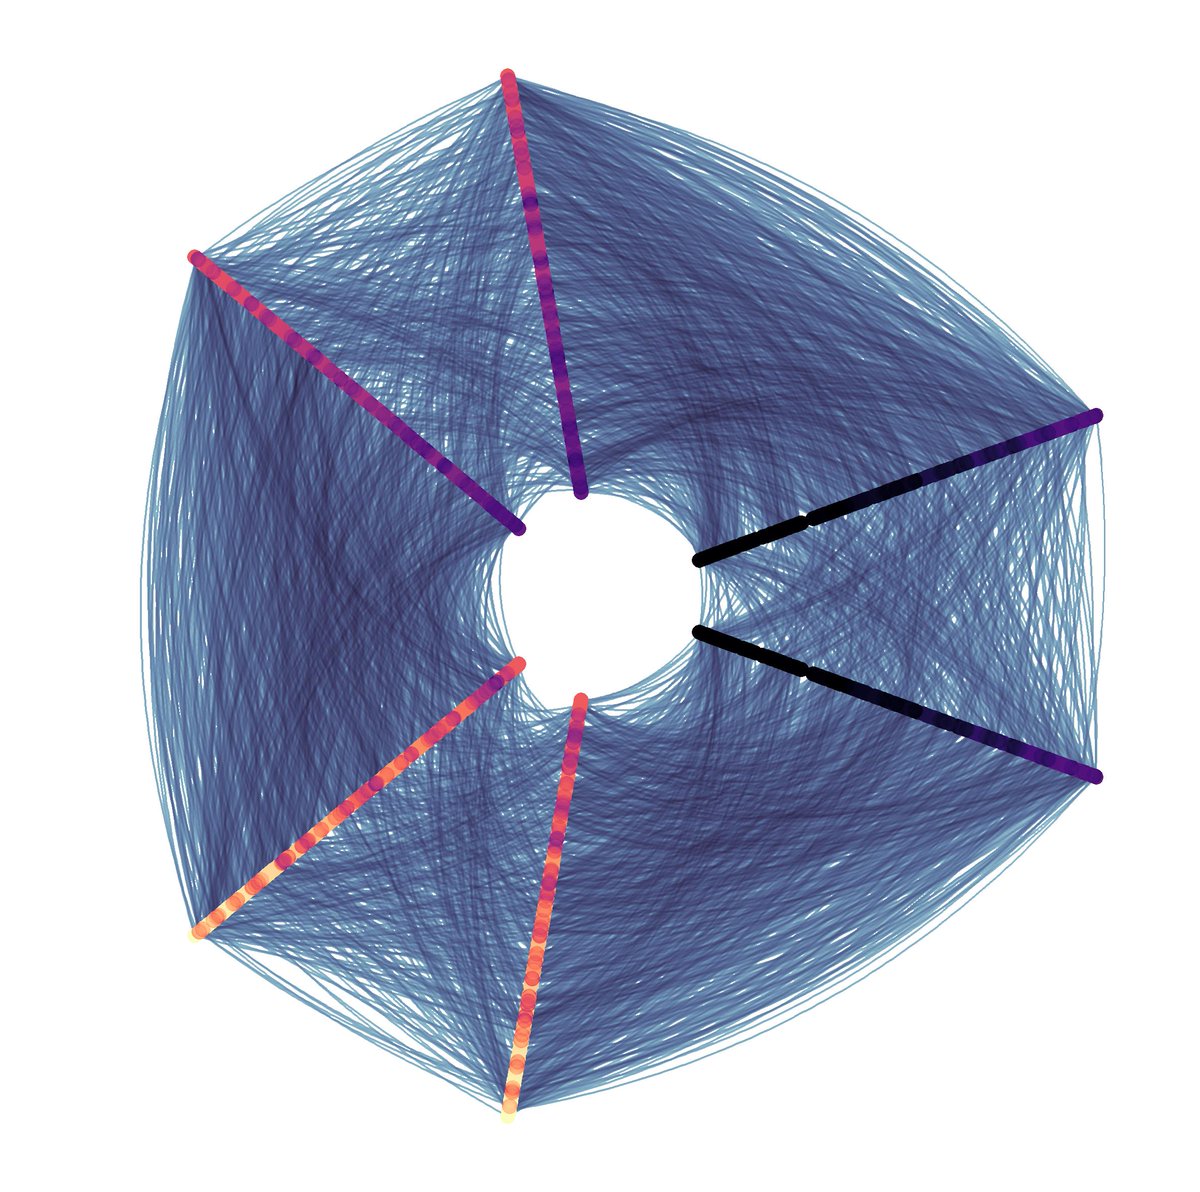
11 Oct 2025
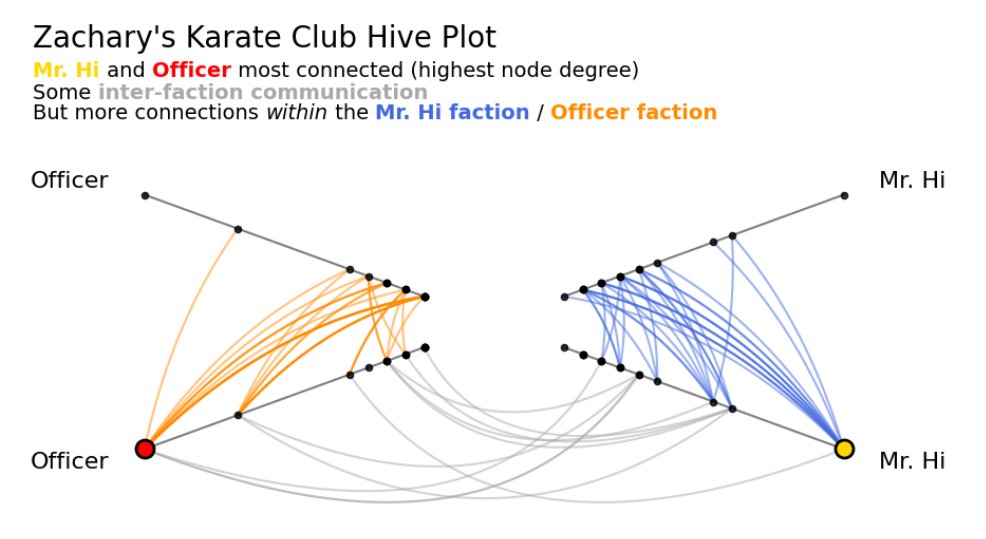
From 1970-1972, Wayne W. Zachary observed a karate club split into two factions. Did they split based on friendships? With a hive plot visualization, we can quickly see that people talked more within factions, but also that the factions were not completely isolated.
1
21
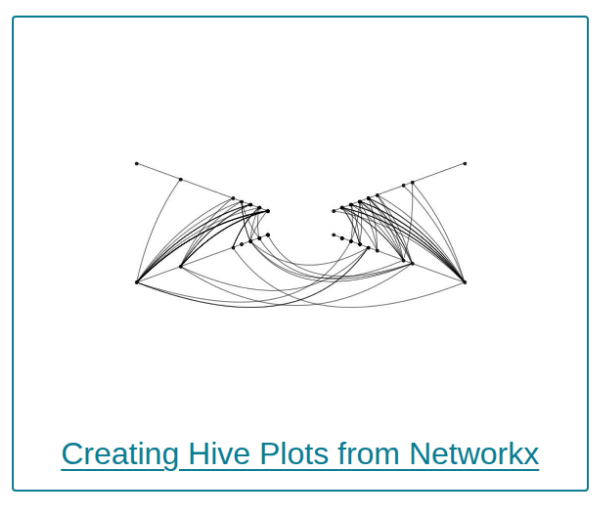
11 Oct 2025
Interested in visualizing your network data with hive plots? Is your network data in a @networkx_team Graph? Check out our Creating Hive Plots from Networkx page at the link below
1
20
11 Oct 2025
Check out our Creating Hive Plots from Networkx page here: hiveplotlib.readthedocs.io/s…
1
12
11 Oct 2025
And for more on using hive plots for network visualization, check out our intro page: hiveplotlib.readthedocs.io/s…
16
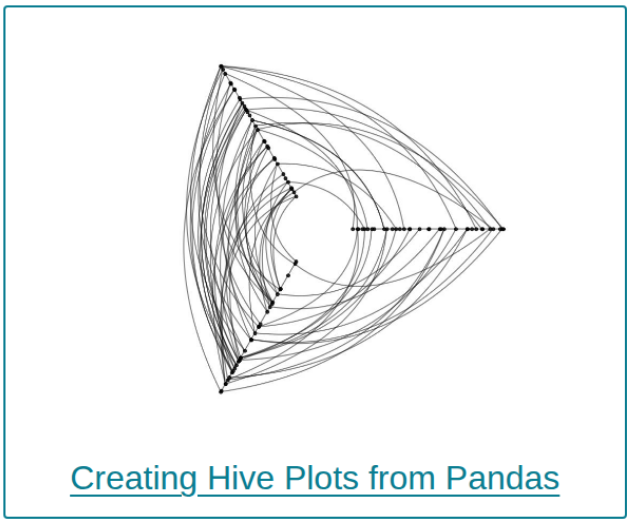
11 Oct 2025
Interested in visualizing your network data with hive plots? Is your network data in @pandas_dev DataFrames? Check out our Creating Hive Plots from Pandas page at the link below
1
13
11 Oct 2025
Check out our Creating Hive Plots from Pandas page here: hiveplotlib.readthedocs.io/s…
1
12
11 Oct 2025
And for more on using hive plots for network visualization, check out our intro page: hiveplotlib.readthedocs.io/s…
15
27 Sep 2025
Hiveplotlib supports visualization using multiple python viz libraries, but using each plotting tool is a bit different in practice. To help users out, we added docs for each of our supported viz back ends, check it out at the link below
1
2
25
27 Sep 2025
Whether you want to use the default matplotlib back end, an interactive back end to explore your hive plot with hover tools, or the datashader back end for large networks, Hiveplotlib v0.26 makes the switch easy! Check out our Changing Viz Back Ends page at the link below
1
26
27 Sep 2025
The new Hiveplotlib release adds hover support for the @bokeh , @HoloViews , and @plotlygraphs back ends! Each of these back ends supports hover metadata for nodes, axes, and edges. We go into the details of using hover info with each back end in the links below.
1
1
34
27 Sep 2025
For more information on hover info with the @HoloViews (with Bokeh) back end, see our Holoviews-Bokeh page: hiveplotlib.readthedocs.io/s…
1
21
27 Sep 2025
For more information on hover info with the @plotlygraphs back end, see our Plotly page: hiveplotlib.readthedocs.io/s…
18