
|| * Travelling passionate * Contest freak * Gadget freak * Photography passionate ||
Joined February 2010
- Tweets 32,858
- Following 4,004
- Followers 840
- Likes 17,626
1,290 Photos and videos


ᴅʜᴀʀᴍɪɴ retweeted

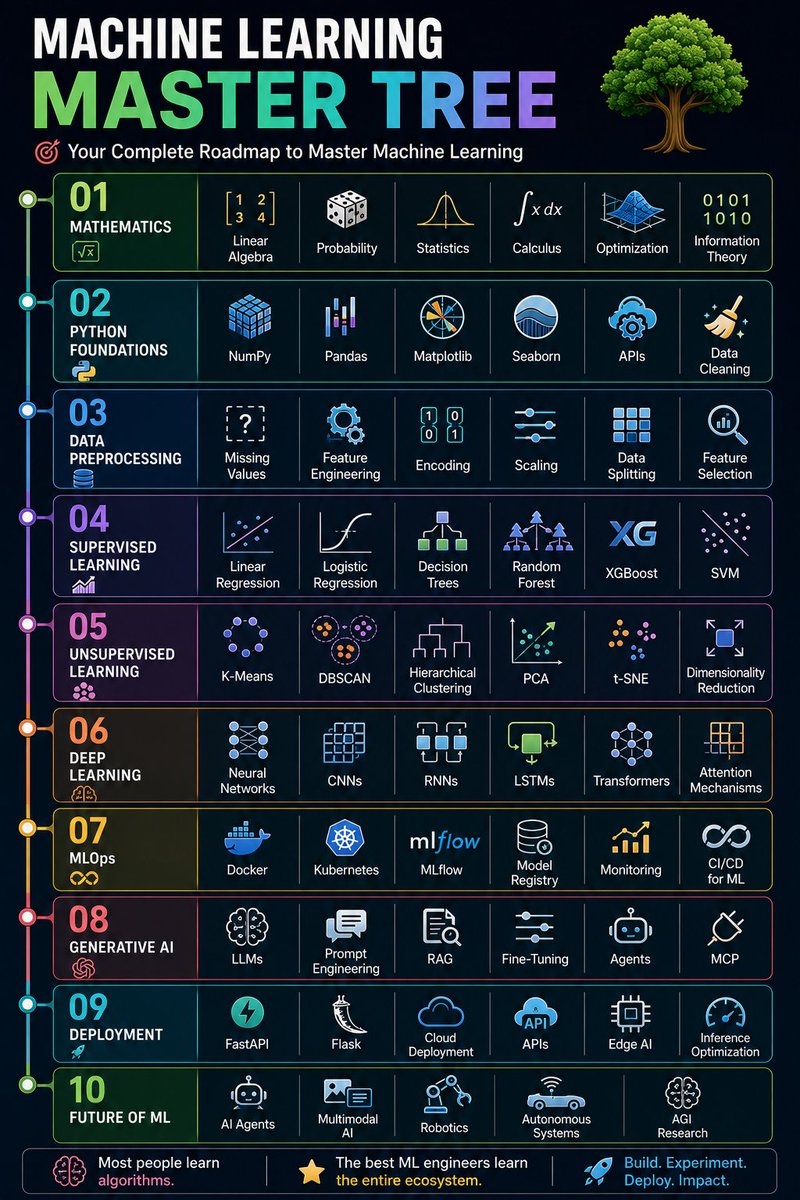
MACHINE LEARNING — MASTER TREE 🌲
Machine Learning
│
├── 01. Mathematics
│ ├── Linear Algebra
│ ├── Probability
│ ├── Statistics
│ ├── Calculus
│ ├── Optimization
│ └── Information Theory
│
├── 02. Python Foundations
│ ├── NumPy
│ ├── Pandas
│ ├── Matplotlib
│ ├── Seaborn
│ ├── APIs
│ └── Data Cleaning
│
├── 03. Data Preprocessing
│ ├── Missing Values
│ ├── Feature Engineering
│ ├── Encoding
│ ├── Scaling
│ ├── Data Splitting
│ └── Feature Selection
│
├── 04. Supervised Learning
│ ├── Linear Regression
│ ├── Logistic Regression
│ ├── Decision Trees
│ ├── Random Forest
│ ├── XGBoost
│ └── SVM
│
├── 05. Unsupervised Learning
│ ├── K-Means
│ ├── DBSCAN
│ ├── Hierarchical Clustering
│ ├── PCA
│ ├── t-SNE
│ └── Dimensionality Reduction
│
├── 06. Deep Learning
│ ├── Neural Networks
│ ├── CNNs
│ ├── RNNs
│ ├── LSTMs
│ ├── Transformers
│ └── Attention Mechanisms
│
├── 07. MLOps
│ ├── Docker
│ ├── Kubernetes
│ ├── MLflow
│ ├── Model Registry
│ ├── Monitoring
│ └── CI/CD for ML
│
├── 08. Generative AI
│ ├── LLMs
│ ├── Prompt Engineering
│ ├── RAG
│ ├── Fine-Tuning
│ ├── Agents
│ └── MCP
│
├── 09. Deployment
│ ├── FastAPI
│ ├── Flask
│ ├── Cloud Deployment
│ ├── APIs
│ ├── Edge AI
│ └── Inference Optimization
│
└── 10. Future of ML
├── AI Agents
├── Multimodal AI
├── Robotics
├── Autonomous Systems
└── AGI Research
11
175
728
19,133
ᴅʜᴀʀᴍɪɴ retweeted

May 24
ALL FREE CERTIFICATION RESOURCES
AWS
drive.google.com/drive/mobil…
CISSP
drive.google.com/drive/mobil…
CISA
drive.google.com/drive/mobil…
CISM
drive.google.com/drive/mobil…
CRISC
drive.google.com/drive/mobil…
Digital Marketing
drive.google.com/drive/mobil…
Retweet to help others
3
128
363
15,873
ᴅʜᴀʀᴍɪɴ retweeted

May 24
22 Monopoly Stocks in India for investment!
1- IRCTC (100% in the ticketing business)
2- HAL (100% in defense manufacturing)
3- CDSL (59% in depository business)
4- Coal India (82% in coal production)
5- Pidilite (70% share in adhesive)
6- Nestle (96.5% share in cerelac industry)
7- MCX (92% of India’s commodities exchange sector)
8- Syngene (50% of the contract research and manufacturing services (CRAMS) market in India)
9- Praj Industries (60% in ethanol plant installation industry)
10- Asahi India Glass (77% of the automotive glass market and 50% of the architectural glass market in India)
11- Hindustan Zinc (78% in zinc industry)
12- ITC (77% in cigarettes)
13- CONCOR (68.52% in cargo carrier)
14- BHEL (67% in the power equipment sector)
15- DFL (DreamFolks is India's largest airport service aggregator)
16- APL Apollo (50% share in pre-galvanised and structural tube industry)
17- Borosil Renewables (India's only solar glass maker for over a decade)
18- BKT (6% of the global off-highway tire market and 30% of the Indian market)
19- IEX (95% of short-term electricity contracts in India)
20- CAMS (70% within the mutual fund industry)
21- Marico (73% in oil products)
22- NOCIL (it is the largest rubber chemical manufacturing company with 40% market share in India)
Which Stock You Are Holding ??
#stocks #investing
7
51
214
19,215


ᴅʜᴀʀᴍɪɴ retweeted

May 6
ATTENTION TRADERS
THE CANDLESTICK BIBLE IS HERE
✅ MORNING STAR = BUY
✅ BULLISH ENGULFING = BUY
✅ HAMMER = BUY
❌ EVENING STAR = SELL
❌ BEARISH ENGULFING = SELL
❌ SHOOTING STAR = SELL
❌ HANGING MAN = SELL
MASTER THESE PATTERNS.
DOMINATE THE MARKET.

1
35
144
4,729
ᴅʜᴀʀᴍɪɴ retweeted

Good move by the government
You can now safely deposit WILL with the district registrar for ₹100

22
310
1,161
89,171
ᴅʜᴀʀᴍɪɴ retweeted

May 4
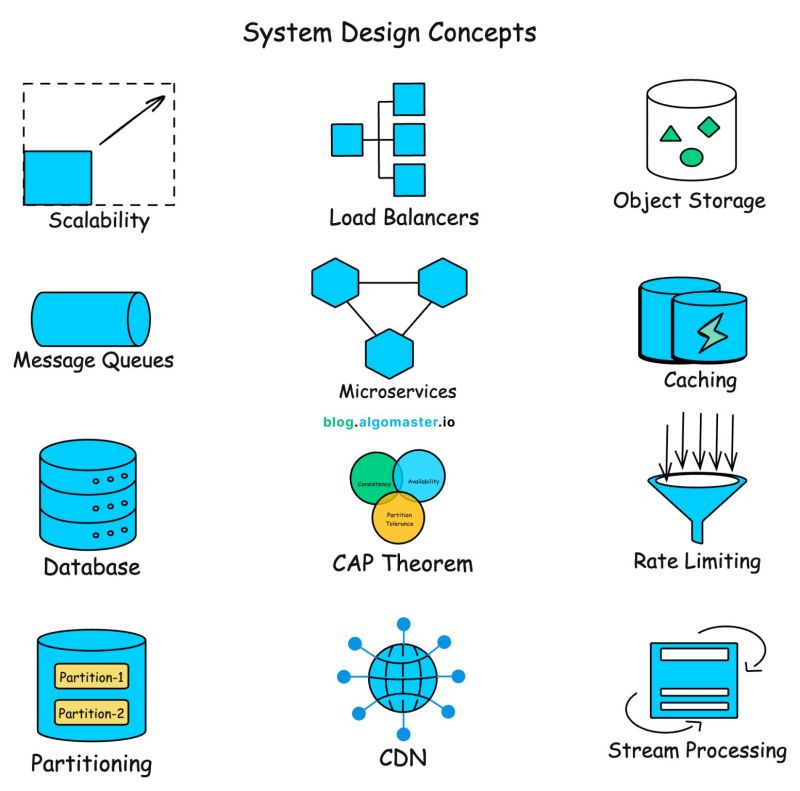
𝟯𝟬 𝗕𝗹𝗼𝗴𝘀 𝘁𝗼 𝗟𝗲𝗮𝗿𝗻 𝟯𝟬 𝗦𝘆𝘀𝘁𝗲𝗺 𝗗𝗲𝘀𝗶𝗴𝗻 𝗖𝗼𝗻𝗰𝗲𝗽𝘁𝘀:
1. APIs: lnkd.in/dsbwPZ6N
2. API Gateways: lnkd.in/gtyXmvf4
3. JWTs: lnkd.in/ghtXYRqU
4. Webhooks: lnkd.in/geHxGX-7
5. REST vs GraphQL: lnkd.in/gM5VHKQS
6. Load Balancing: lnkd.in/gvxfwEUr
7. Proxy vs Reverse Proxy: lnkd.in/gMTtidBq
8. Scalability: lnkd.in/gPGhW-qK
9. Availability: lnkd.in/gQk2p4_6
10. SPOF: lnkd.in/gw_uHZWn
11. CAP Theorem: lnkd.in/g_tFqJJb
12. SQL vs NoSQL: lnkd.in/gHyC9qWc
13. ACID Transactions: lnkd.in/dB3QHiMz
14. Database Indexes: lnkd.in/g_-bQWtA
15. Database Sharding: lnkd.in/g9mc-d5m
16. Consistent Hashing: lnkd.in/gR9wFDpz
17. CDC: lnkd.in/gWhGwh9Z
18. Caching: lnkd.in/gBSeTstS
19. Caching Strategies: lnkd.in/dVk7nZ_Y
20. Cache Eviction Policies: lnkd.in/gQAEXEmq
21. CDN: lnkd.in/gaW4Vkpy
22. Rate Limiting Algorithms: lnkd.in/gYDxg8XY
23. Message Queues: lnkd.in/g-jnNGDC
24. Bloom Filters: lnkd.in/gfGjCrSZ
25. Idempotency: lnkd.in/gDB3AJij
26. Concurrency vs Parallelism: lnkd.in/gGZXhjBD
27. Long Polling vs WebSockets: lnkd.in/d9xKD28K
28. Stateful vs. Stateless Architecture: lnkd.in/gz_ccK-Y
29. Batch vs Stream Processing: lnkd.in/gKtj_qWh
30. Geohashing: lnkd.in/gjSbKdpN
🔁 Repost to help a friend.
📌 Save this post for later.
5
367
1,617
64,585
ᴅʜᴀʀᴍɪɴ retweeted

📊 Top 12 Mutual Funds Across Key Categories
🔳 Flexi Cap
▪️ Parag Parikh Flexi Cap Fund
▪️ HDFC Flexi Cap Fund
▪️ Helios Flexi Cap Fund
🔳 Small Cap
▪️ Nippon India Small Cap
▪️ HDFC Small Cap
▪️ Quant Small Cap Fund
🔳 Mid Cap
▪️ HDFC Mid Cap Fund
▪️ Invesco India Mid Cap Fund
▪️ Motilal Oswal Midcap Fund
🔳 Large Cap
▪️ ICICI Prudential Large Cap
▪️ Nippon India Large Cap
▪️ Mirae Asset Large Cap Fund
Disclaimer:
🚫 No Recommendation.
Do your own research before investing.
2
16
123
13,068
ᴅʜᴀʀᴍɪɴ retweeted

Learn these 3 major trading concepts here

1
63
409
16,101
ᴅʜᴀʀᴍɪɴ retweeted

Every Trading Strategy Explained in 6 Minutes
0:00 - Fibonacci Retracements
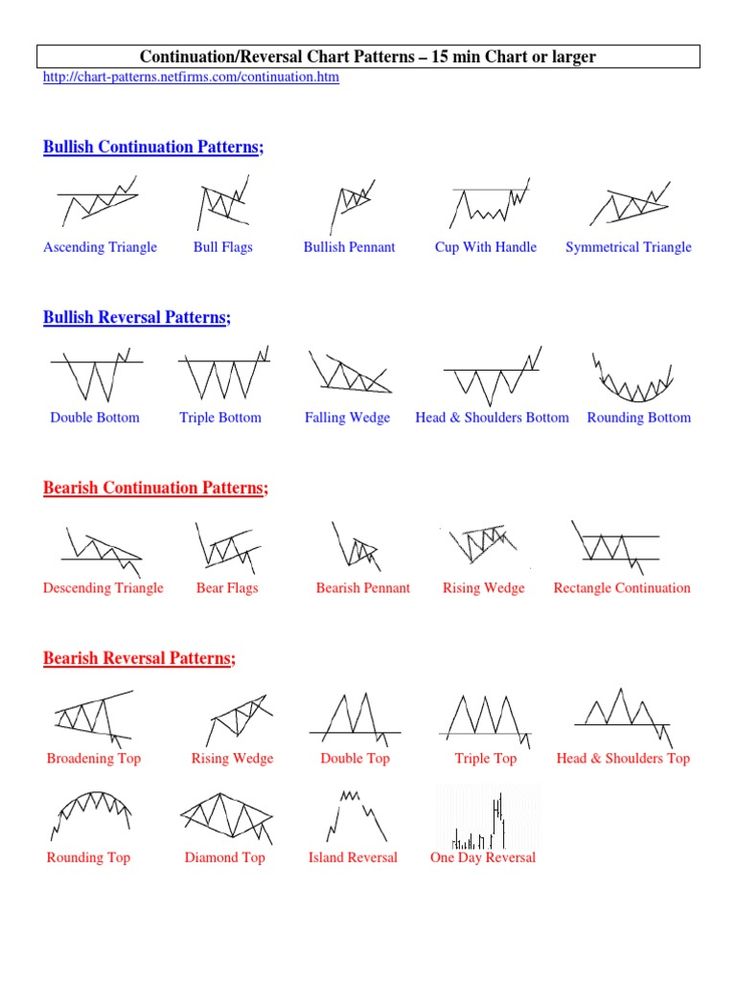
0:27 - Chart Patterns
1:01 - Elliot Wave
1:51 - FVG
3:06 - Support & Resistance
5:01 - Volume
5:22 - Supply and Demand
5:50 - Break of Structure
5:58 - Change of Character
42
1,125
4,432
421,557
ᴅʜᴀʀᴍɪɴ retweeted

Apr 28
This is a Big News!
Parle Products Initiates Talks for its Mega IPO
The Legacy FMCG Giant has started discussions with Kotak Mahindra Capital, JM Financial, Axis Capital and another two Bankers
Parle Products remains one of India’s largest unlisted companies. Founded in 1929 by the Chauhan family in Mumbai, the business is now led by the third generation—Vijay, Sharad, and Raj Chauhan—and is 100% promoter-owned.
The Parle-G parent has reported ~18,000 Crores in Revenues in FY25
Parle-G is ranked as world’s top-selling biscuit brands,
Its portfolio also includes Monaco, KrackJack, Hide & Seek, Melody, 20-20, Mango Bite, Londonderry, Kismi, Etc.
The IPO is likely to be a Full OFS, formal pitches are expected in progress by Mid-May

10
29
418
33,400
ᴅʜᴀʀᴍɪɴ retweeted

Apr 11
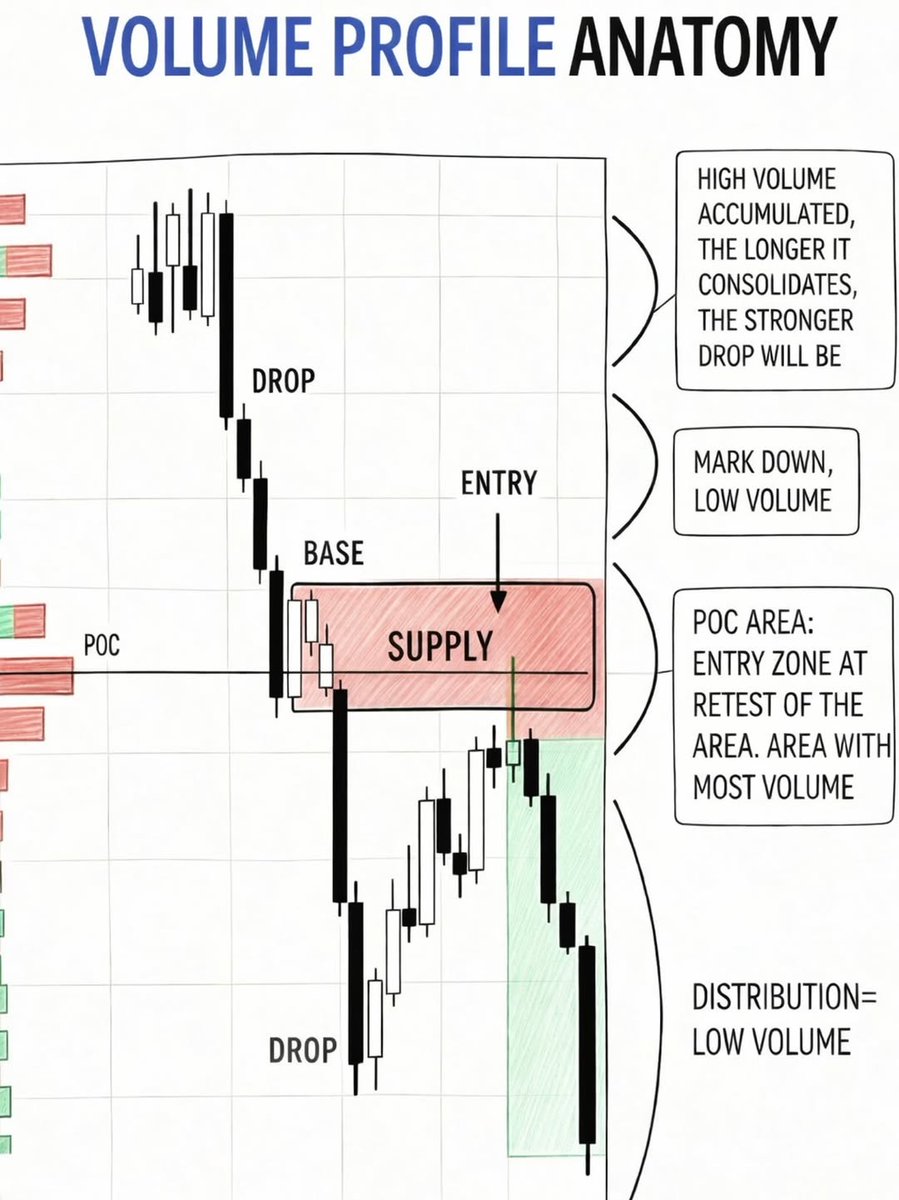
🚨 MASTER THE MARKET WITH VOLUME PROFILE 🚨
Smart money leaves clues, and
volume tells the story.
✍️High volume zones = strong
resistance
🟢 Low volume zones = fast moves
✍️ POC = your high-probability
entry
Learn to read supply, spot
distribution, and catch the
drop before it happens.
Trade smarter, not harder.
1
12
54
2,590


ᴅʜᴀʀᴍɪɴ retweeted
Apr 11
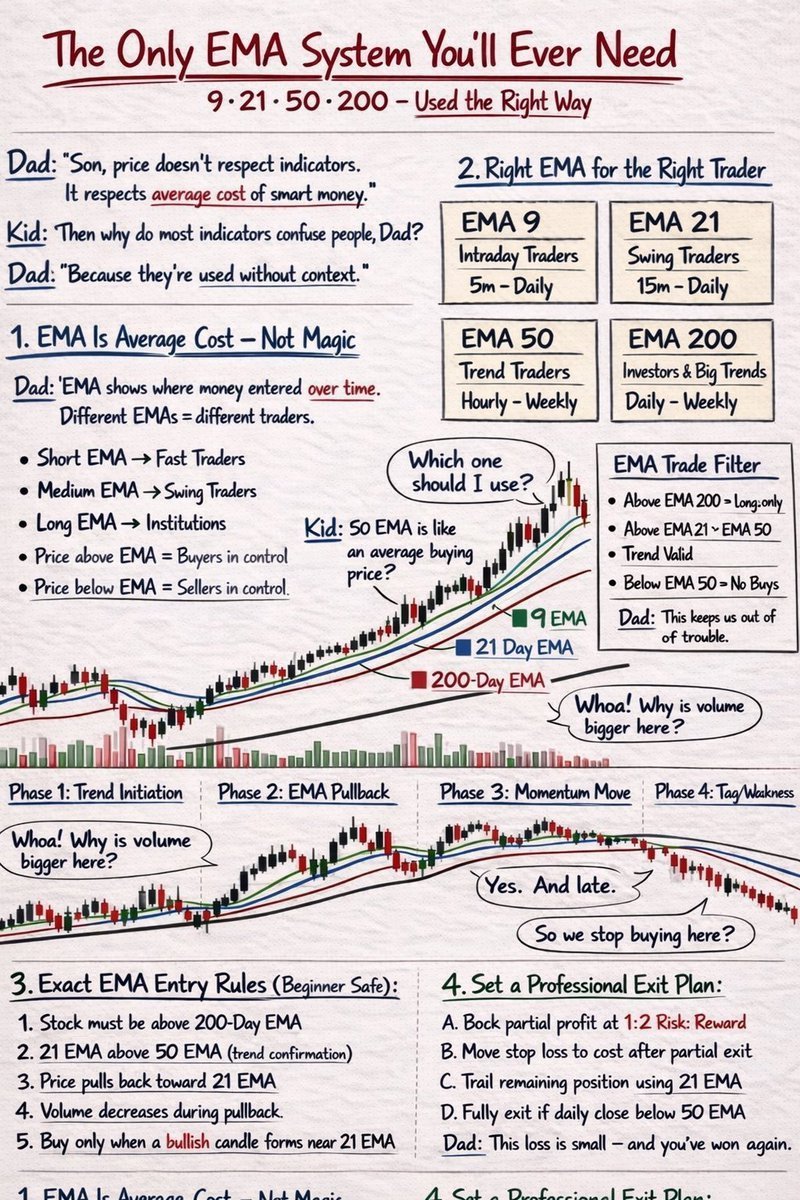
The Only EMA System You’ll Ever Need (Used the Right Way)
Price doesn’t “respect” indicators.
It respects the average cost of smart money.
That’s all EMAs are.
EMA = context, not magic.
• EMA 9 → Intraday traders
• EMA 21 → Swing traders
• EMA 50 → Trend traders
• EMA 200 → Investors & big trends
Different EMAs = different players.
Market control rule:
Price above EMA → Buyers in control
Price below EMA → Sellers in control
High-probability filter:
✔ Price above 200 EMA
✔ 21 EMA above 50 EMA
✔ Pullback toward 21 EMA
✔ Volume dries up on pullback
✔ Buy only on bullish candle near 21 EMA
Trend phases:
1️⃣ Initiation
2️⃣ EMA pullback
3️⃣ Momentum expansion
4️⃣ Weakness (stop chasing)
Exit like a pro:
• Take partials at 1:2 RR
• Move stop to breakeven
• Trail with 21 EMA
• Exit fully if price closes below 50 EMA
EMAs don’t predict.
They protect you from bad trades.
Trade with context. Stay patient.
#trading #investing
4
120
634
39,491
ᴅʜᴀʀᴍɪɴ retweeted

Apr 8
Cybersecurity best practices. #indiancert #cyberswachhtakendra #StaySafeOnline #cybersecurity #besafe #staysafe #mygov #Meity #onlinefraud #cybercrime #scamming #cyberalert #CSK #CyberSecurityAwareness

3
6
262
ᴅʜᴀʀᴍɪɴ retweeted

Apr 4
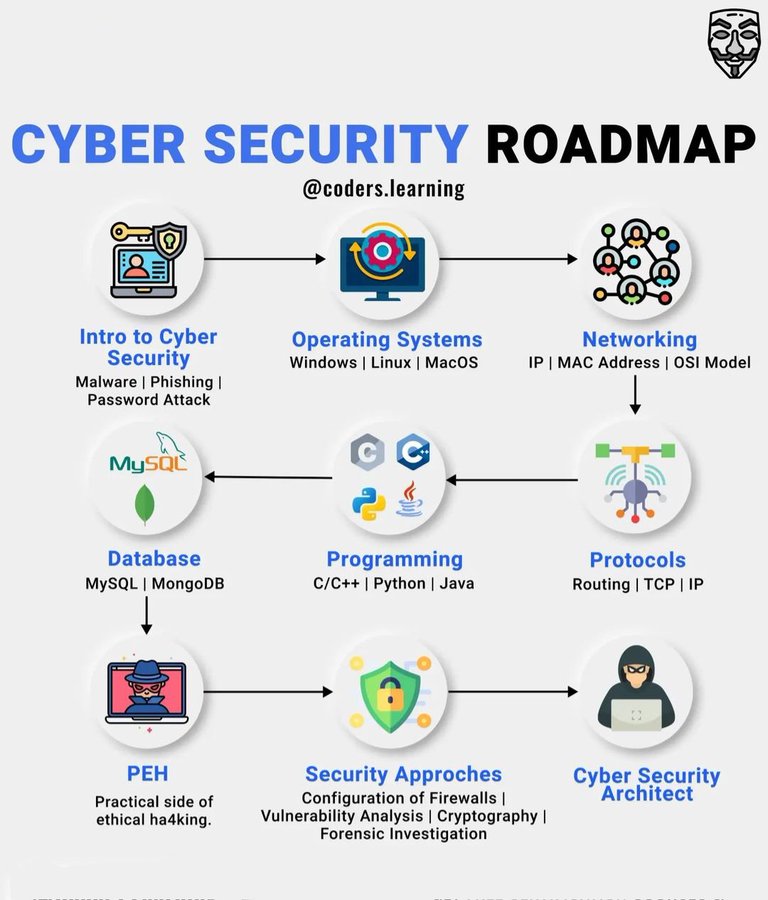
Free Online Cybersecurity Courses and Certifications in 2026.
Here are 15 FREE courses to help you master Cybersecurity 👇👇
1. IBM Cybersecurity Analyst Professional Certificate
🔗imp.i384100.net/Y9x7eO
2. Microsoft Cybersecurity Analyst Professional Certificate
🔗 imp.i384100.net/ZQ4bNQ
3. Cloud Application Development Foundations Specialization
🔗 imp.i384100.net/m5BYMD
4. Developing Applications with Google Cloud Specialization
🔗 imp.i384100.net/zNqg4e
5. Introduction to Cloud Computing
🔗 imp.i384100.net/DKr7vy
6. Understanding Google Cloud Security and Operations
🔗 imp.i384100.net/Qyg7MY
7. Innovating with Data and Google Cloud
🔗 imp.i384100.net/5g3ovn
8. Microsoft Azure Fundamentals: Describe cloud concepts
🔗 learn.microsoft.com/en-us/tr…
9. GoogleCloud: Google Cloud Computing Foundations: Cloud Computing Fundamentals
🔗 edx.org/learn/cloud-computin…
10. Cloud Computing Basics (Cloud 101)
🔗imp.i384100.net/DKr7vq
11. IT Fundamentals for Cybersecurity Specialization
🔗imp.i384100.net/9g307Q
12. Introduction to Cybersecurity Tools & Cyber Attacks
🔗 imp.i384100.net/PyZ7Mq
13. Cyber Security Course for Beginners
udemy.com/course/certified-s…
14. Introduction to Cyber Security
mygreatlearning.com/academy/…
15. For Beginners
simplilearn.com/learn-cyber-…
Happy Learning 🌟
1
43
188
8,080
ᴅʜᴀʀᴍɪɴ retweeted

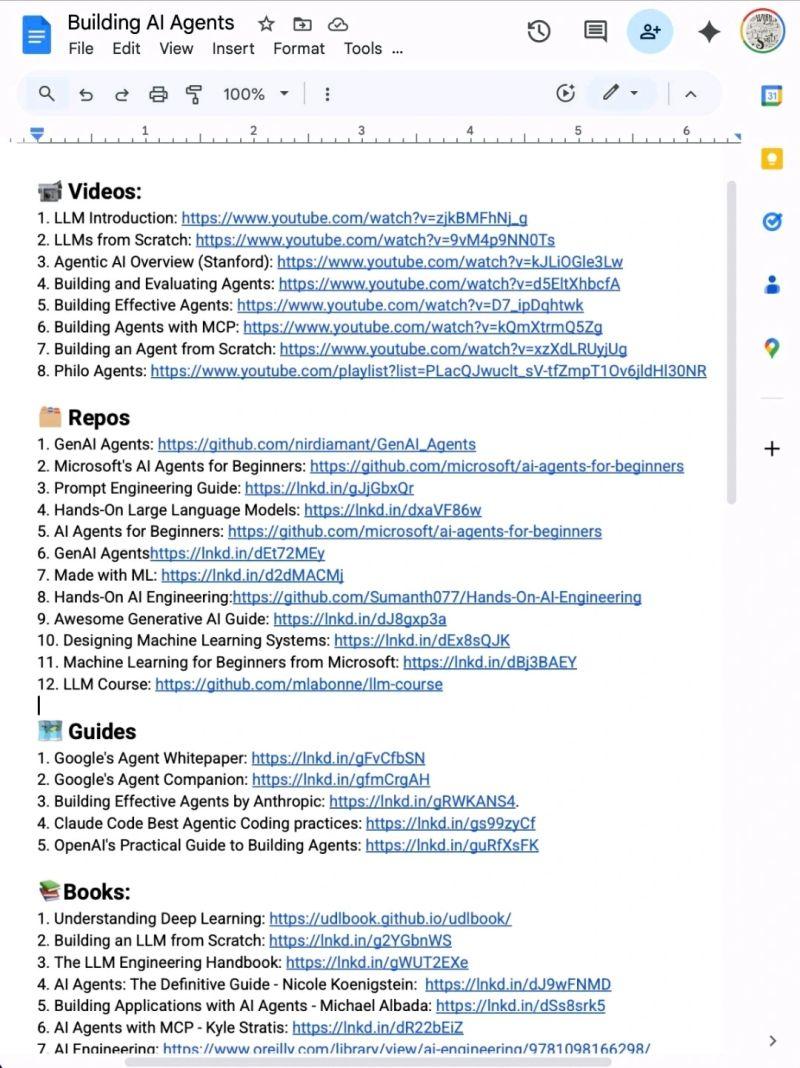
Stop wasting hours trying to learn AI. 📘📚
I have already done it for you.
With one list. Zero confusion. And no fluff
📹 Videos:
1. LLM Introduction: lnkd.in/dMqbaZdK
2. LLMs from Scratch: lnkd.in/dYYwEhYy
3. Agentic AI Overview (Stanford): lnkd.in/dArmMt2i
4. Building and Evaluating Agents: lnkd.in/dBWd2W8u
5. Building Effective Agents: lnkd.in/dHfdebqw
6. Building Agents with MCP: lnkd.in/dXuNHrRJ
7. Building an Agent from Scratch: lnkd.in/da3ANw3w
8. Philo Agents: lnkd.in/dq-BfZE5
🗂️ Repos
1. GenAI Agents: lnkd.in/d3UDtwwv
2. Microsoft's AI Agents for Beginners: lnkd.in/dHvTmJnv
3. Prompt Engineering Guide: lnkd.in/gJjGbxQr
4. Hands-On Large Language Models: lnkd.in/dxaVF86w
5. AI Agents for Beginners: lnkd.in/dHvTmJnv
6. GenAI Agentshttps://lnkd.in/dEt72MEy
7. Made with ML: lnkd.in/d2dMACMj
8. Hands-On AI Engineering:lnkd.in/dgQtRyk7
9. Awesome Generative AI Guide: lnkd.in/dJ8gxp3a
10. Designing Machine Learning Systems: lnkd.in/dEx8sQJK
11. Machine Learning for Beginners from Microsoft: lnkd.in/dBj3BAEY
12. LLM Course: lnkd.in/diZgGACG
🗺️ Guides
1. Google's Agent Whitepaper: lnkd.in/gFvCfbSN
2. Google's Agent Companion: lnkd.in/gfmCrgAH
3. Building Effective Agents by Anthropic: lnkd.in/gRWKANS4.
4. Claude Code Best Agentic Coding practices: lnkd.in/gs99zyCf
5. OpenAI's Practical Guide to Building Agents: lnkd.in/guRfXsFK
📚Books:
1. Understanding Deep Learning: lnkd.in/dgcB68Qt
2. Building an LLM from Scratch: lnkd.in/g2YGbnWS
3. The LLM Engineering Handbook: lnkd.in/gWUT2EXe
4. AI Agents: The Definitive Guide - Nicole Koenigstein: lnkd.in/dJ9wFNMD
5. Building Applications with AI Agents - Michael Albada: lnkd.in/dSs8srk5
6. AI Agents with MCP - Kyle Stratis: lnkd.in/dR22bEiZ
7. AI Engineering: lnkd.in/gi-mQcXa
📜 Papers
1. ReAct: lnkd.in/gRBH3ZRq
2. Generative Agents: lnkd.in/gsDCUsWm.
3. Toolformer: lnkd.in/gyzrege6
4. Chain-of-Thought Prompting: lnkd.in/gaK5CXzD.
🧑🏫 Courses:
1. HuggingFace's Agent Course: lnkd.in/gmTftTXV
2. MCP with Anthropic: lnkd.in/geffcwdq
3. Building Vector Databases with Pinecone: lnkd.in/gCS4sd7Y
4. Vector Databases from Embeddings to Apps: lnkd.in/gm9HR6_2
5. Agent Memory: lnkd.in/gNFpC542
Repost for your network ♻️
15
243
839
118,110
ᴅʜᴀʀᴍɪɴ retweeted

Apr 5
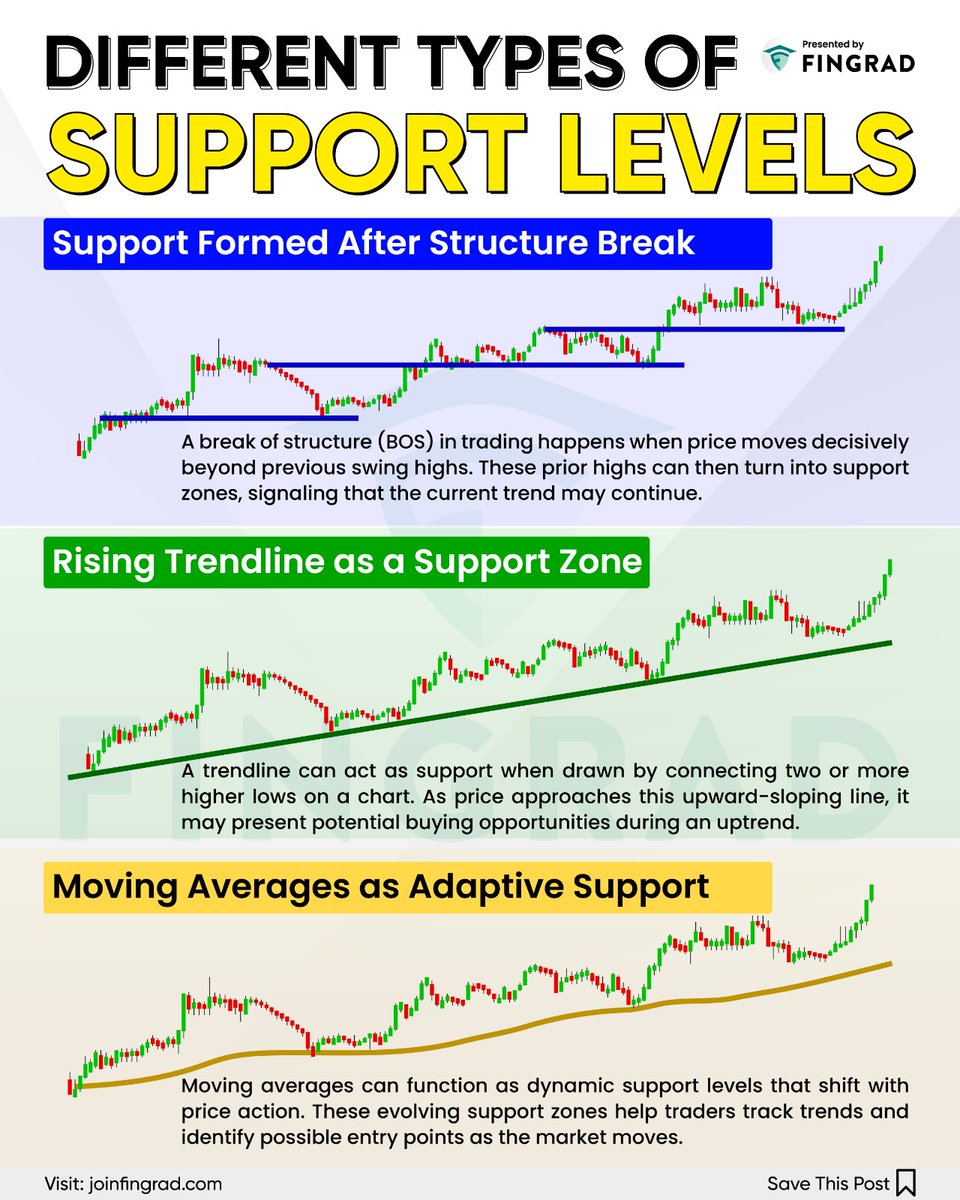
This provides an overview of how traders identify floor levels in an uptrend using three distinct methods which are Structure Breaks, Rising Trendlines, and Moving Averages. By illustrating how prior resistance flips into support and how dynamic indicators adapt to price action, the shows potential buying opportunities and trend continuity in the financial markets.
18
104
3,557