
Numberphile. Loyalty over everything. Allergic to being average.
Joined August 2023
- Tweets 517
- Following 95
- Followers 2,348
- Likes 5,275
108 Photos and videos


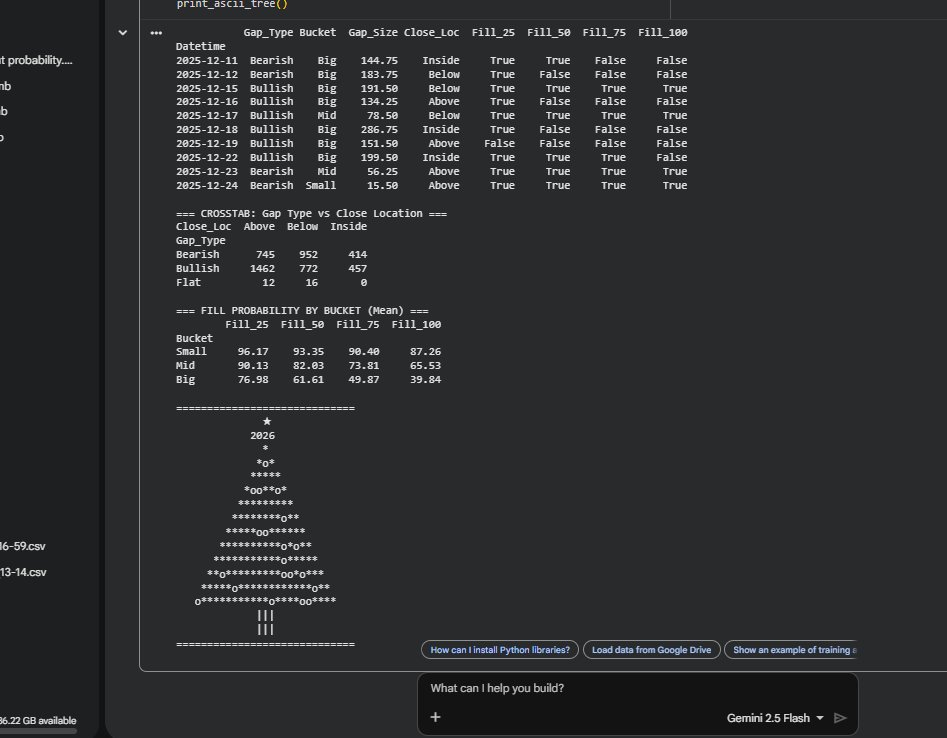
free source code: pastes.io/otubwtMD

7
27
321
39,360
Just published a new TradingView indicator:
ADR Alpha
It’s basically a visualization tool for ADR, showing how much of the move is already done and how much room is left.
• Uses a selectable timeframe
• Projects ADR-based expansion
• Shows remaining % room
• Marks exhaustion clearly
Helps you avoid trading late moves.
As always, for free...
tradingview.com/script/6Gpvb…
8
13
192
16,295
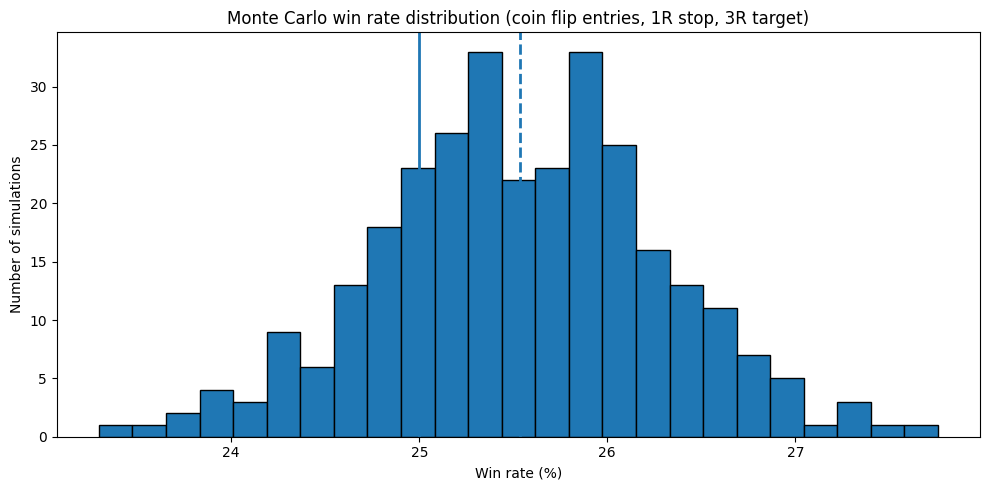
The guy in the comments is right lol. If you flip a coin for trade direction and aim for 3R profit risking 1R you will have ~25% win rate.
I don't blame stoic here since he only knows how to count till 5 (or 6 not sure)😇
Feb 15

imagine calling someone a retard and then saying a coin flip gives you a 25% win rate
I was trying to help him... but then I saw ICT in his handle...

6
34
10,584
Seeing a bunch of similar analyses drop just after my post. must be something in the air! Loving the shared energy 😂
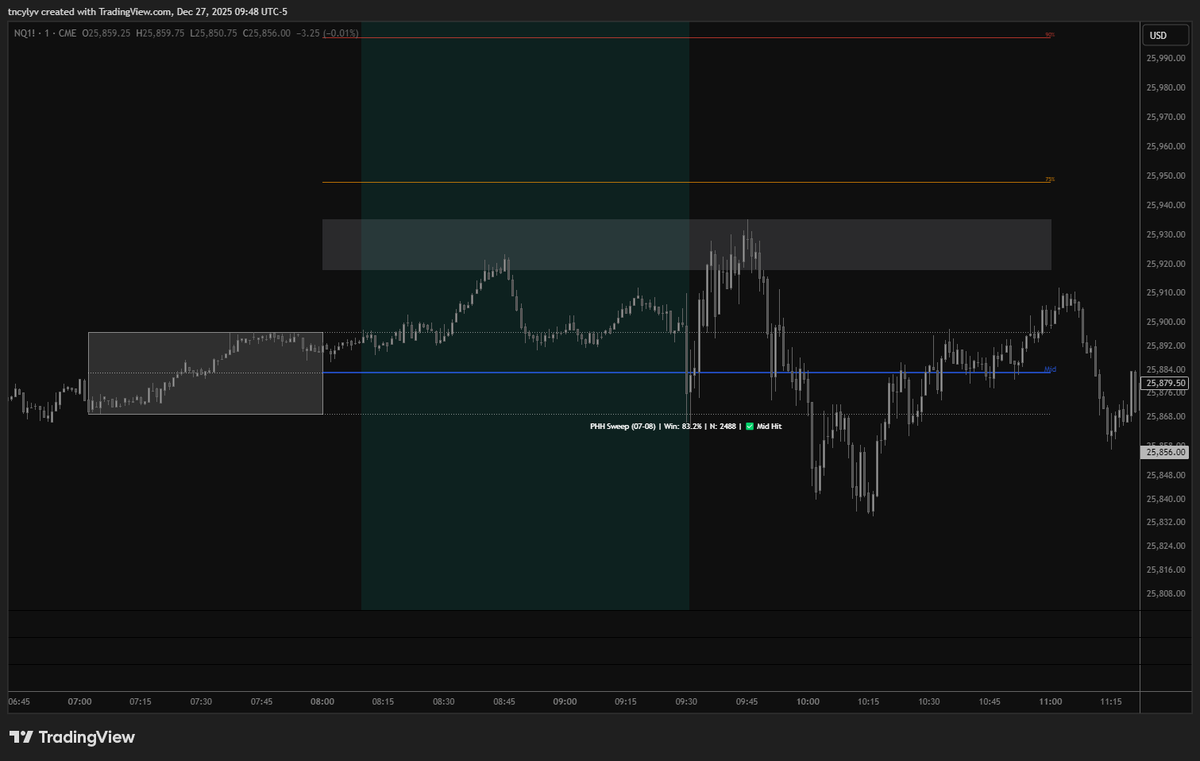
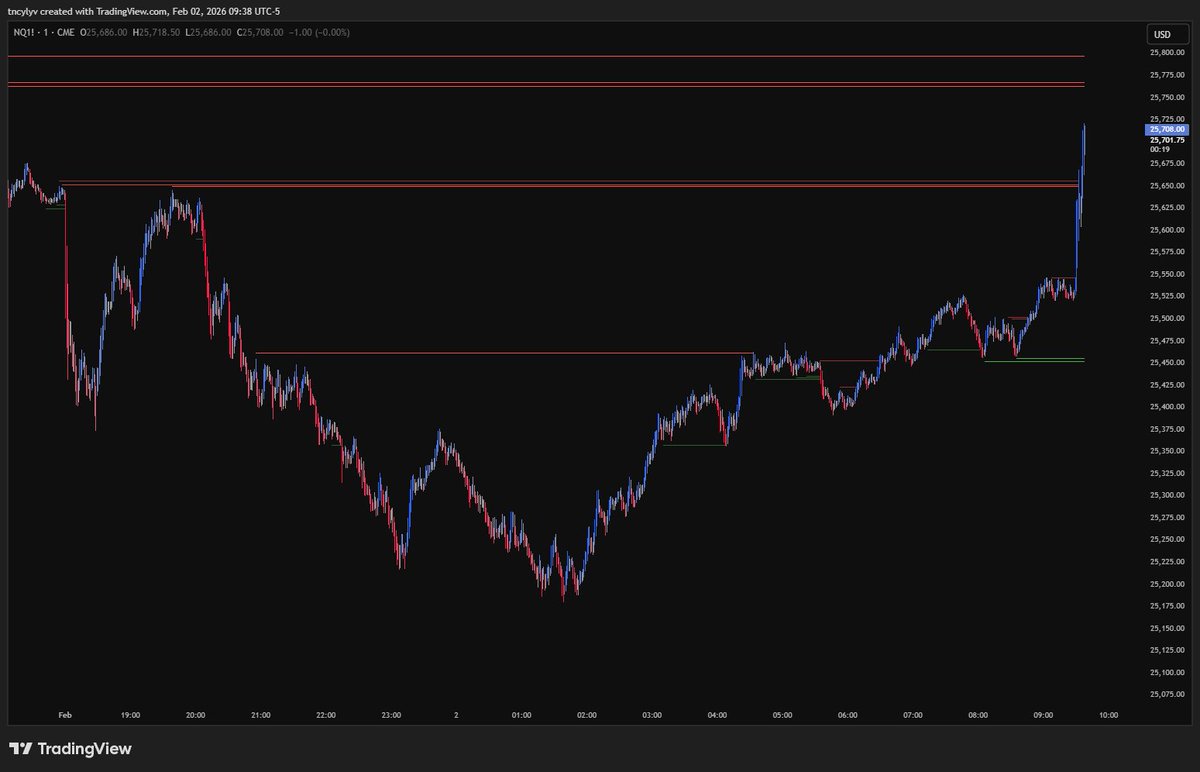
Statistical Observation: Nasdaq(NQ1!) Hourly Range Mean Reversion
I analyzed NQ1! historical price action to measure the probability of price returning to the mid-level of a specific hourly range after a break (sweep) occurs.
Methodology : The study defines a "valid return" as price touching the 50% level of the previous hour's range within a 3-hour window immediately following that hour.
The Outlier 07:00 - 08:00 Range :The data shows a significant statistical anomaly during the 07:00-08:00 window.
Probabilities (Return within 08:00-11:00) :
High Sweep Reversion: 83.2%
Low Sweep Reversion: 82.7%
Average Probability: ~83%
It is an interesting anomaly. You should check this on your own charts to see how price behaves during this specific window.
#DataAnalytics #Quant #NQ #Futures #NQStats
17
4,982
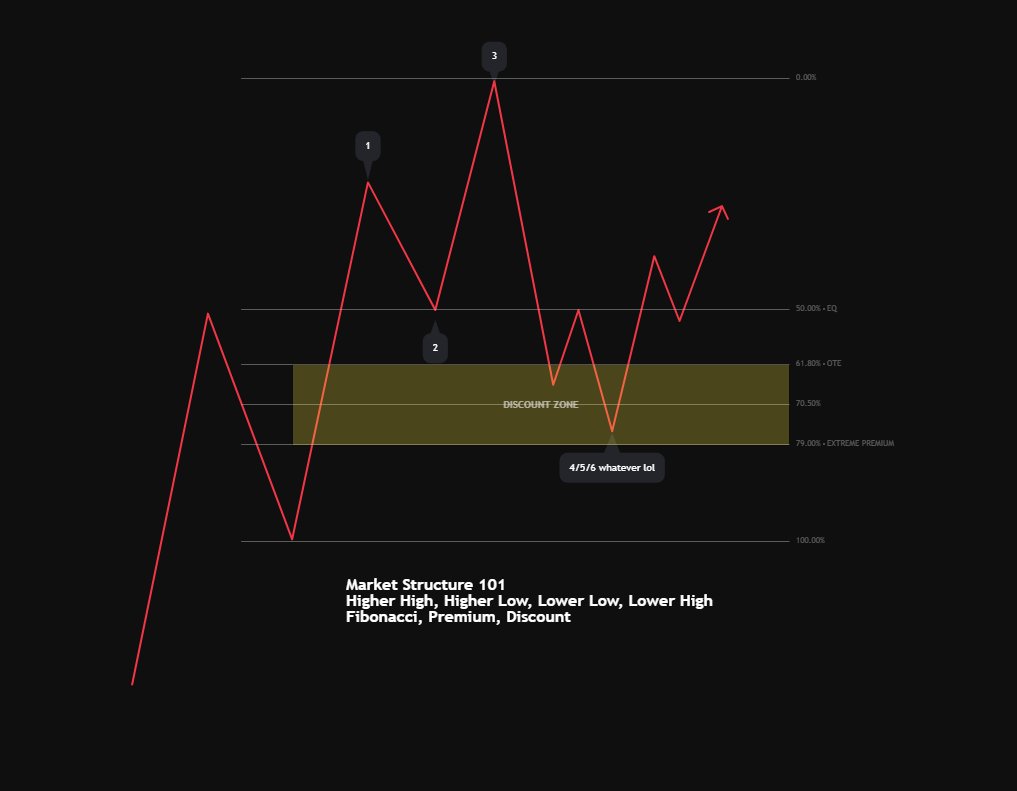
I see so many renamed "paid models" where you count to 5 and suddenly you're profitable.
Even the free ones doing the same thing. Why rename it?
It's just Market Structure. That's it.
They rebrand it to make it sound attractive to new traders who don't know any better.
Just learn:
Market Structure (There are so many sources which explains it wrong , you can check photon youtube video for correct Market Structure)
Fibonacci retracements
Premium/Discount zones
WHY these concepts work (most importantly)
Understand the logic behind price action. Not the fancy labels someone slapped on it.
"4/5/6 swing model" , "SBS", "Shithole Model"
Same concepts. Different packaging.
Learn the fundamentals. Master the execution. Keep your money.
Stop paying for rebranded market structure just because someone gave it a catchy name.
18
9
85
32,070
This is exactly why most traders lose money - they don't understand the indicators they're using.
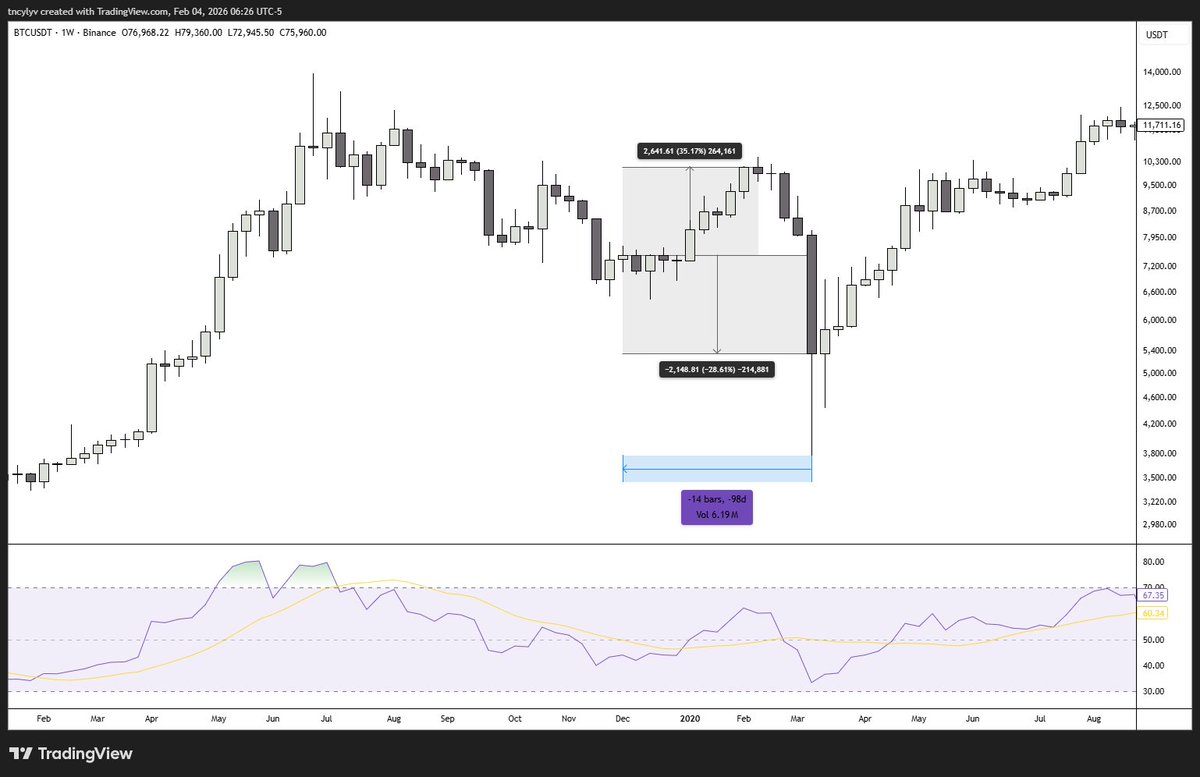
RSI uses the last 14 weekly close prices to calculate the ratio of average gains to average losses. Context is EVERYTHING.
COVID CRASH - Last 14 weeks before RSI low (March 9, 2020):
→ Started at $7,118 → rallied to $10,151 ( 42.6%) → crashed to $5,361
→ 6 up weeks averaging 6.70% gains
→ 7 down weeks averaging -8.35% losses
→ The massive bullish run before the crash inflated the "average gain" component
→ RSI: 33.33
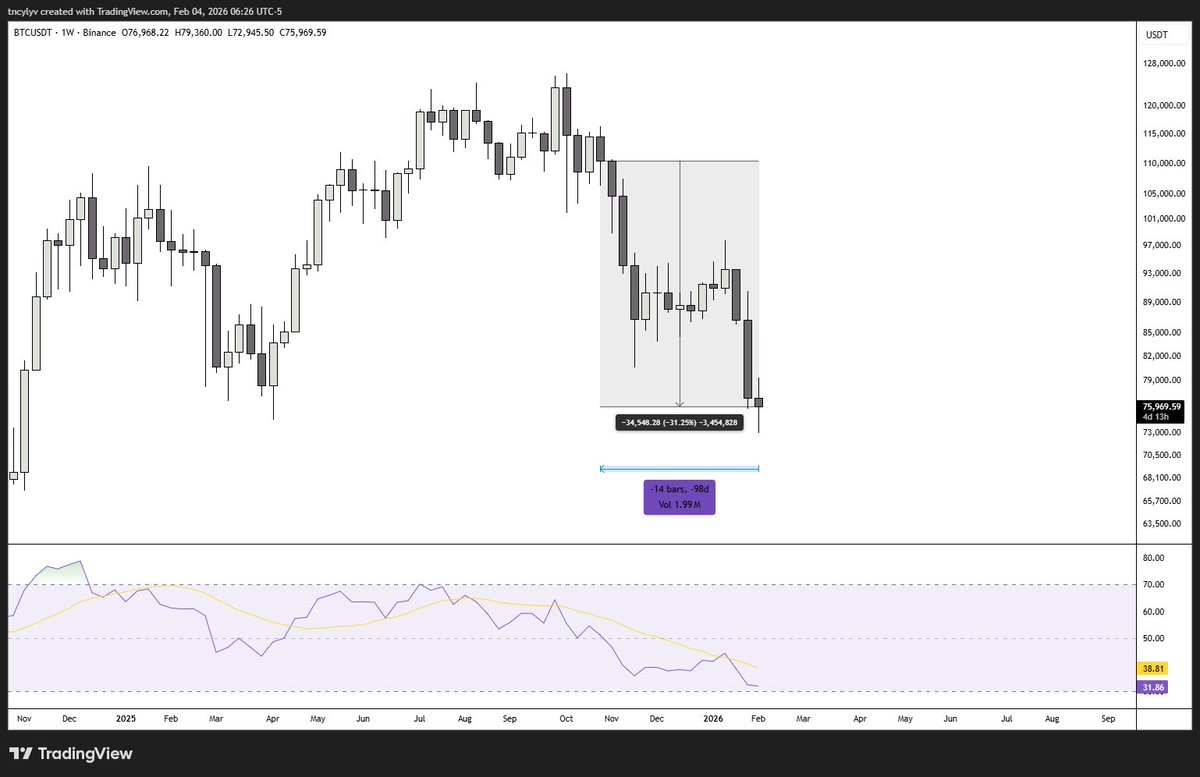
CURRENT - Last 14 weeks (Feb 2, 2026):
→ Started at $104,722 → consistently grinding down to $76,130 (-27.3%)
→ 5 up weeks averaging only 2.33% gains
→ 8 down weeks averaging -5.18% losses
→ No bullish run to inflate RSI - just relentless weekly bleeding
→ RSI: 31.95
The RSI is lower now DESPITE a smaller percentage drop because:
1. COVID had a strong rally mixed in (Dec-Feb) that boosted average gains
2. Current decline is pure consistent downward pressure with weak bounces
3. The "average gain" in the RSI formula is drastically lower now
You're comparing a crash after a rally to a pure relentless grind. Completely different price structures = incomparable RSI readings.
Learn the actual math behind your indicators before making brain-dead comparisons. This is how people blow up accounts thinking "low RSI = automatic bounce."
Stop trading numbers. Start understanding what they actually measure.


3
2
18
4,323
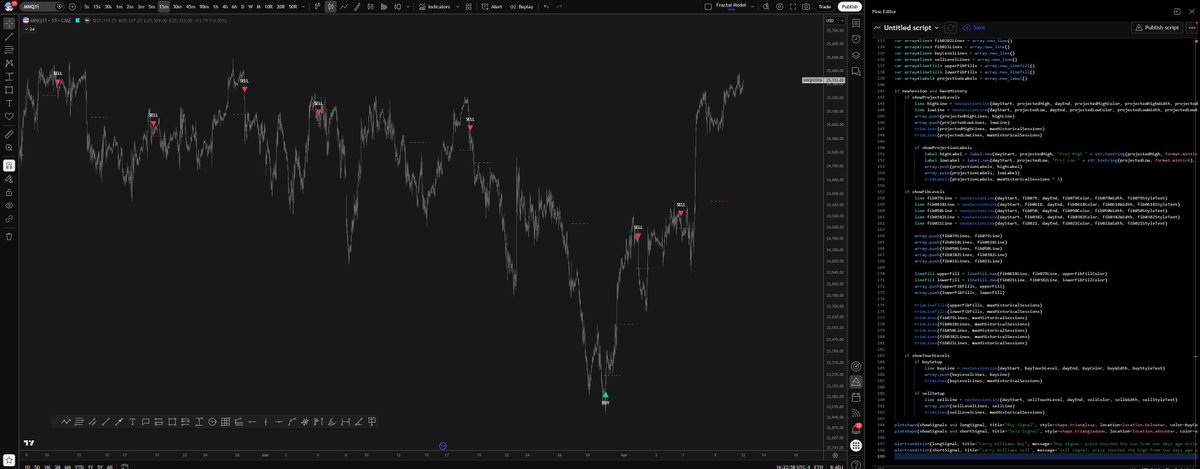
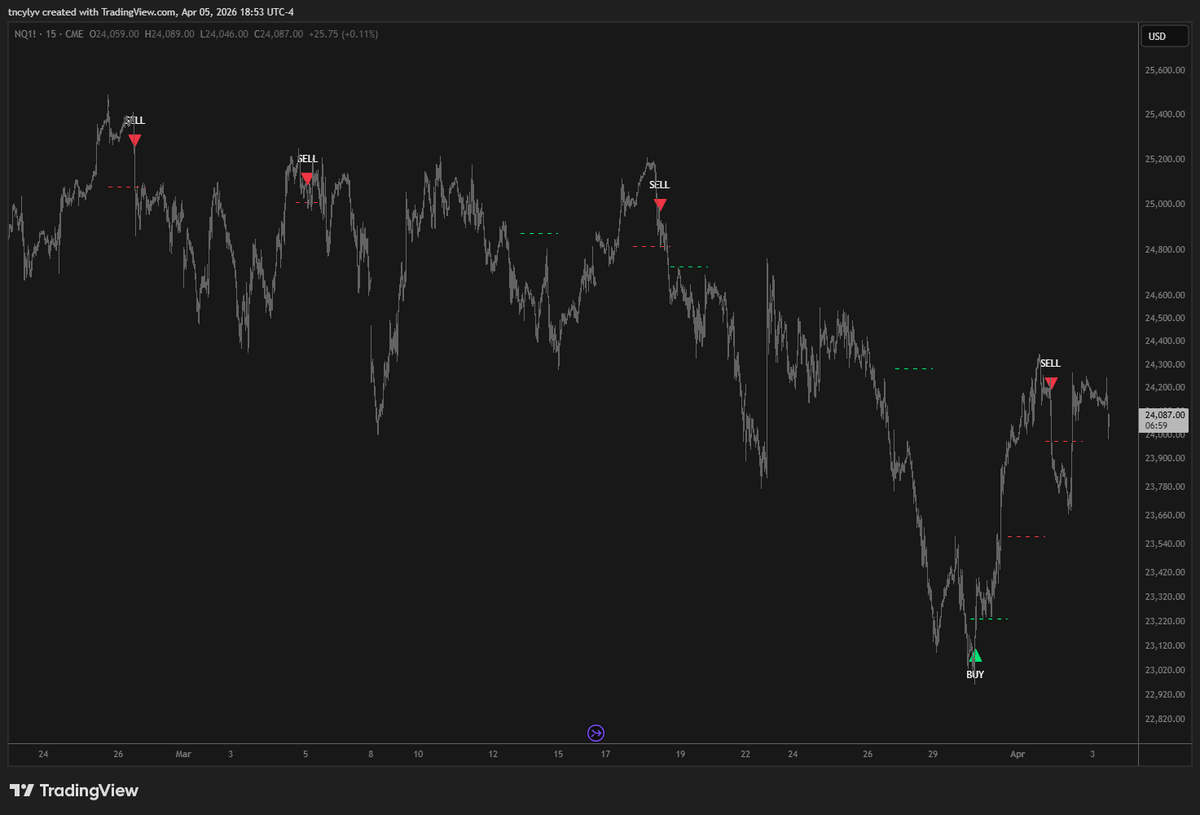
Just published my new indicator: Relative Equal Highs/Lows (REHs/RELs).
This script identifies engineered liquidity structures. These are flat price sequences that often act as magnets for price. It uses standard chart OHLC to ensure accuracy across all chart types and features a unique "Wait & Validate" mechanism to filter out immediate noise.
A note for developers:
I intentionally designed the threshold as a manual input. I personally do not like automatic thresholds as they can be inconsistent. Since the code is open source, you are welcome to modify it and implement your own ATR or percentage-based logic if you prefer dynamic settings.
Get the script here:
tradingview.com/script/oRJbv…
1
1
66
5,837
I liked Eddie’s idea on this. I saw his post when he first shared it and spent a lot of time watching those lunch sessions, then ran my own stats. My analysis covers data from 2016 up to today (excluding holidays), and it doesn’t hit an 80% success rate. It is closer to an average of about 62%, so be careful.

6
1
21
6,595
docs.google.com/spreadsheets… day by day results for 2025.
1
5
2,732
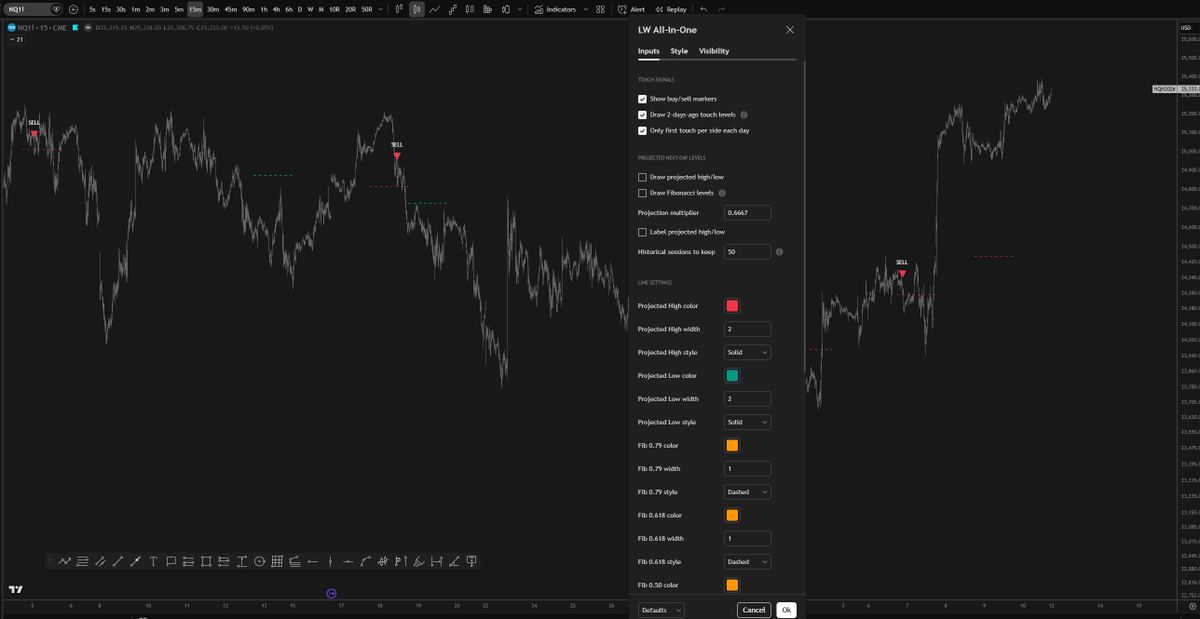
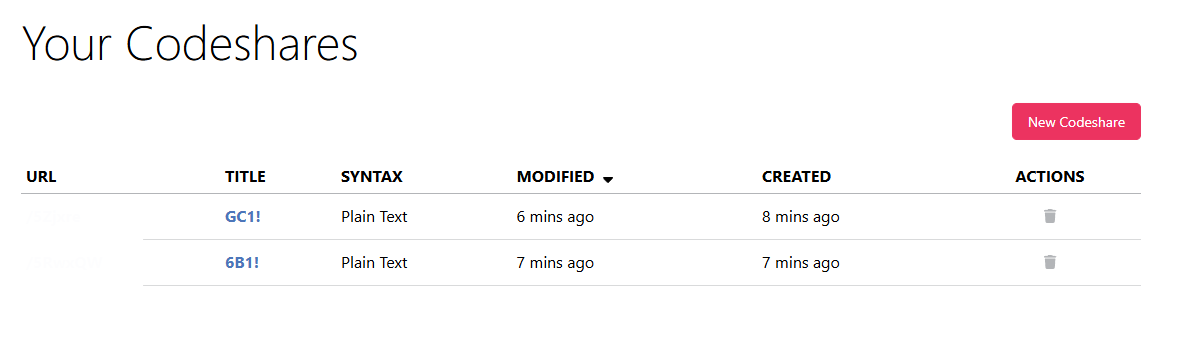
🚨 A lot of people have been asking for these since TradingView removed them.
I’m not going to republish them again. Instead, I’ll send the source code for free.
To get it:
1. Like repost this
2. Reply and tag 3 people
3. DM me “done”
Indicators:
6B1! Manipulation/Distribution Projections (17 years OHLC Stats)
GC1! Manipulation/Distribution Projections (17 years OHLC Stats)
I’ll verify and send it over.

48
46
123
13,380
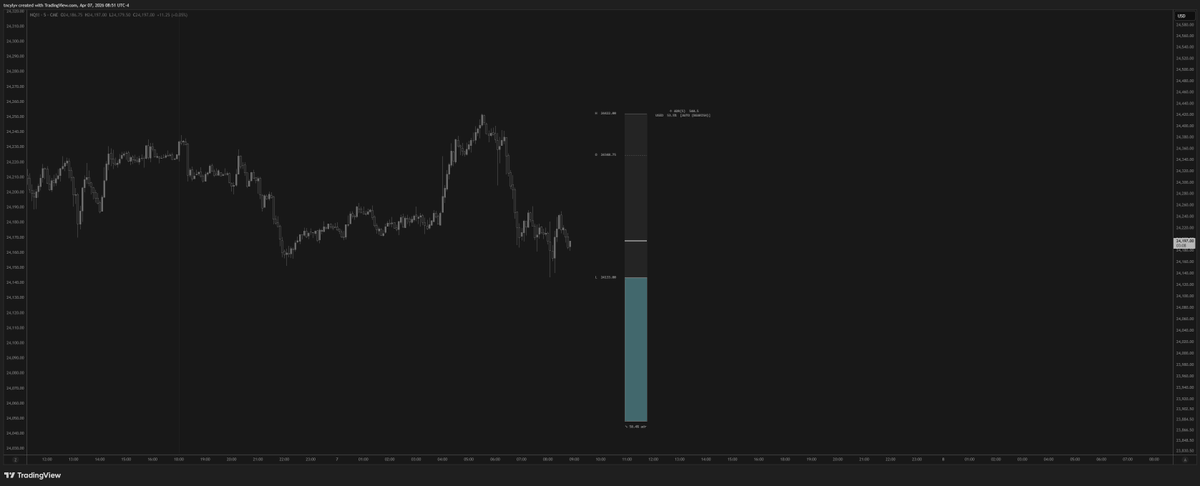
Statistical Observation: Nasdaq(NQ1!) Hourly Range Mean Reversion
I analyzed NQ1! historical price action to measure the probability of price returning to the mid-level of a specific hourly range after a break (sweep) occurs.
Methodology : The study defines a "valid return" as price touching the 50% level of the previous hour's range within a 3-hour window immediately following that hour.
The Outlier 07:00 - 08:00 Range :The data shows a significant statistical anomaly during the 07:00-08:00 window.
Probabilities (Return within 08:00-11:00) :
High Sweep Reversion: 83.2%
Low Sweep Reversion: 82.7%
Average Probability: ~83%
It is an interesting anomaly. You should check this on your own charts to see how price behaves during this specific window.
#DataAnalytics #Quant #NQ #Futures #NQStats
20
11
171
21,304
TradingView removed the original indicator, but I'm bringing it back... OPEN SOURCE! 🔓🔥
Since we are starting from zero again, I really need your help! Please Boost 🔁 and Like ❤️ the script to help get it back on the Top Authors list!
👇 Link below:
tradingview.com/script/m2Z0v…
"Delta Volume Bubble [Quant Z-Score Absorption]" indicator is now live on TradingView!
Highlights extreme volume deltas with stats & absorption detection for spotting traps/reversals. Link: tradingview.com/script/BK0gE…
Disclaimer: Do not use this indicator in backtest mode, as it will not provide useful results due to its reliance on real-time lower-timeframe data aggregation. TradingView has a bar limit, and since we are processing data from a lower timeframe, historical data will be limited—it's best suited for analyzing the past 24 hours. For optimal accuracy, set the Lower TF Granularity to "1S" (1 second), and use it on chart timeframes of 1 minute or less to capture granular volume delta
9
26
192
16,325