
Professor of Economics, University of Rhode Island
Joined July 2010
- Tweets 1,036
- Following 273
- Followers 1,475
- Likes 238
288 Photos and videos


Jun 15
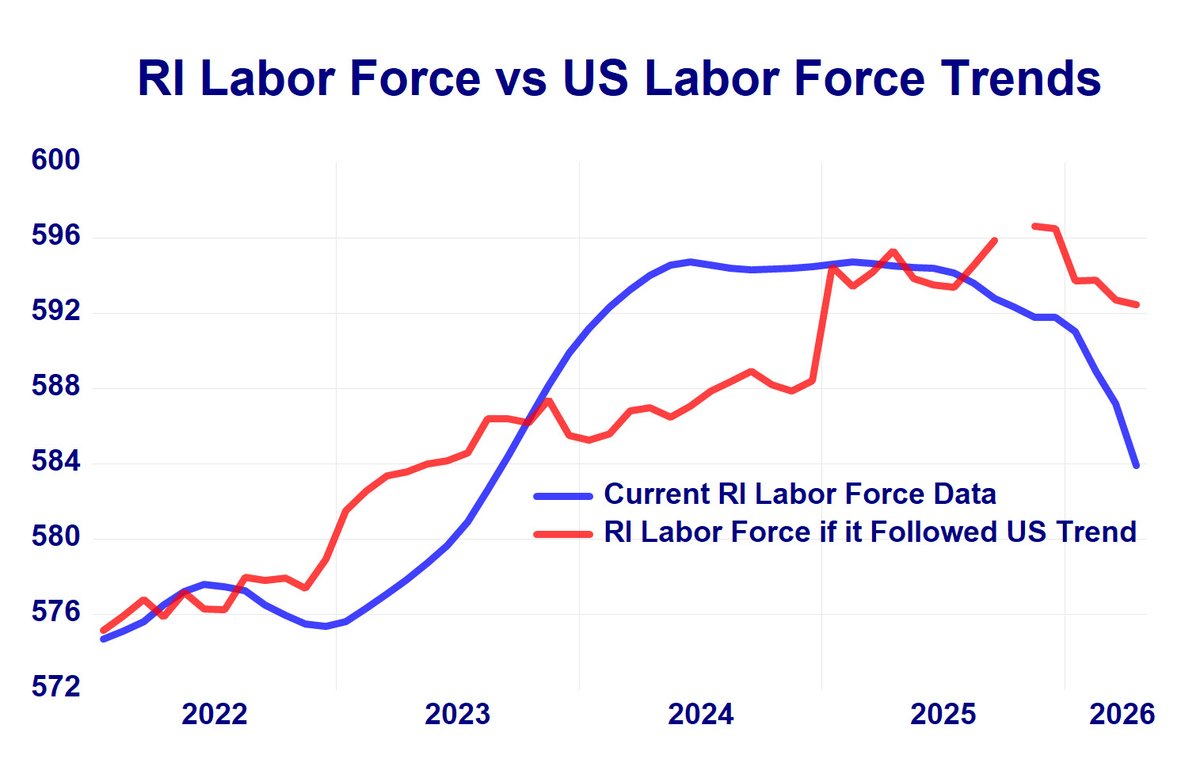
I have been very skeptical of the official household survey labor data for RI. The recent sharp declines have no obvious cause. What if RI's labor data followed the same or similar path as that of the US? Much less decline, which I suspect revised data will eventually show.
104
May 22
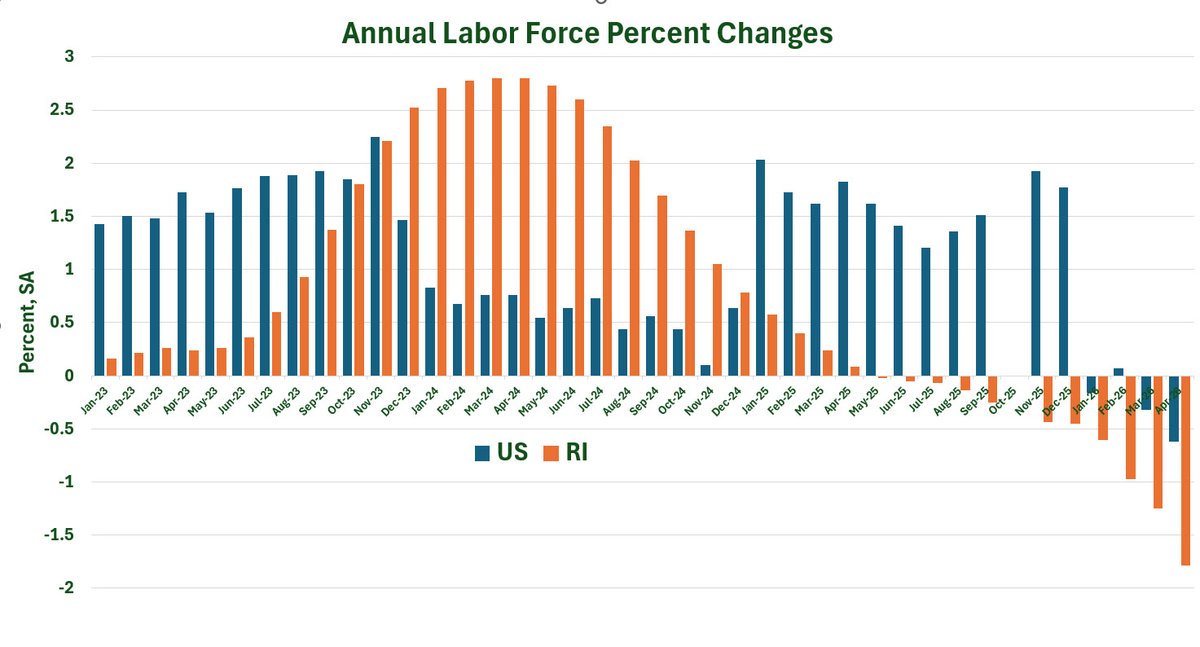
I don't believe RI's labor force is falling off the earth, despite the recent numbers. Look at the chart: We grew much faster than the US throughout 2023. I believe the negatives now are "makeup," which will ultimately lead to a statistically right-sized data series for RI.
4
1
5
251
May 22
Yesterday, I showed RI's bad April household survey data. As expected, the RI media just reported the new (totally meaningless) jobless rate, absent context. The participation-adjusted unemployment rate I calculate each month jumped to 7.3% in April, versus 4.6% officially.
3
7
16
2,175
May 21
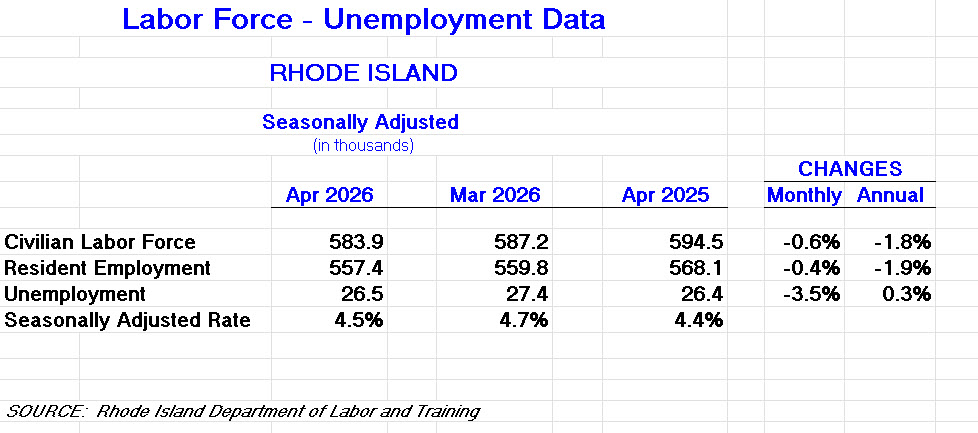
If you want to see how bad the RI April household survey data is, this table shows percent changes. Wow!
1
2
4
562
May 21
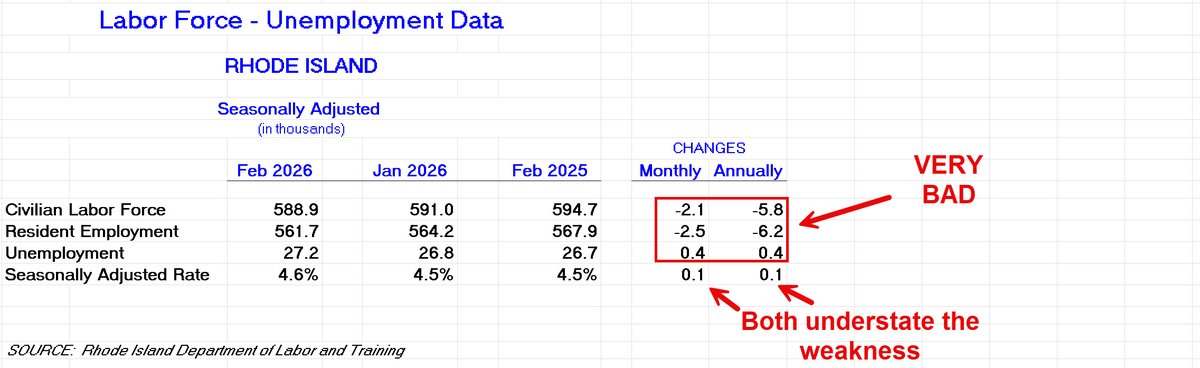
RI's unemployment rate rose from 4.4% last April to 4.5% this April. Sound good, right? But this occurred as resident employment plunged by 10,700, with an almost identical drop in the labor force. Too bad the media in this state is so oblivious to what is "under the hood."
1
7
12
425
May 21
I didn't think RI's household survey data could get worse after last month. But, it did, bigtime! Huge drops in our labor force and resident employment, monthly and annually. Our "official" unemployment rate of 4.5% is totally meaningless (the media won't realize this).
2
18
33
2,080
May 11
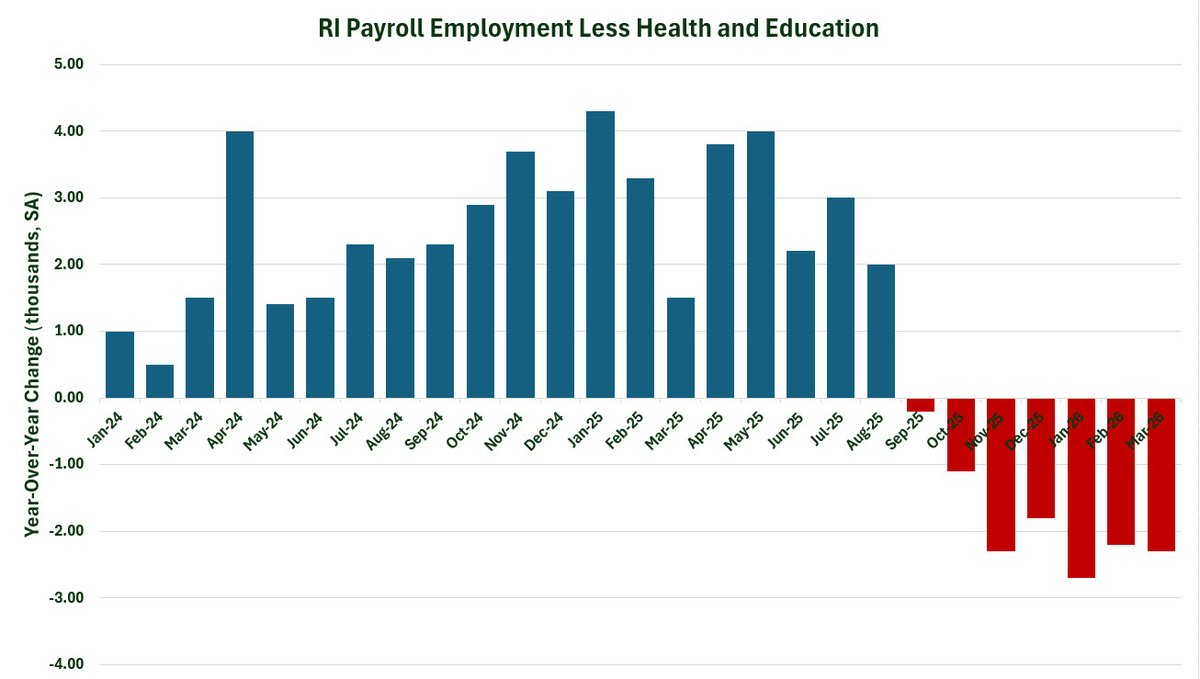
Like the nation, RI employment in health and education is having a major impact on employment change. For March, RI payroll employment (yearly) fell 1,300. If we take out education and health, the decline was actually 3,600.
1
3
11
734
Apr 30
In light of the horrific household survey data in RI for March, the participation-adjusted unemployment rate I calculate rose from 6.1% in February to 6.9% in March. Ouch! I'm sure our state's media will cling to the official March rate of 4.7%, which is largely meaningless.
6
19
52
4,590
Apr 30
The March household survey labor data for RI weren't just bad, they were horrific! Large declines in both monthly and annual labor force and resident employment mean the "official" unemployment rate greatly understates actual joblessness.
1
11
20
752
Apr 21
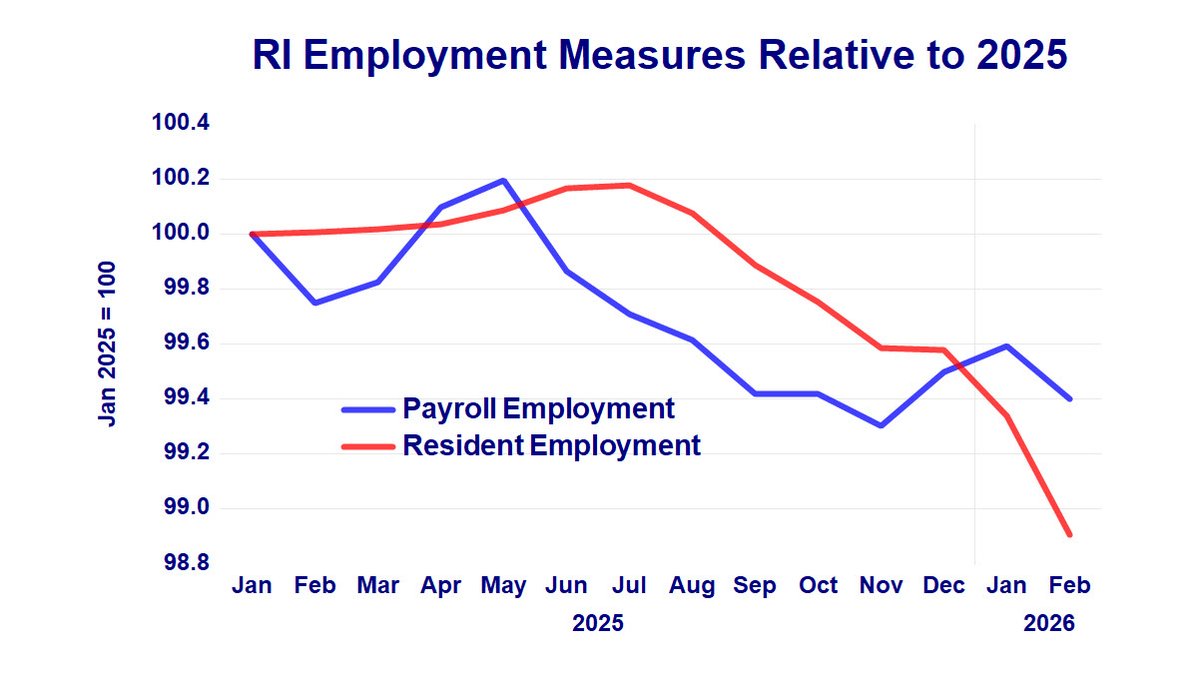
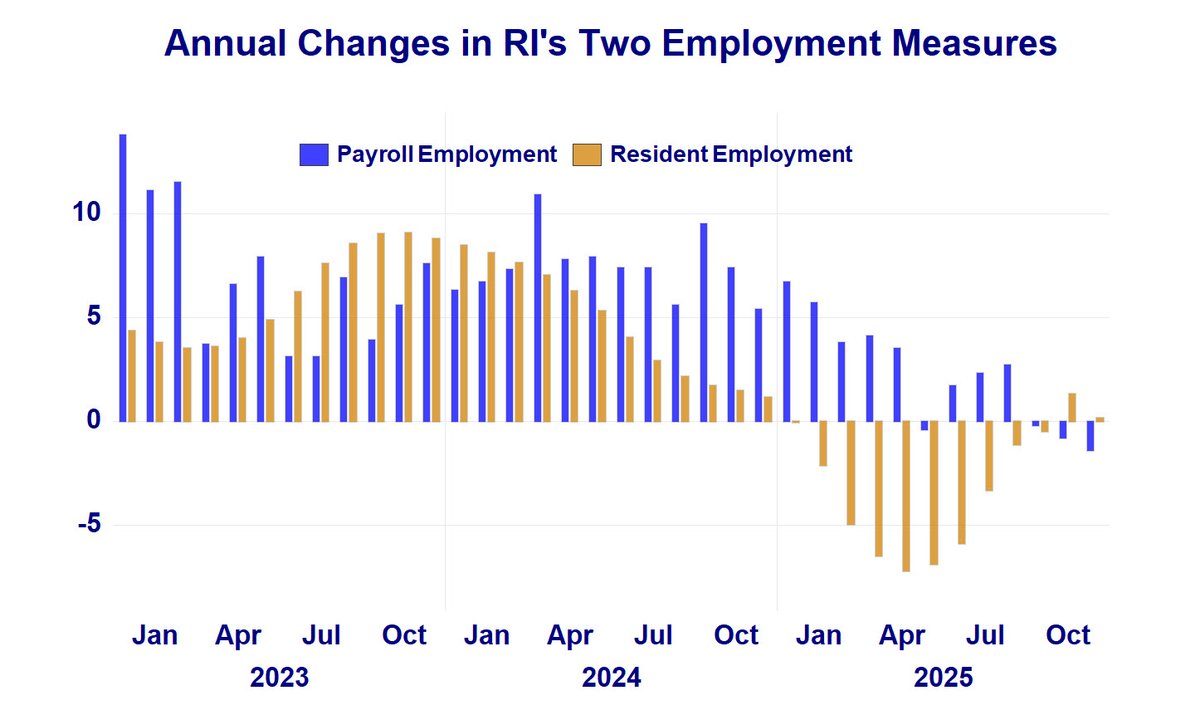
Last year, I was waiting for the two RI labor market measures to converge. Since then, they have, but I should be careful what I wish for.
1
1
3
294
Apr 21
Last year, I was waiting for the two RI labor market measures to converge. Since then, it has happened, but as the chart shows, I should be careful what I wish for.
1
6
1,623
Apr 16
Bad news concerning RI's labor market. February Household Survey data show falling labor force and resident employment and higher number of unemployed -- all both monthly and yearly. Result: the rise in the official unemployment rate is understated.
1
8
15
1,976
Apr 9
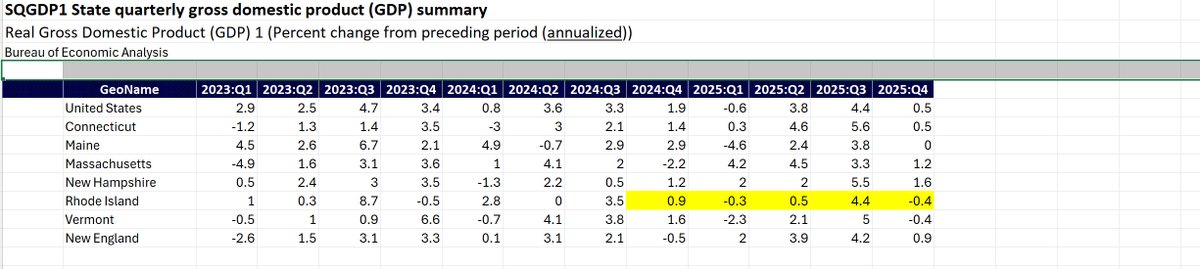
Data on state growth rates were just released. The RI results are consistent with my Current Conditions Index readings over the last five quarters. The 2025Q3 blip likely results from base effects. Sadly, RI clearly underperformed for these quarters.
1
3
256
Apr 8
6/ Where does all of this leave us? While the levels of these variables are generally higher and more favorable, it is their rates of change (year-over-year) that define momentum, and on that front, things aren't terribly different overall.
3
132
Apr 8
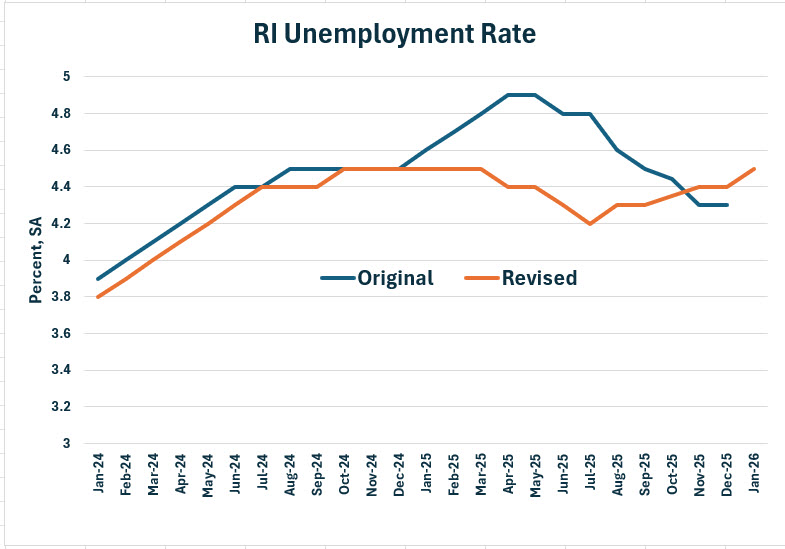
5/ Finally, the unemployment rate. Given a higher labor force and resident employment through much of 2025, the revised jobless rate is lower for almost all of last year. But in July 2025, unlike the old data, the unemployment rate continued to rise.
3
119
Apr 8
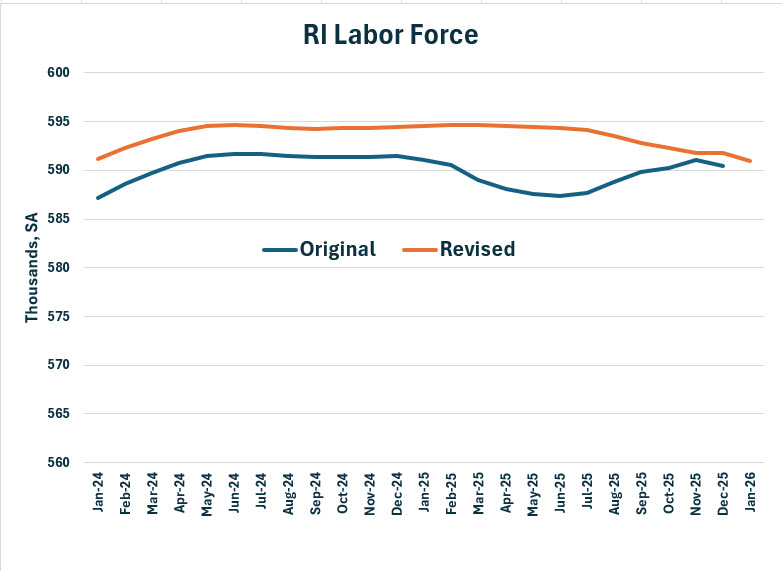
4/ RI's labor force was higher throughout the 2024-25 period, tapering off after June of 2025, approaching the original value at year's end. The 2025 averages: Original data 589.3, revised data 593.6. Very encouraging as for level, not for recent declines.
2
92
Apr 8
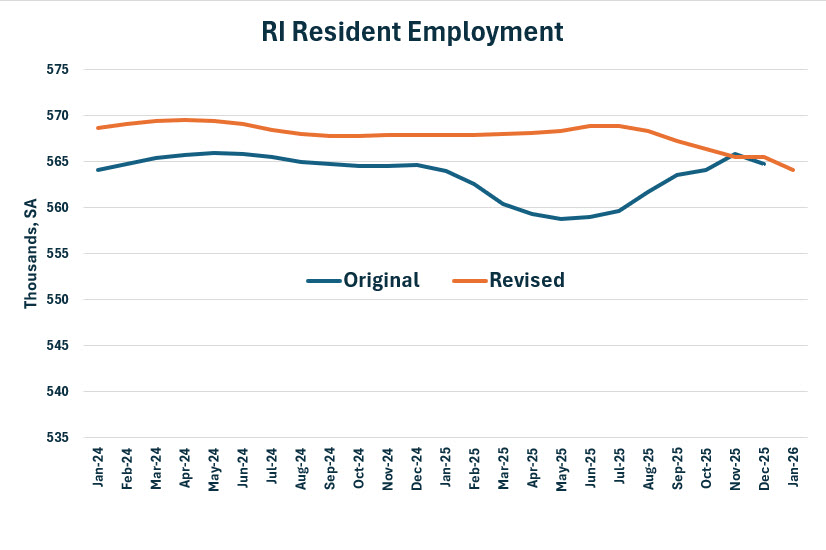
3/ Resident employment was higher throughout most of the 2024-25 period, but instead of rising in the original data, it actually fell as the year came to a close, converging to the original data value. The 2025 averages: Original data 562.0, revised data 567.6 - big improvement!
2
89
Apr 8
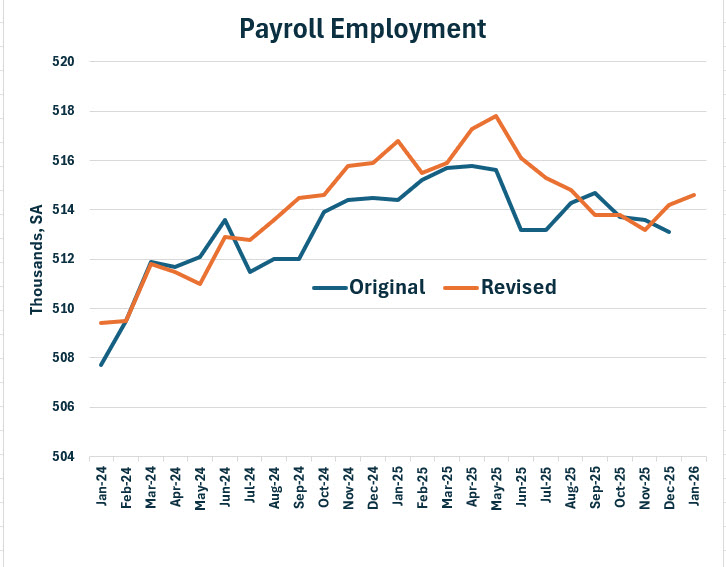
2/ Payroll employment weakened after May 2025 but spiked higher in January of 2026. The 2025 averages: Original data 514.4; Revised data 515.4.
2
90
Apr 8
1/ A quick look at the revised (rebenchmarked) labor market data for RI. The good news is that we weren't savaged this year, as was the case the past few years. Interesting patterns, as 2025 values were better for most of the year before a few variables tailing off by year's end.
2
103
Mar 30
At the grocery store, I saw something for the first time: Buy 3 soda sleeves, get 3 free. Great tactic! If each sleeve is $11 then (=33/6), this is the same price/sleeve as buy 2 get 2 (=22/4), but people will probably never figure that out. Volume to manage fixed costs.
1
6
234