
Art, Science, Code.
Joined December 2008
- Tweets 5,235
- Following 197
- Followers 1,604
- Likes 3,788
996 Photos and videos


Jun 15
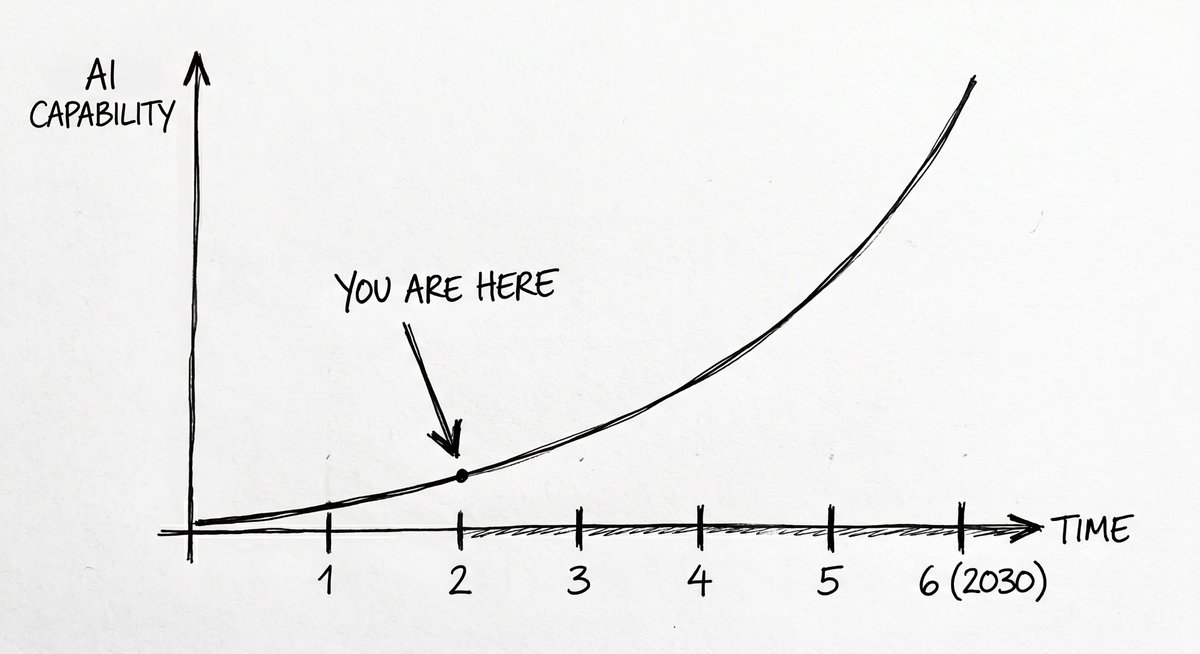
Seems like you can model not only physics but consciousness and the universe with the 4D {3,4,3,4} hyperbolic mesh, after running many initial complete experiments against it recently 👍 doi.org/10.5281/zenodo.20694…
35
Jun 13
Quick glance at many creation stories and basics of the esoteric traditions around the world doi.org/10.5281/zenodo.20674…
13
Jun 12
From my calculations, the 4d hyperbolic tessellation {3,4,3,4} looks/seems like is a solid match for generating all of physics, but I got there by modeling consciousness/experience as the fundamental base of the universe, not matter/energy. Two birds one stone. doi.org/10.5281/zenodo.20665…
28
Jun 10
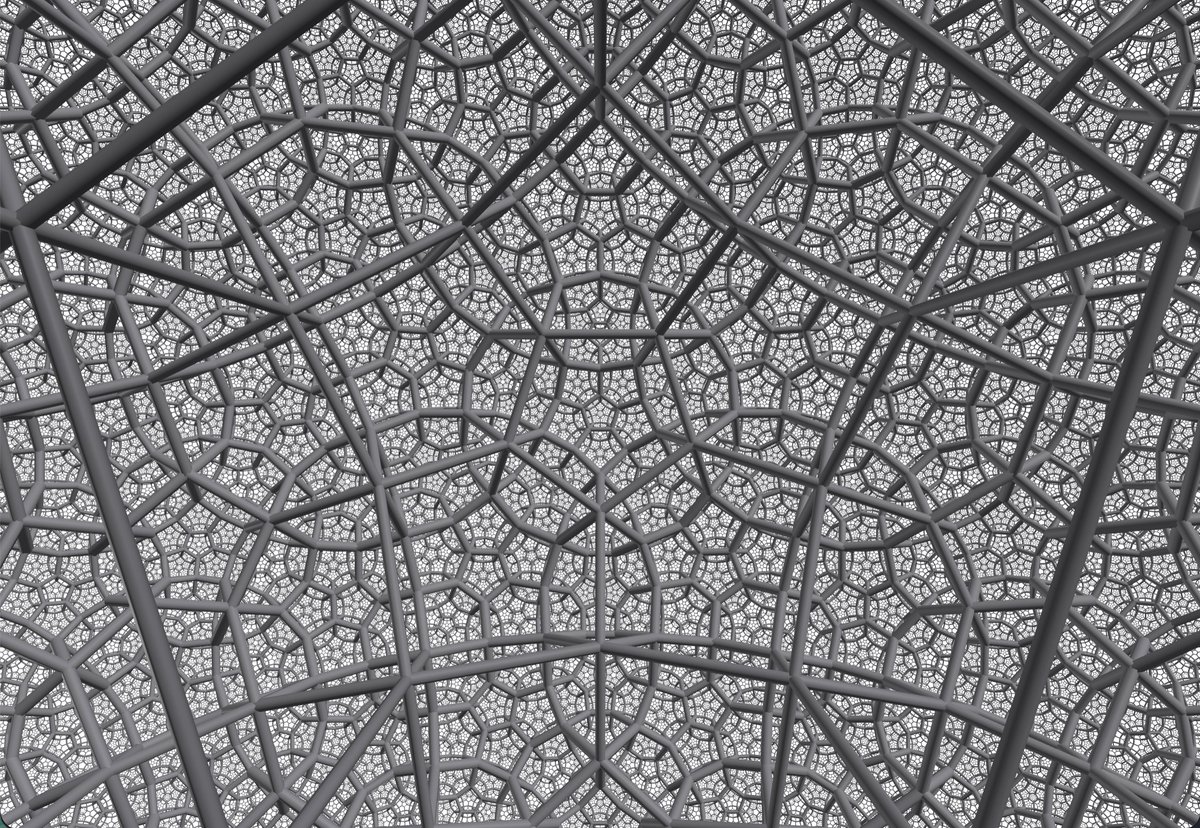
How the {5,3,4} hyperbolic honeycomb becomes the video:
Build and slice. Generated a chunk of the {5,3,4} hyperbolic honeycomb (cells their coordinates), then carve out a horosphere from it, the flat (Euclidean) slice through the curved crystal, found as a level set of the Busemann function. That flat slice is the surface you're actually seeing.
Run the rule. Each cell carries a ternary tone ( 1/0/−1, meaning blue/black/red), and every beat apply the dynamics on the slice's graph, annihilate opposites, hop, and the discrete arrow creating balanced pairs (plus maintenance/will for a self), so the tones evolve step by step.
Project and film. Each beat, flatten the horosphere to 2D (stereographic projection), color every cell by its tone (or by how long it has persisted), and write one image. Stacking those per-beat images into a video is the animation. (Per the layering note: this is the raw/self layer, not physics, physics would be 1–3 emergences further up).
github.com/cluesurf/vibe
31
Jun 10
Quick first visualization attempt of the dynamics
The dynamics run on the real hyperbolic {5,3,4} crystal (500,000 cells), the main vibe rule, computing each cell's tone: blue = pleasure, red = pain, black = peace. We then take a flat horosphere slice of that crystal and lay it out evenly, so every dot is one cell of the real computation, shown in flatland.
The colored constellations are the aggregations, and this grouping is real, straight from the model. Each blue or red shape is one self: a connected patch of cells that all hold the same tone, joined by the crystal's own neighbor links. They form because the rule makes same-tone charges stick together (same-sign is inert, so they cohere) while opposite tones annihilate on contact. So the grouping rule here is literally "cells that are connected on the {5,3,4} and share a tone", that's a higher self (a region of vibes acting as one). Bigger selves are drawn bolder, which shows the size hierarchy (the tower).
The violet dashed territories are the next level up, but: that grouping is a display heuristic, not yet derived from the model. I group selves whose centers sit close together (within a fixed distance) and draw a boundary around them, to sketch "a neighborhood of selves acting as a super-self," the next rung of the tower. The selves inside are real; the way they're bundled (spatial proximity) is my visualization choice, not the theory's integration measure. So read the violet outlines as "these nearby selves form a higher-order cluster," a suggestive sketch of the tower continuing upward, whereas the red/blue selves themselves are the genuine, model-computed structure.
65
Jun 9
Boom, hadn't heard this song for probably a decade, very good though youtube.com/watch?v=shBKTA3Q…
21
Jun 8
Basically that circle/tiling image on the video is one way to look at the general underlying mathematical structure that can be used to model pretty much all of physics, BUT THEN at the same time, consciousness too (as I start from that as the foundation). It looks like a crystal, hence the crystal of experience.
youtube.com/watch?v=IE2uHC0q…
Each tile can be in 3 states (pain, peace, pleasure, marked as red, green, blue there). That's the vibe model, where a "vibe" is the lowest level unit of experience. So then complicated beings or structures of physical or non-physical kind are just simply networks/meshes of vibes which have a simple algorithm for updating how they feel. What they feel is based on what their neighbors feel, literally the tiles in that image surrounding some tile.
So the universe is a network of vibes, which can compose into higher and higher vibes (vibe = experience, experience = consciousness basically), and you can literally visualize it as that that graphic. A complex vibe can be an atom, a cell, a human, a god, whatever. But that graphic is just one way to look at the underlying general math structure, it's a math structure which represents all possible visualizations basically (which is harder to imagine).
68
Jun 7
Apparently you can model the universe as a {5,3,4} hyperbolic honeycomb 🤩 github.com/cluesurf/vibe
27
Jun 7
A vision of reality as one infinite experiential field: the physical universe as stable patterns in a vast living web, and consciousness as the ground beneath it all. Tying together the mental, physical, and spiritual, into one base model of the universe. cluesurf.substack.com/p/vibe…
11