The open-access home for research applying omics technologies to microbial systems from ASM journals. Submissions now open msystems.msubmit.net
- Tweets 3,278
- Following 1,521
- Followers 2,078
- Likes 1,670


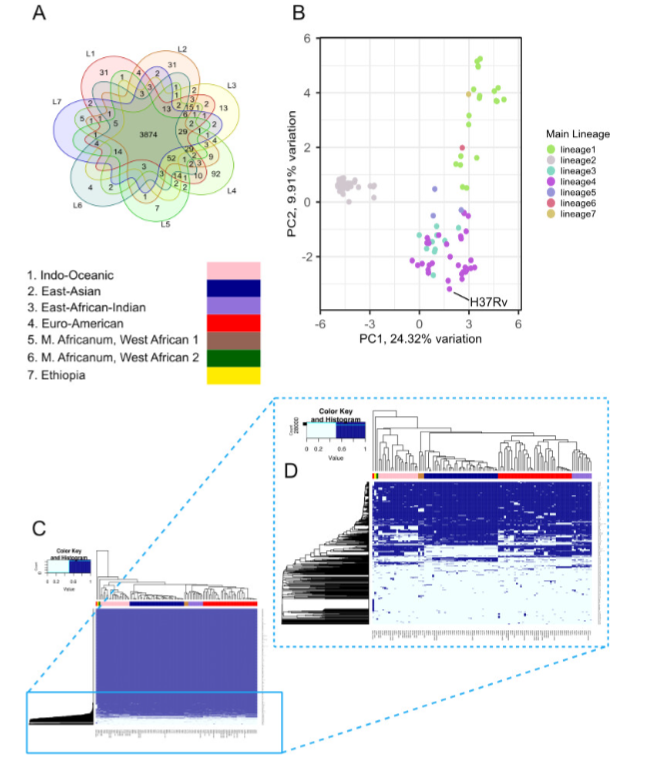
ALT Distribution of genes shared by lineage in the pangenome. (A) Diagram showing both the number of genes shared and unique to the lineages in the study sample (N = 110 isolates). Lineage-specific pangenome gene lists represent genes that are found in at least one isolate in the lineage. (B) Bi-plot of first two principal components, based on the presence/absence of genes in the pangenome, shown by lineage. The location of H37Rv on the bi-plot is indicated by the black line. (C) Heat map of full pangenome annotated by lineage. As most of the genes are conserved by all isolates in the pangenome, the distribution of genes in the accessory genome (D) is displayed in the outlet.


ALT Distribution of genes shared by lineage in the pangenome. (A) Diagram showing both the number of genes shared and unique to the lineages in the study sample (N = 110 isolates). Lineage-specific pangenome gene lists represent genes that are found in at least one isolate in the lineage. (B) Bi-plot of first two principal components, based on the presence/absence of genes in the pangenome, shown by lineage. The location of H37Rv on the bi-plot is indicated by the black line. (C) Heat map of full pangenome annotated by lineage. As most of the genes are conserved by all isolates in the pangenome, the distribution of genes in the accessory genome (D) is displayed in the outlet.


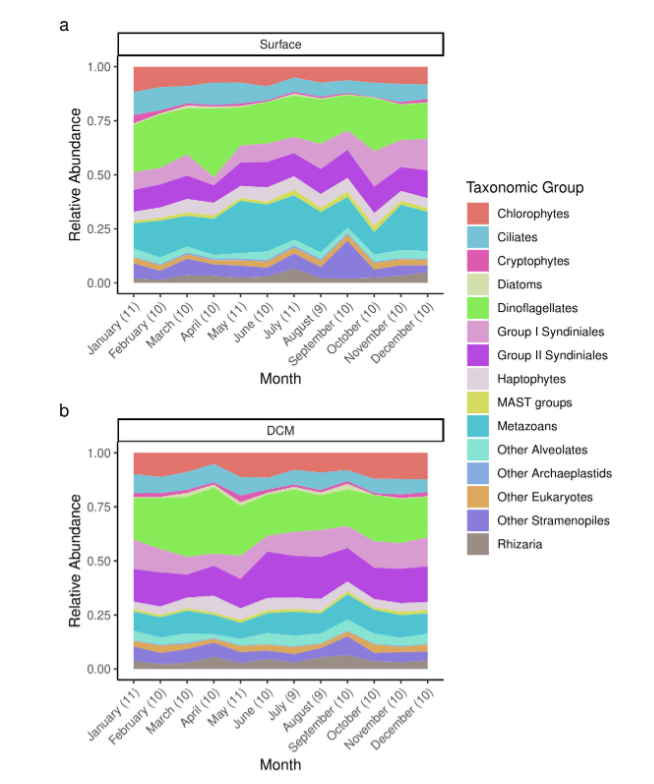
ALT Major taxonomic groups comprising the protistan communities observed each month at the SPOT station from 2003 to 2018. The taxonomic groups were manually curated.


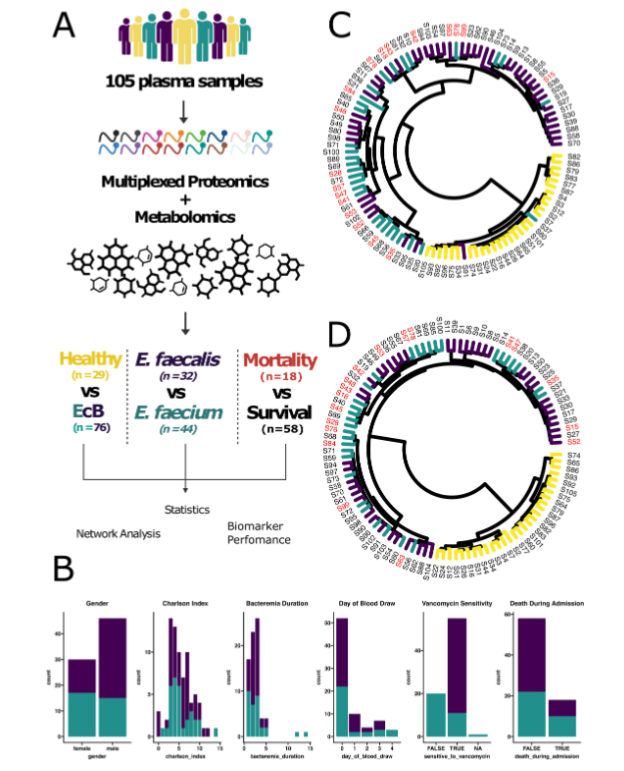
ALT Multi-omic analysis of enterococcal bacteremia patient plasma. (A) Workflow for enterococcal bacteremia plasma analysis. (B) Distribution of values collected from selected clinical metadata fields across enterococcal bacteremia patients. (C) Unsupervised hierarchical clustering of proteomics data as visualized after calculating Euclidean distance and utilizing the Ward.D2 agglomeration method. Col
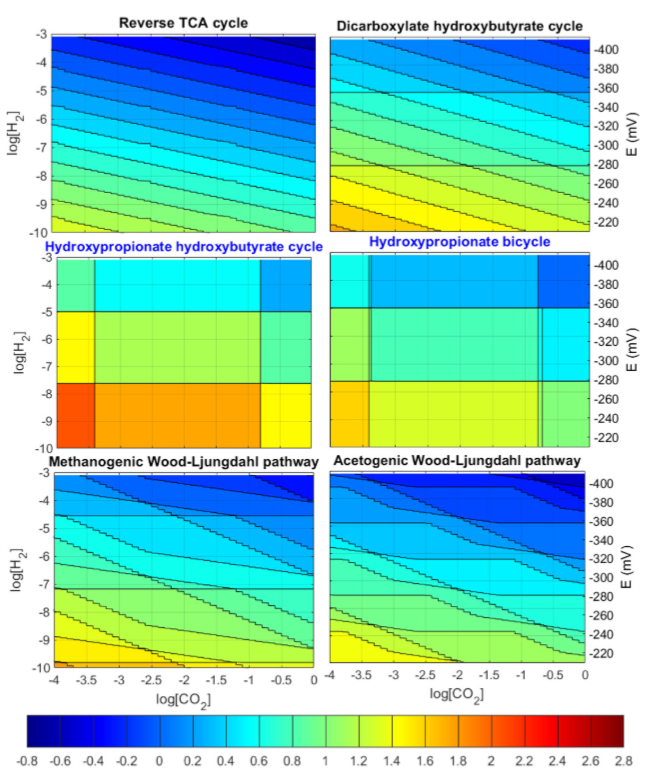
ALT Contour plot of ATP cost for carbon fixation in molATP/molCO2 for each of the six major microbial pathways with no minimum driving force imposed. The right y-axis indicates an equivalent electron donor reduction potential to the hydrogen concentration. Negative ATP cost values indicate that net ATP is produced. The middle two pathways in blue font are aerobic, all other anaerobic.