
Joined April 2019
- Tweets 2,491
- Following 179
- Followers 8,040
- Likes 2,444
119 Photos and videos


Pinned Tweet

8 Sep 2020
A Thread - a guideline doc for memory performance analysis for #dotnet #dotnetcore
For the past few weekends I've been working on a (long) document that aims to help you with finding efficient approaches to mem perf problems.
github.com/Maoni0/mem-doc/bl…
15
185
479
24 Sep 2025
hi folks! it’s been quite a while since I had time to write a blog post. with the upcoming .NET 10 release, I’m finally sharing more details on DATAS and tuning tips you might find useful. check it out here:
maoni0.medium.com/preparing-…
3
31
107
20,855
15 Feb 2024
recently we worked with a team that specified only the provider name in dotnet-trace without keywords/level. dotnet-trace will include ALL keywords on VERBOSE level. this can easily degrade perf. DotNETRuntime provider will also induce GCs (due to the GCHeapCollect keyword).
2
2
14
4,541
15 Feb 2024
I've requested the diagnostics folks to the change the default: github.com/dotnet/diagnostic…. note that this means no keywords enabled on informational level.
1
5
2,346
15 Feb 2024
so really you should specify the keyword/level🙂 or use one of the built-in profiles
3
1,621
12 Feb 2024
profiling tip - if you upgrade to a newer version of a product and observe perf regression, make sure to grab some perf traces before you revert (if you revert all usage and can't easily get traces later). without comparative traces the investigation will be much harder
3
13
3,222
12 Feb 2024
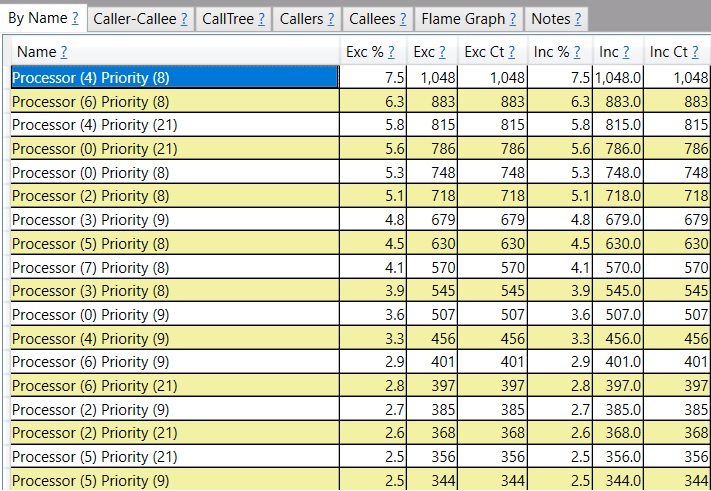
if you use PerfView, have you noticed the GCTriggeredStacks cmd arg? to see callstacks for induced GCs, use this lightweight commandline -
PerfView /GCCollectOnly /GCTriggeredStacks /nogui collect
(this is less verbose than what mem-doc currently shows)
2
7
45
9,244
6 Feb 2024
if I could only give one piece of advice to folks who need to do memory perf analysis, it would be to learn to use traces. tracing has existed for multiple decades and I still come across folks who need to do memory analysis and never use it. it really is a loss on productivity.
1
8
40
5,845
20 Nov 2023
very cool visualization tool to show case GC activities -
19 Nov 2023

In preparation for my talk at @update_conf, I've prepared a tool to visualize the activity of the GC. It was initially meant as a gimmick, but it turns out to be a good way to understand some GC mechanisms.
For instance, here you can see the effect of DOTNET_GCDynamicAdaptationMode=1 on the lower side, dynamically scaling up the number of heaps to absorb a spike of traffic, then scaling back down. The top application is running with default settings. Both are receiving the same traffic.
#dotnet #progc2
1
3
36
10,087
24 Aug 2023
what's new in the .NET 8.0 GC? we focused on solving the Server GC problem where it keeps too much memory around. the new DATAS feature aims to keep the memory usage much more in line with what your app requires. maoni0.medium.com/dynamicall…
7
79
287
64,264
12 May 2023
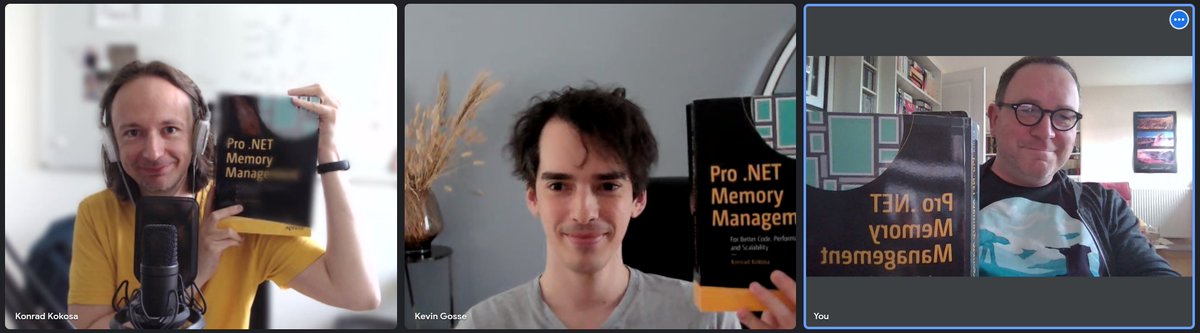
2nd edition of the Pro .NET Memory Management book is coming🙂
12 May 2023

I am thrilled to announce that we've begun work on the Second Edition of Pro .NET Memory Management, with the awesome @chnasarre and @KooKiz as co-authors!
Let's upgrade those 1000 pages about memory for .NET 7 and beyond, all under the watchful eye of reviewer @maoni0 👀
1
7
84
15,489
22 Mar 2023
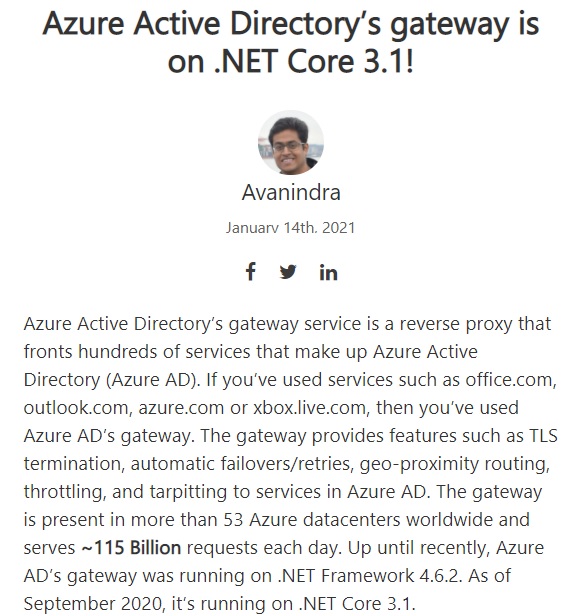
@benmwatson, one of the perf engineers on the Bing backend team, just published a blog post about the perf improvements they've observed as they upgraded to .net 6/7
devblogs.microsoft.com/dotne…
1
5
23
4,231
22 Mar 2023
"in testing we saw about a 24% average improvement in the amount of time the process spends in GC (which isn’t much to start with). In production, it was even better, closer to 30%."
1
3
1,638
22 Mar 2023
it was awesome to test GC changes directly on machines that took forked production traffic (they don't affect production but we can see real effect of GC changes)
5
1,470
20 Mar 2023
making .net better on AWS! great experience working with @socketnorm on this.
20 Mar 2023

Here is my new blog post about some interesting details about the .NET Garbage Collector and AWS ECS and Lambda. If you are having any memory issues with .NET and these services definitely check it out.
Thanks to @maoni0 for collaborating on this post.
aws.amazon.com/blogs/develop…
3
28
7,217
23 Feb 2023
I literally just wrote 3 emails to 3 different teams to ask them to capture a top level GC trace to understand their memory behavior in general. 99.9% of the time this is the BEST way to start a memory investigation. github.com/Maoni0/mem-doc/bl…
5
34
4,037
23 Jan 2023
I don't know how gas leaf blowers are still a thing - they should be banned from everywhere. if you live in Kirkland, WA, would you consider signing this?
Ban Nasty Gas-Powered Leaf Blowers in Kirkland - Sign the Petition! chng.it/7MTMcwWr via @Change
1
10
11,299
19 Jan 2023
a new API GC.GetTotalPauseDuration is available in .NET 7 learn.microsoft.com/en-us/do…. it gives you the total amount of time paused in GC since the beginning of the process. should be a good aid in your performance monitoring.
6
27
107
14,350
18 Jan 2023
I added a FAQ section to mem-doc github.com/Maoni0/mem-doc/bl… that includes the following so far -
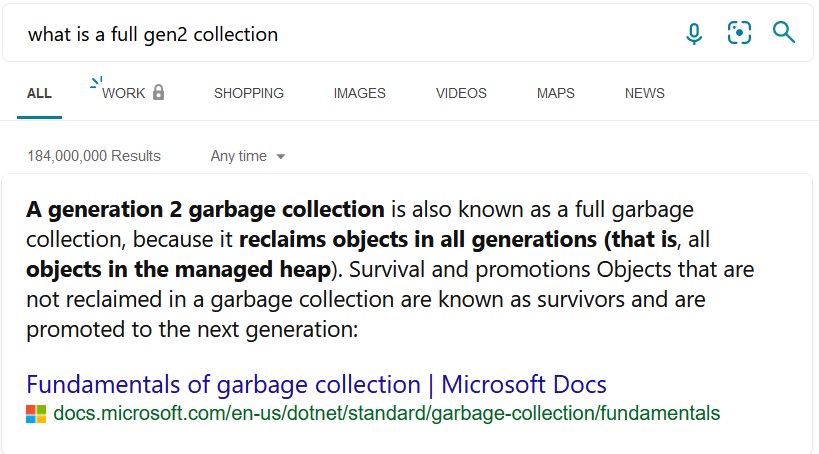
◼️I didn't change my code at all, why am I seeing a regression in memory when I upgrade my .NET version?
◼️Why isn't the GC collecting these objects? They should be collected!
8 Sep 2020

A Thread - a guideline doc for memory performance analysis for #dotnet #dotnetcore
For the past few weekends I've been working on a (long) document that aims to help you with finding efficient approaches to mem perf problems.
github.com/Maoni0/mem-doc/bl…
3
16
36
11,164
18 Jan 2023
◼️Why do I need to care about the OS differences at all?.NET is cross-plat so it should take care of that for me!
◼️We are collecting the % time in GC counter and it's telling us it's 99%.How do we fix our perf problem?
◼️What's the most efficient way for me to get help from you?
2
6
1,514
23 Dec 2022
over the holidays I read "Every Patient Tells a Story" by Lisa Sanders (technical advisor to the House show). it's about how doctors solve hard to diagnose medical problems. an interesting read,I also see a lot of similarities with how SW engineers do diag. a couple of examples -
2
7
50
20,638
23 Dec 2022
it has been pointed out to me (a reason that I had not considered myself) another reason is because they "don't want to look stupid to their teammates" and that's more common with junior folks. you'd be doing yourself a disservice by doing that, especially if you are junior.
1
10
2,193
23 Dec 2022
in any case, if you are looking for a non software book to read, I recommend it 😀
1
6
1,972