
Consultant, speaker, book writer, mentor. Business Intelligence with Power BI, Analysis Services, and Power Pivot. Other info on sqlbi.com
Joined September 2009
- Tweets 13,181
- Following 480
- Followers 26,241
- Likes 11,715
879 Photos and videos


Pinned Tweet

26 Jun 2023
After years in “stealth mode,” we’re excited to introduce DAX Optimizer.
Dive deeper here: daxoptimizer.com/blog/introd…
DAX Optimizer is a tool – delivered as a service – that helps identify potential bottlenecks and suggests impactful solutions and priorities. You still write the code, but it is like you have a mentor on the side teaching you best practices, focusing on the most impactful area of your measures.
Spend your time where it matters, getting immediate improvements. For example, you may have 200 measures, many of which have similar coding practice issues: Where to start? DAX Optimizer guides you to the more important measures, which could be the ones that are more frequently used by other measures and not necessarily those that directly appear on any report.
Now that we are out of stealth mode, we have much to say: how it works, how it preserves sensitive data, how it works for teams and individual developers, and share the plans to improve it over time. We will do that in the coming weeks.
Where are we now? Our beta program is live, initial users are onboarded, and the waitlist is growing. We’re gradually rolling out invitation codes in the coming weeks. The service is functional, the UI for a single developer is polished, and the documentation is shaping up.
While we work towards our public release, we’ll be actively seeking your feedback to refine DAX Optimizer. We won’t be rolling out a major marketing campaign yet, as we’re committed to perfecting the tool. Do not expect videos or articles from us until public release.
That said, beta participants are welcome to share their experiences, as we do not require any NDA. Articles, videos, with the good and the bad – all are fair game. We believe in transparency!
Join us in shaping the future of coding with DAX Optimizer. Your code, optimized.
daxoptimizer.com/

19
91
363
47,874
Jun 11
We took the seat map of a plane and turned it into a Power BI report.
Each seat is colored by the revenue it generated under dynamic pricing. Select a row, get the totals. Spot the seats that earn more and the ones that don't.
The case study shows the entire process: the SVG map, the data binding, and the setup in Power BI Desktop. Check it out if you have a floor plan, a map, or any drawing you'd like to turn into a report.
Here’s the full video: youtube.com/watch?v=FrUqHSgq…
Here’s the full case study and implementation details: okviz.com/usecase/plane-seat…
1
21
1,329
Jun 9
I am glad to see new videos describing specific Synoptic Panel features because it means I didn't have to record them!
This is a tutorial of the Map Selector feature: you create a DAX measure that returns the name of the map to display. This way, you can respond to the filter context and make custom choices based on selections in other visuals.
youtube.com/watch?v=nnDcOq4u…
2
6
1,337
Jun 6
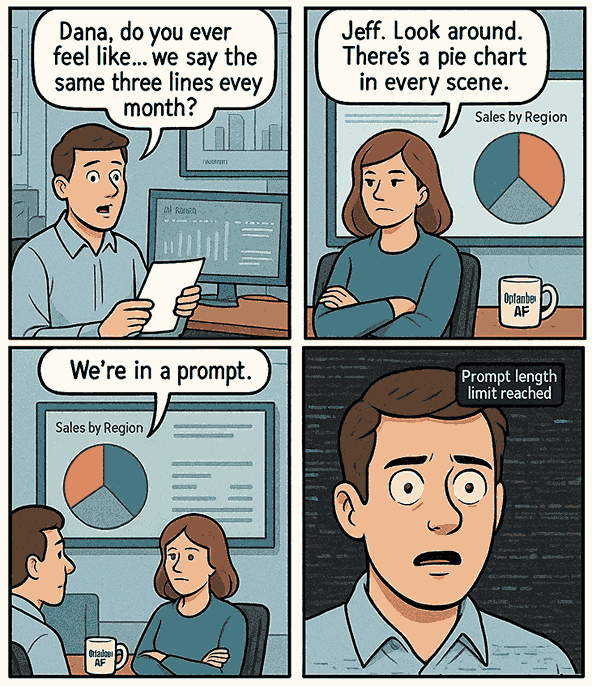
We introduced comics to the SQLBI Newsletter almost one year ago.
Lately, they are starting to realize they are not real.
How do you know you are not in a simulation? Wrong answers only! 😎
1
8
895
Jun 4
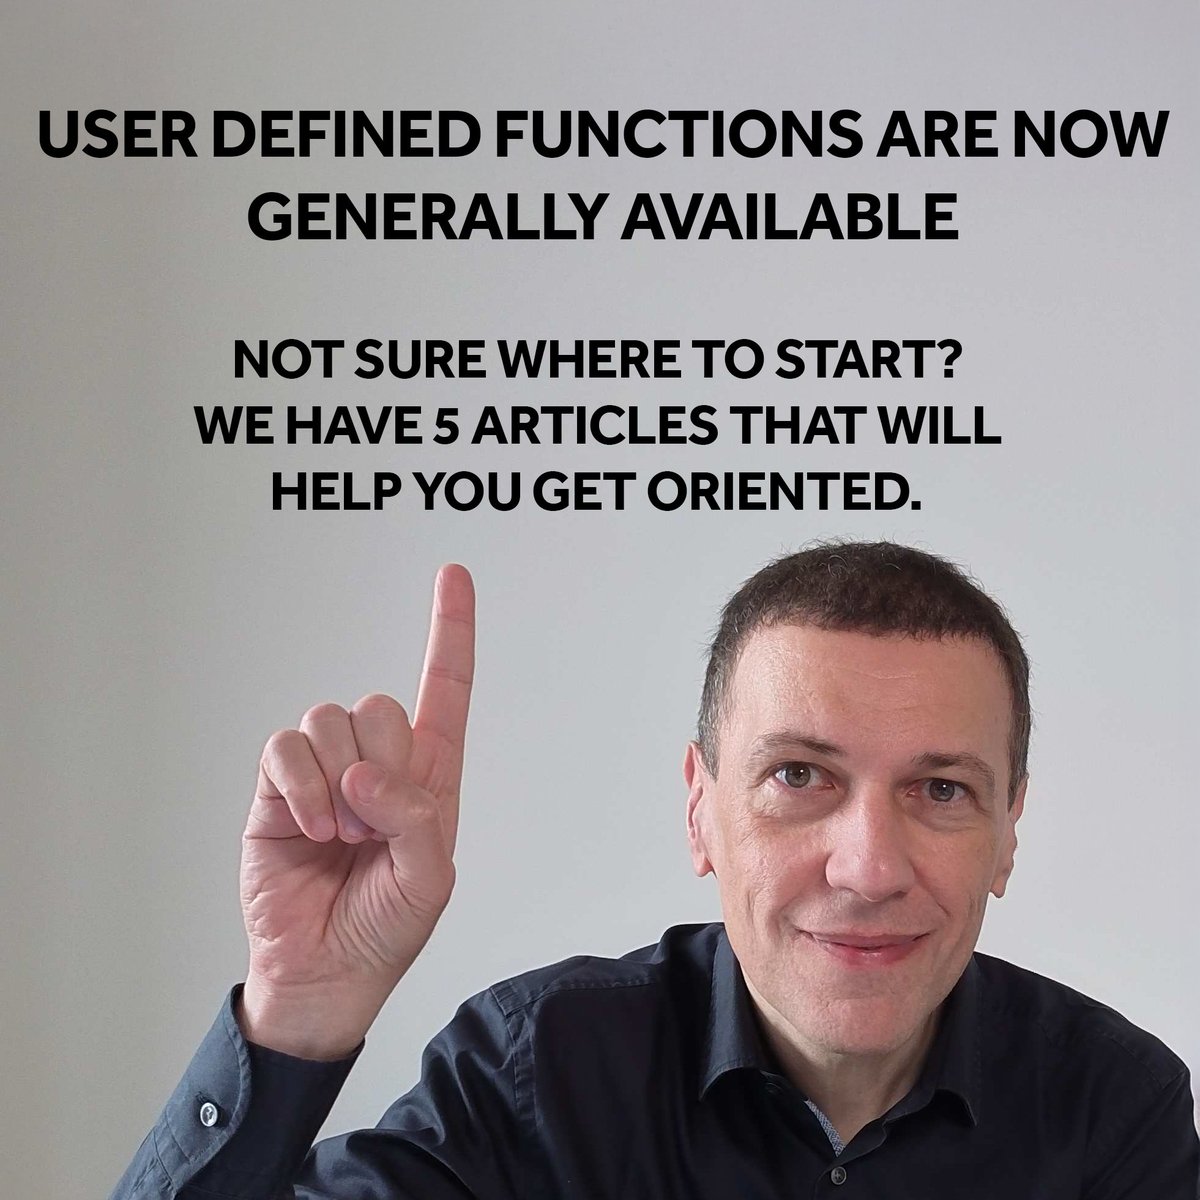
DAX User-Defined Functions are now Generally Available.
No more excuses: now you can use them!
If you're wondering where to start, we put together a page with 5 articles that cover the basics and the less obvious parts: what UDFs are, how parameter types work, the difference between UDFs and calculation groups, and how to build reusable patterns.
Here is your starting point: sqlbi.com/dax-user-defined-f…
We already planned two other articles about UDFs that we’ll add in the coming weeks. Stay tuned!
1
3
27
1,263
Jun 3
Good news: Copilot in Outlook was helpful today (I included a screenshot when asking for help).
Bad news: Microsoft changed the layout for consistency (?), making at least one user (ME!) angry.
I would like to understand the rationale behind this being more helpful/productive (it is not IMHO).
#outlook #Microsoft365 😞
2
1,022
Marco Russo retweeted

Jun 3
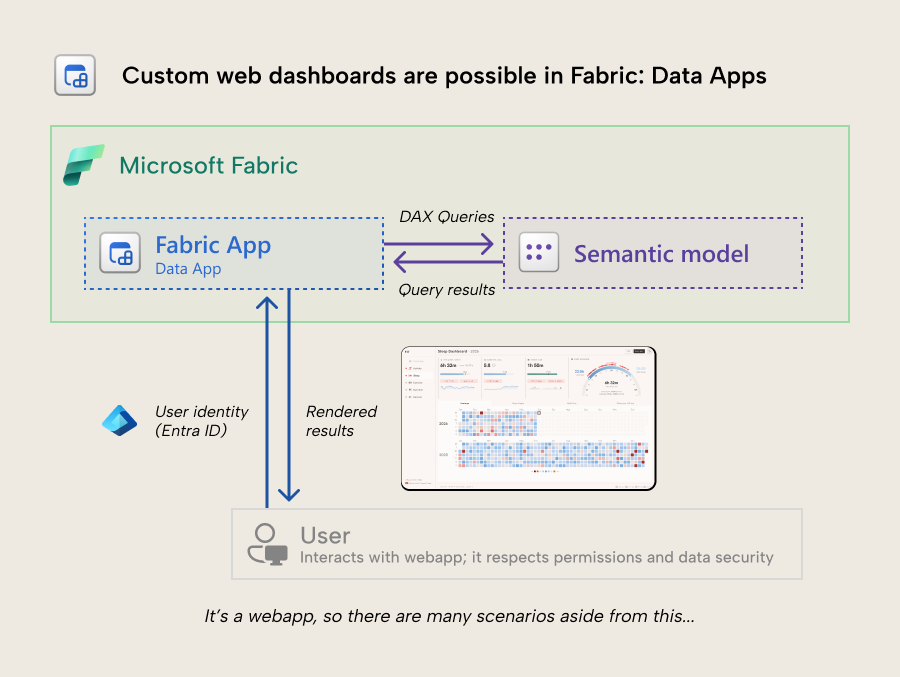
Visualize your semantic model data with Vega/D3.js from Fabric with data apps - a type of Fabric app. Custom web dashboards are now possible.
This is probably the most interested I've been in a new Power BI or Fabric feature, ever.
Read about it: tabulareditor.com/blog/fabri…
1
10
64
35,038
Jun 3
DAX User-Defined Functions (UDF) are generally available!
The cherry on the cake is optional parameters: a long-awaited feature during preview is included in this release.
For now, read the official Microsoft announcement; we'll produce more content on SQLBI in the coming weeks!
community.fabric.microsoft.c…
Now you have no more excuses!
#dax #powerbi #udf
4
27
1,604
Jun 2
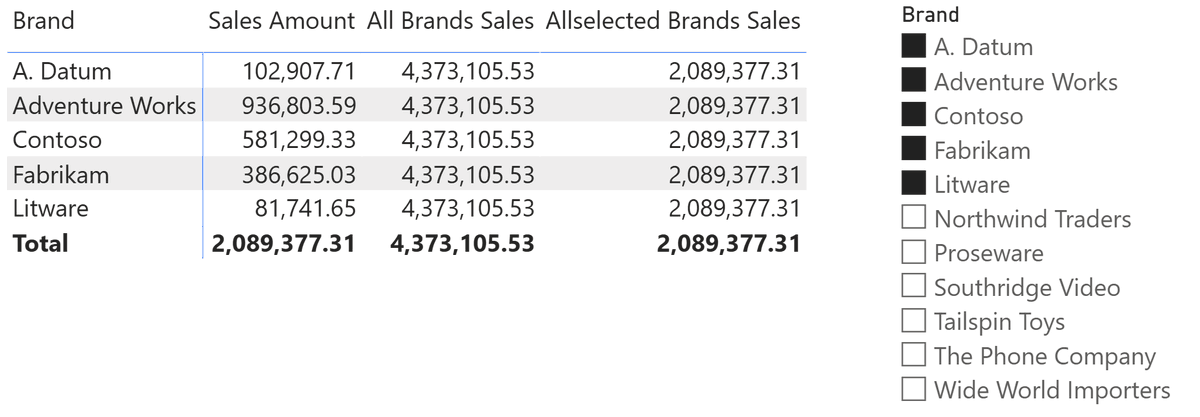
ALL, ALLSELECTED, ALLEXCEPT, and REMOVEFILTERS: There are several DAX functions to remove filters from the filter context. In this article video, we analyze the differences among them and clarify what to use depending on the requirements.
#dax #powerbi
sqlbi.com/articles/all-vs-al…
5
31
1,456
May 30
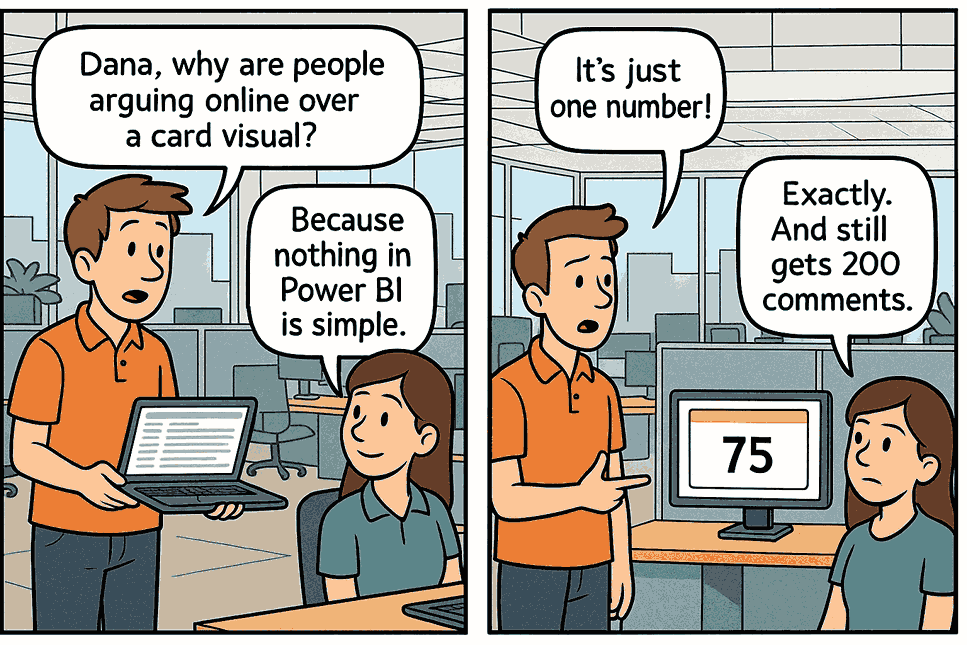
Hot take for a Saturday morning:
The new card visual debate has produced more LinkedIn posts than actual card visuals in production.
Anyway, if you're tired of the whole thing, OKViz has this thing called Card with States. States, thresholds, colors, you know the drill. Certified and free forever. Just saying. okviz.com/card-with-states/
How did you actually handle the switch? Wrong answers only, it’s Saturday ;)
1
9
1,024
May 28
Your office has 200 desks and no fixed assignments. People move around, teams rotate, and meeting rooms change by the hour.
Tracking that in a spreadsheet gets old fast. Synoptic Panel in Power BI lets you take a floor plan, connect it to your reservation data, and see who sits where in real time. Switch floors, check availability and zoom in.
The map in this video is made up, but the problem is not, we've had companies come to us with exactly this setup.
And yes, this could be a legit use case for DirectQuery!
𝗥𝗲𝗮𝗱 𝘁𝗵𝗲 𝗳𝘂𝗹𝗹 𝗰𝗮𝘀𝗲 𝘀𝘁𝘂𝗱𝘆 𝗵𝗲𝗿𝗲:
okviz.com/usecase/workspace-…
𝗧𝗿𝘆 𝗦𝘆𝗻𝗼𝗽𝘁𝗶𝗰 𝗣𝗮𝗻𝗲𝗹
okviz.com/synoptic-panel/
2
1
11
1,455
May 24
Sunday morning confession: I actually love donuts.
#dataviz
youtube.com/watch?v=hea7fSsL…
1
1
4
1,318
May 23
We spend a lot of energy making fun of BI analysts and developers. This time it's the users' turn.
User-aware calculated columns are now a thing in DAX. The report can personalize itself based on who's viewing it. Translations, dynamic content, no RLS needed.
Turns out, not everyone loves the idea of their report knowing who they are. Which raises two questions:
1) Have you ever heard of system logs?
2) What exactly are you doing in that report that you don't want anyone to know about? 😎
If you want the technical details: sqlbi.com/articles/introduci…
4
14
1,588
May 21
What kind of parameters can you use in DAX user-defined functions?
This video introduces parameter types and passing modes in DAX UDFs: learning the difference between VAR and EXPR passing modes is the critical element to learn.
A practical demo to understand how parameters work in UDFs and why they matter when creating reusable DAX logic.
Watch the full video here: youtube.com/watch?v=q29LycVp…
6
17
1,152
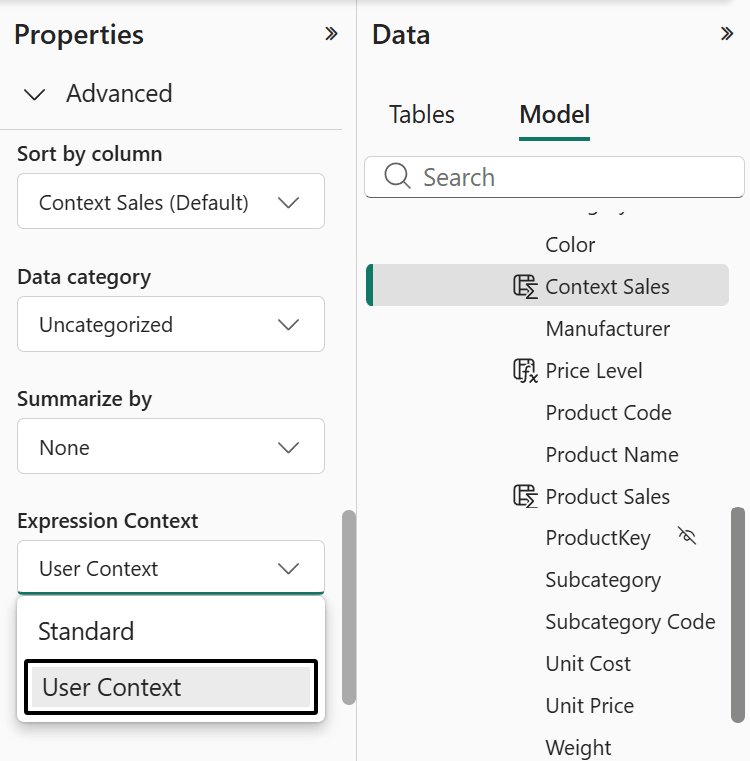
May 19
This article video describes the new Expression Context property for calculated columns in Power BI, explaining how 𝘂𝘀𝗲𝗿-𝗮𝘄𝗮𝗿𝗲 𝗰𝗮𝗹𝗰𝘂𝗹𝗮𝘁𝗲𝗱 𝗰𝗼𝗹𝘂𝗺𝗻𝘀 work, why they are not materialized, and how to use them as 𝘃𝗶𝗿𝘁𝘂𝗮𝗹 𝗰𝗮𝗹𝗰𝘂𝗹𝗮𝘁𝗲𝗱 𝗰𝗼𝗹𝘂𝗺𝗻𝘀 for localization and custom security scenarios.
#powerbi #dax
sqlbi.com/articles/introduci…
1
10
27
1,430
May 16
AI agents help you do your work. Will they also decide when you need a vacation? ;)
If you don't get the reference, Plan is a new Fabric feature for Enterprise and Corporate Performance Management, launched a few months ago, when we published the comic on our SQLBI Newsletter.
Plan is not AI-based, since it’s Saturday, we just thought it was fun to imagine what would happen if it were.
If you prefer boring stuff on a Saturday, here's the documentation:
linkly.link/2ixiw
1
7
1,098
May 14
Baltimore, May 27-29.
This is the last Mastering DAX class in North America before fall.
Three days, in person, small group. The kind of class where you actually get to ask your questions and work through your specific problem.
After this, the next US date won't be until late 2026. If it's been on your list, now is the time.
sqlbi.com/p/mastering-dax-wo…
2
553
May 5
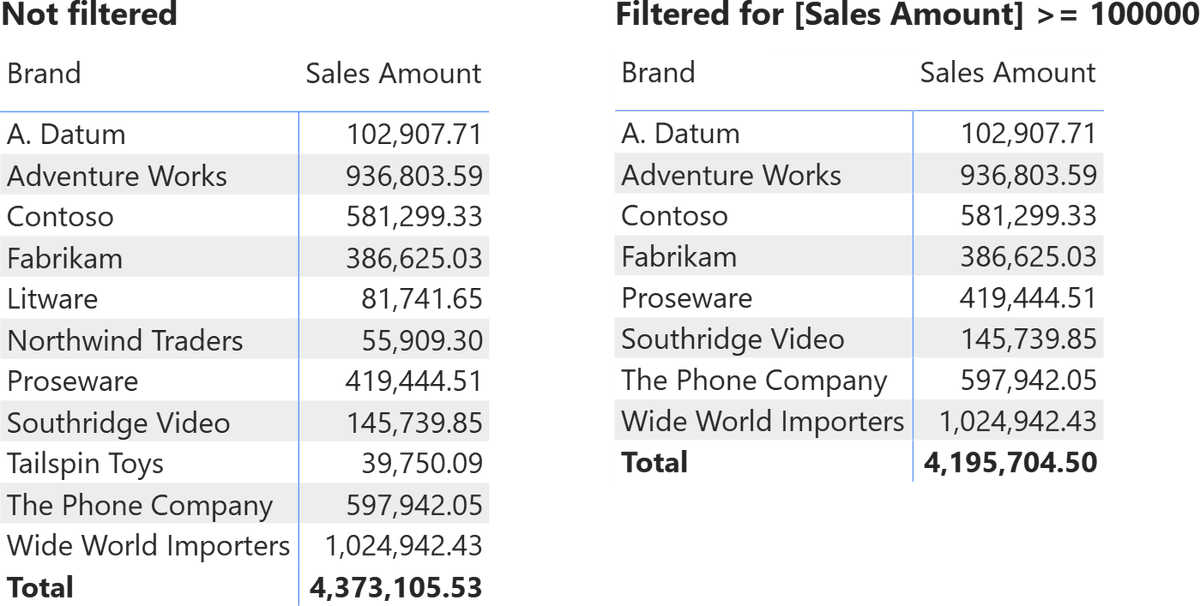
A slicer cannot filter a measure. This article video analyzes this common request by explaining how to use a slicer to filter a measure, after discussing the real meaning of using a measure with a slicer.
#powerbi #dax
sqlbi.com/articles/filtering…
2
5
22
1,672
May 5
Hey, web designers, why do you keep designing websites for mobile devices and small-screen laptops that don't take advantage of large, high-DPI screens?
Why do you assume my full-screen size is all yours?
I claim ownership of my screen real estate!
1
8
995
May 2
This dad making a sandwich with his kids' instructions is basically what happens when people use an LLM, and something goes wrong.
Kid says, "Put the peanut butter on the bread.” Dad stabs the jar into the loaf. Kid loses it. But he did what was asked.
Inexperienced people keep running into this with DAX formulas. It runs, the number comes out, looks fine. Nobody checks it. Two weeks later, someone asks why the report doesn't match finance, and the answer is often the same: the formula did what you told it, not what you meant.
People think the hard part of using AI is making it work. It's not. It's realizing you left something out of the instructions that you thought was obvious. A person would have asked, "Wait, what do you mean by last year?” The machine (often) just picks one and goes.
The annoying part is that to write a prompt that gives you the right formula, you already need to understand the problem well enough to write it yourself. At that point, you're saving time on typing, not on thinking.
I don't have a good answer for what someone starting from zero should study right now. The fundamentals still matter, though. If you understand the concepts and the semantic model, you can check what comes out.
If you can't check it, you're the kid watching the sandwich fall apart.
Video credits: "Exact Instructions Challenge" by Josh Darnit on Youtube.
3
20
5,642