
Joined March 2017
- Tweets 14,303
- Following 112
- Followers 43,944
- Likes 19,501
313 Photos and videos


Pinned Tweet

30 Jan 2025
Hey folks, if you're following other projects on other sites, you can also find us at:
* instagram.com/matplotart/
* bsky.app/profile/matplotlib.…
* fosstodon.org/@matplotlib
1
1
19
5,618
Jun 12
Hey folks, have you been working w/ Matplotlib long enough to have interacted w/ our deceased founder John Hunter? For SciPy2026 reasons, we'd love to hear/read about your memories 🥰
May 9

The #SciPy2026 schedule is live 🎉
🚀 Get ready for an amazing week of talks, tutorials, community events, and great hallway conversations! Can’t wait to see you all in Minneapolis soon 🐍📊
Start planning your week ➡️ scipy2026.scipy.org/schedule
2
8
2,169
Matplotlib retweeted

Jun 12
Bayesian updating is one of the most powerful ideas in data science 🔄📊
... and most people still underuse it!
You start with a belief (prior)…
then reality shows up (data)…
and you update your mind (posterior)! 🚀
That’s it. That’s the magic. But here’s where it gets interesting 👇
Weak prior vs strong prior
Little data vs lots of data
Wrong assumptions vs robust inference
Watch uncertainty move in real time!
I built an interactive #Python @matplotlib dashboard so you can experience it:
👉 github.com/GeostatsGuy/DataS…
Play with it, break it, rebuild it 🧠⚡Stoked!
7
86
3,583
Jun 12
🥳

🎉 Scikit-learn 1.9 released:
■Solid improvements to many existing estimators: faster, more stable, handling missing values, adding GPU support…
■Also, enhanced estimator displays in notebooks,
■And callbacks that enable progress bars or monitoring of convergence

10
1,732
Matplotlib retweeted

2026-06-01 M6.2 22 km WSW of Scarcelli, Italy #earthquake 3D area historical seismicity.
243 km deep event in the southern Tyrrhenian subduction zone, here shown in a 10° x 10° x 700 km volume. Reference land contours are plotted in green.
@matplotlib #CitizenScience
1
5
19
2,099
Matplotlib retweeted

May 31
45
646
5,571
273,475
May 27
💞
May 27

1
4
66
3,733
Matplotlib retweeted
May 14
Tree-based gradient boosting is an ensemble method that builds a powerful prediction model by sequentially adding weak learners (often decision tree stumps). 🌲📈
To help my students really get it, I built a #Python @matplotlib interactive dashboard 🚀🐍
Step through each stump and watch the model update as the residuals and error evolve in real time! 🔥🎯
#MachineLearning #DataScience #AI #Python
2
7
60
3,081
Matplotlib retweeted

May 10
📣 If you’re at #PyConUS2026 next week, catch @InessaPawson
and @juanitagomezr at the Community Showcase on Sunday with flyers and stickers for #SciPy2026! 🙌
If you have questions about the conference or just want to connect with the community, this is your chance 🎉

3
11
1,896
May 5
🥳

mlpack received $300K from the Sovereign Tech Agency to strengthen open-source ML infrastructure.
Over the next 18 months, you can expect: modern GPU backends, ONNX support, better Python/R/Julia bindings, DuckDB Arrow integration, and more.
Read more on the NumFOCUS blog: hubs.la/Q04f555R0
1,422
Matplotlib retweeted
May 5
I’m stoked to teach density-based cluster analysis to my students! 🔥
Agglomerative clustering is a bottom-up hierarchical method: each point starts as its own cluster, then pairs of clusters are repeatedly merged based on similarity until one tree of clusters (a dendrogram) is formed 🌳
Very intuitive—it mirrors how we naturally perceive structure—like pointillism 🎨, where meaning emerges by progressively merging nearby points of similarity into coherent patterns!
To help my students visualize density-based cluster analysis, I built an interactive #Python dashboard with @matplotlib 📊🚀
3
33
2,569
Apr 29
We have a pre-release we'd love y'all to test! Especially if you use non English scripts - a major part of this release is the overhaul of text and font processing to support modern font features, enabling full internationalization in all languages.
github.com/matplotlib/matplo…
2
2
11
1,513
Apr 28
it's a vibe
Apr 26
A degree-100 polynomial p. Color each point z of the plane by arg(p(z)). The zeros are the points where the full color cycle closes on itself. Let the roots drift, and the colors flow with them. Made with #python #numpy #matplotlib in a @marimo_io notebook.
1
14
1,944
Matplotlib retweeted

Skąd najlepiej widać Tatry?
Analiza widoczności 329 szczytów Tatr (>2000 m n.p.m.) w promieniu 50 km. Dla każdego z 222 tys. heksagonów obliczono line-of-sight na modelu terenu Copernicus DEM 25m.
@matplotlib @GdalOrg

1
2
9
929
Apr 6
Cool!
Apr 6

I taught Claude Code to make beautiful @matplotlib charts!
I Built an opinionated skill for publication-quality figures, in a style that I like. It's a work in progress and I hope others will contribute. github link below 👇
1
23
6,964
Mar 23
🥳
Mar 23

We've recently released many new features that improve the developer experience for computational research, ML, and AI, including a native reactive @matplotlib element, PyTorch formatters, and remote storage inspector.
Learn more in our latest video:
youtube.com/watch?v=-oi7cGIx…
6
1,376
Matplotlib retweeted

Take a few minutes to complete the 2026 Python Developers Survey and help us map out an accurate landscape of the Python community! #python #pythondevsurvey
surveys.jetbrains.com/s3/pyt…
16
29
8,685
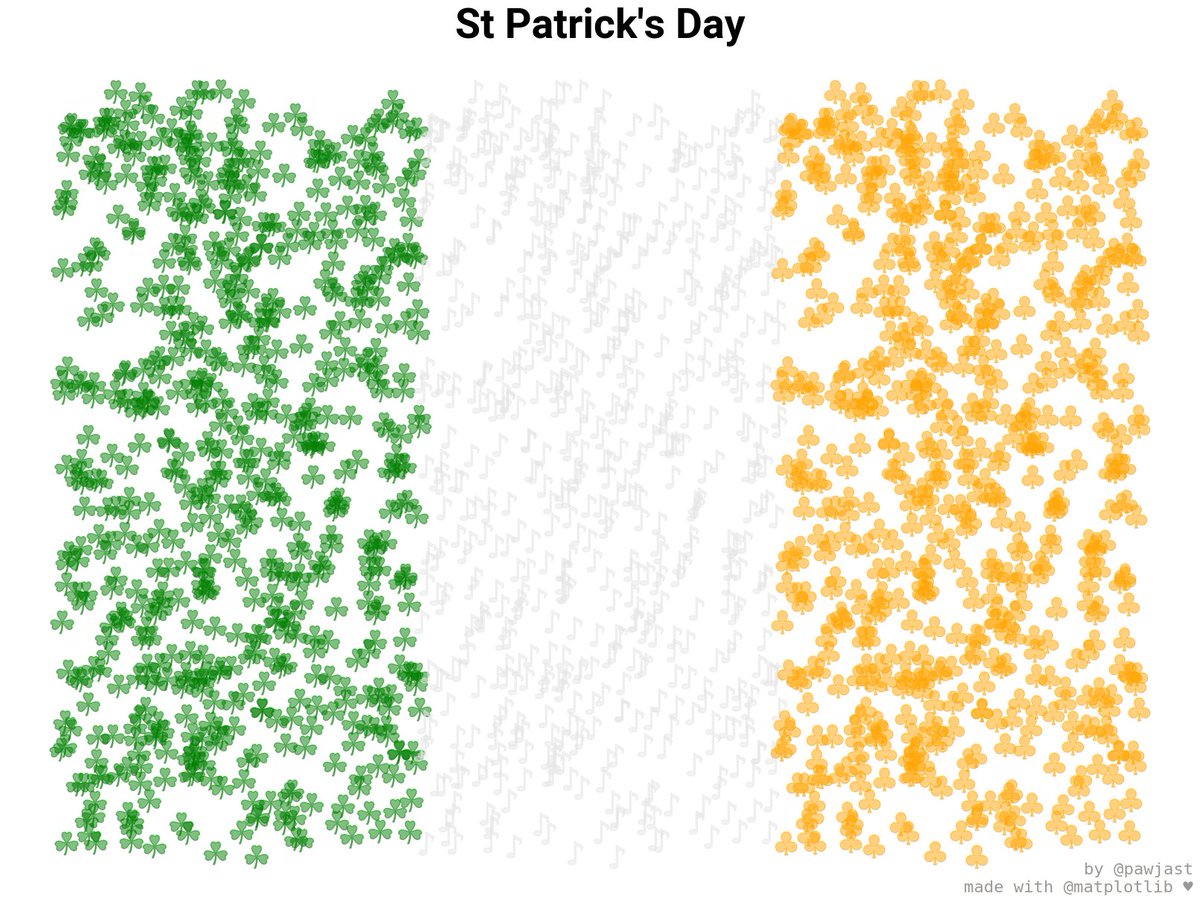
Mar 17
☘️

1
1
12
1,536
Matplotlib retweeted
Mar 4
This week I told my students a hard truth:
Your spatial data is probably biased,
and yes… that means your statistics, and your models, and your decisions may be biased too.
But I had good news!
We can mitigate this with spatial declustering.
To make sure they really understood, I built a new interactive #Python @matplotlib dashboard yesterday.
Here’s what we explore:
✳️Sample on a regular grid (representative sampling) → the estimate converges to the true mean.
✳️Add infill samples in “good” locations → the mean becomes biased.
✳️Apply declustering weights → the statistics become far more robust under variable sampling density.
You can experiment with it yourself. I just shared the full workflow on my #GitHub @ github.com/GeostatsGuy/DataS….
Education changes lives. Let’s make spatial models better. #DataScience
7
42
3,076
Mar 2
Hey folks! Interested in GSOC? Unclear how to use AI properly? Want to contribute and it's all feeling a little ?! Join us for our monthly new contributors meeting and ask all the questions!
ALT Yellow card with text “matplotlib New Contributors Meeting. Tuesday March 3rd 11AM UTC, on Zoom. Details at https://hackmd.io/@matplotlib/ncm0326. All are welcome! Everyone can present or watch. Join us ^-^”.
2
5
28
2,410
Mar 2
👀 so cool!
Mar 2
Our latest release brings richer interactivity to machine learning and scientific computing workflows, including reactive @matplotlib plots, a matrix UI element, a native rich visualizer for @PyTorch modules, and a thread-safe progress bar for parallelizing work.
(1/n)
1
70
698
62,383