
Joined April 2009
- Tweets 419
- Following 433
- Followers 617
- Likes 979
34 Photos and videos


Pinned Tweet

25 Oct 2021
I just launched my first newsletter, Data the Senses, with occasional appearances by my collaborator @jordanwb! We'll expand our sensory vocabulary with fun exercises. Check out the first article and see if it's for you: buttondown.email/datathesens… #datathesenses
1
10
Max Graze retweeted

23 Feb 2024
OMg, these are amazing!
1
1
4
597
26 Jan 2024
Most articles about dataviz style guides will emphasize that they are living documents. But how can you tweak and assess them? This article serves as a starting point for creating surveys to improve your own style guides. @jschwabish @alangwilson @AmyCesal nightingaledvs.com/developin…
1
131
Max Graze retweeted

18 Jan 2024
Excited to see the paper @max_graze and I wrote together on dataviz style guides published by JAMIA. We'll also be publishing step-by-step palette-building tutorials in Adobe, Excel, PowerBI, and Tableau soon. | In the meantime, check out the article: academic.oup.com/jamia/advan…
1
5
23
1,963
2 Jan 2024
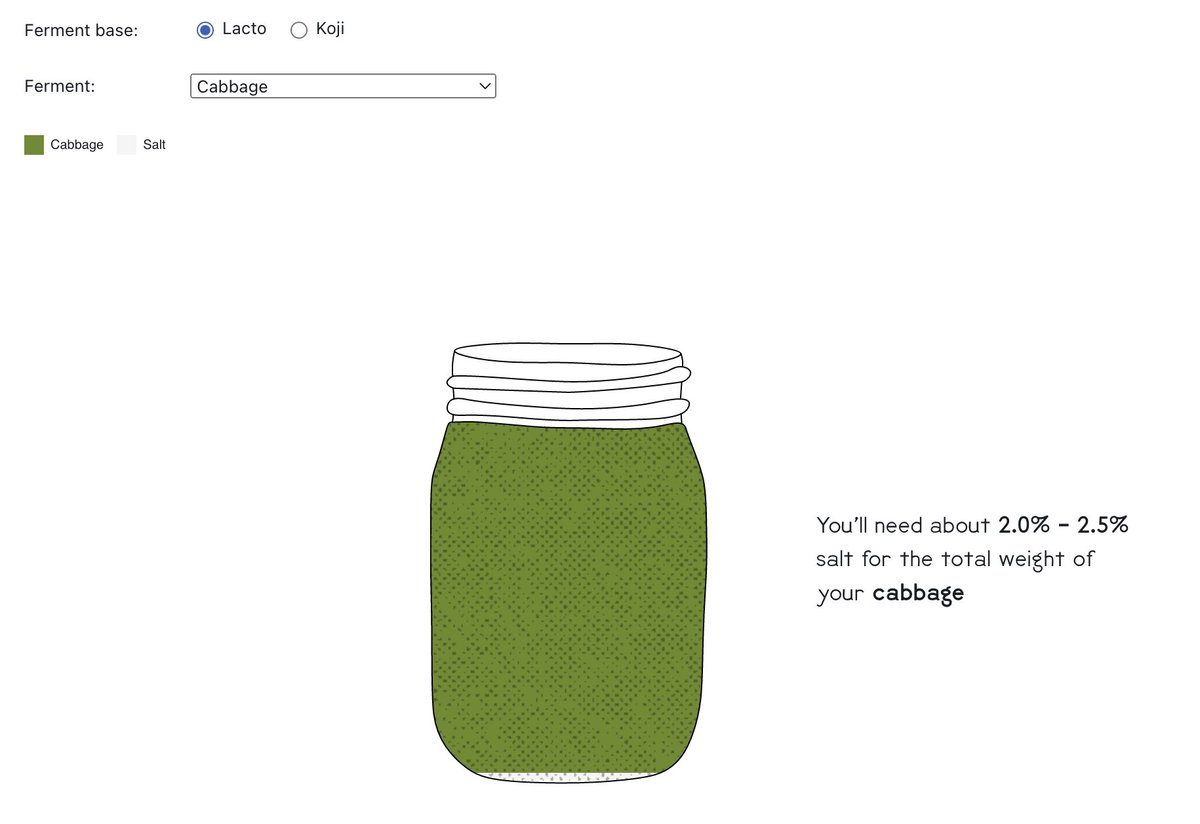
I was struggling to find a purpose for uniting fermentation with data visualizations, simply because it's a combination of two of my passions. Now I think I've found a symbiosis - read more about my ideas here and let me know what you think! buttondown.email/datathesens…
115
25 Sep 2023
Categorical color. When using color to establish categories, the goal is simple: to distinguish one thing (or group of things) from another. This is easiest when there are few categories and it becomes increasingly untenable the more you have. 1/8
from: datavizstyleguide.com/gettin…
1
1
3
455
25 Sep 2023
Another time semantic color comes into place is when categories have specific color associations. If your categories were oranges, apples, and bananas it would only make sense to use orange, red, and yellow because we intuitively associate the meaning of each color. 7/8
1
74
25 Sep 2023
Some organizations have dozens of specific color mappings, others don’t have any. What does your organization need? 8/8
68
31 Aug 2023
"On the surface, establishing standards for color can seem daunting, but approaching it through a utilitarian lens, the task becomes much more manageable. Color in data visualizations usually takes one of three forms—categorical, sequential, or diverging." datavizstyleguide.com/gettin…
1
2
226
Max Graze retweeted

26 Aug 2023
I know of a few museums that have lost objects on their own premises because of a data issue! Right now is the moment to invest into digitization and digital inventories!
26 Aug 2023

UPDATE: George Osborne, chair of trustees at the British Museum, told the BBC Today programme that the museum is starting to recover some of the stolen items. "The truth is we didn't have a complete catalogue of everything."
ow.ly/sUIU50PEF1R
1
2
14
1,122
23 Aug 2023
It's been a while, but @jschwabish, @amycesal, @alangwilson, and I have published the next installment of the "Guide to Making a Data Visualization Style Guide" =>
datavizstyleguide.com/gettin…
This guide is a WIP, so we'd appreciate any feedback you can give us - help us help you!
1
8
1,097
Max Graze retweeted
6 Jun 2023
New blog post on choosing and creating color palettes for your data visualization style guide--including a link to the new peer-reviewed paper from me and @max_graze. | Why are six colors common in color palettes for data visualization? policyviz.com/2023/05/31/why…
1
10
47
6,677
3 Jun 2023
It's been a long time coming, but finally, it's published! Although written with health practitioners in mind, the article still applies to anyone looking to make color palettes in their organization, or for themselves, and don't know where to start.
2 Jun 2023

New peer-reviewed article about color palettes in data visualization style guides from myself and @max_graze. Thanks especially to @AmyCesal & @alangwilson for our little working group. |
📷Building color palettes in your data visualization style guides academic.oup.com/jamia/artic…
4
444
Max Graze retweeted

26 May 2023
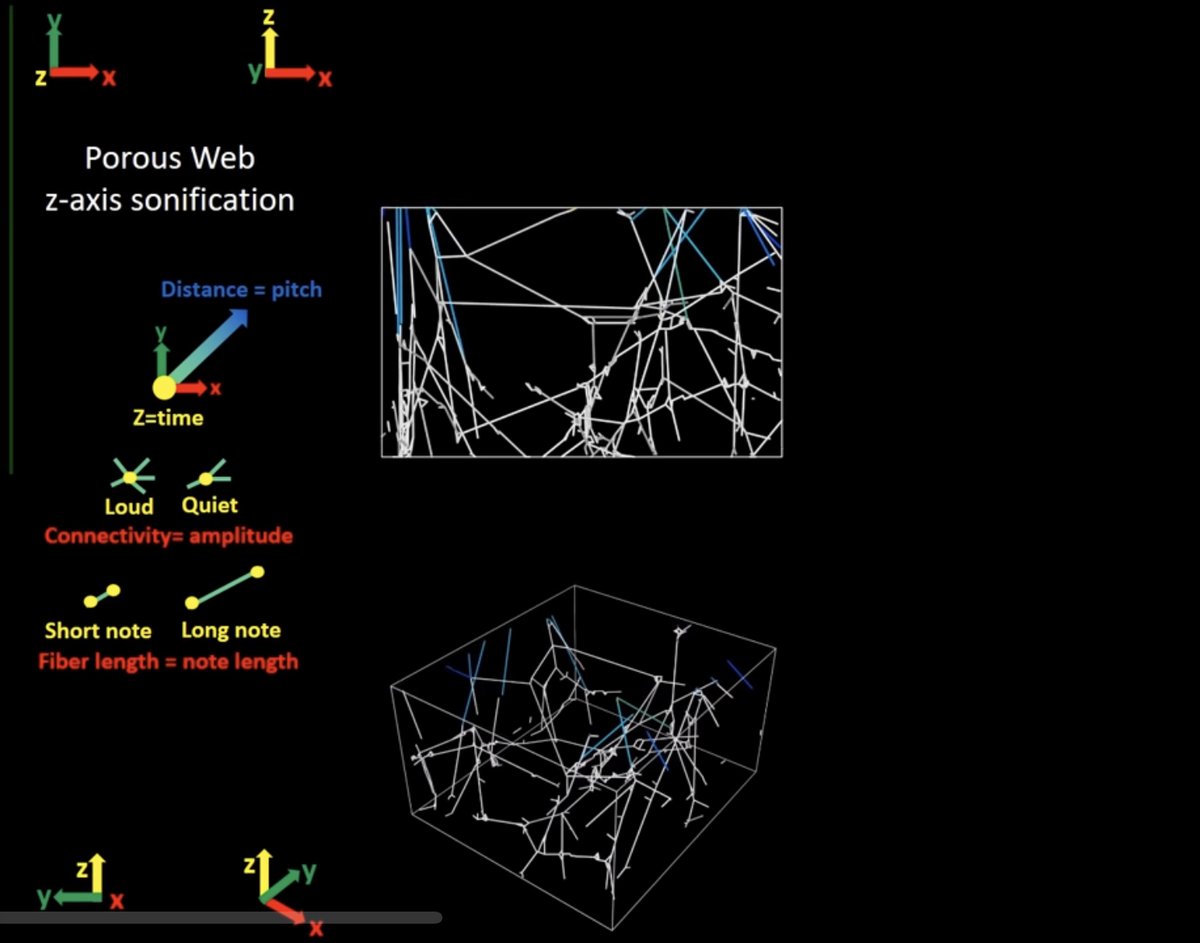
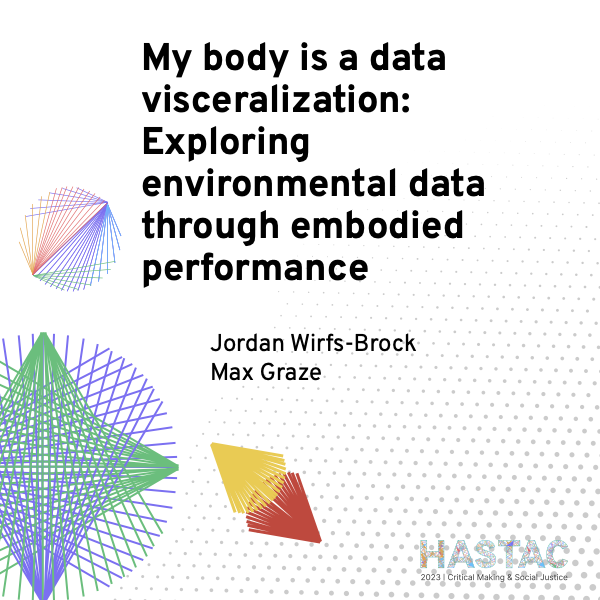
"My body is a data visceralization: Exploring environmental data through embodied performance" is for anyone who is curious about doing fun and strange things with data. Sound like you? Sign up here: sched.co/1LePh #HASTAC2023
3
6
690
Max Graze retweeted

9 May 2023
Can't make it to #TC23 but still want to be part of @DSuffragettes’s interactive scatter plot? We've got you covered.
Join the community by adding your own data point to the springtime prompt! 📈🌸
shorturl.at/dnHQ6
4
13
1,904
Max Graze retweeted

Wrapped up @OutlierConf with a beautiful day in lovely Porto. It's been delightful to meet so many great people, learn a bunch and get inspired. The dataviz community lives up to the hype 💜
#outlier2023
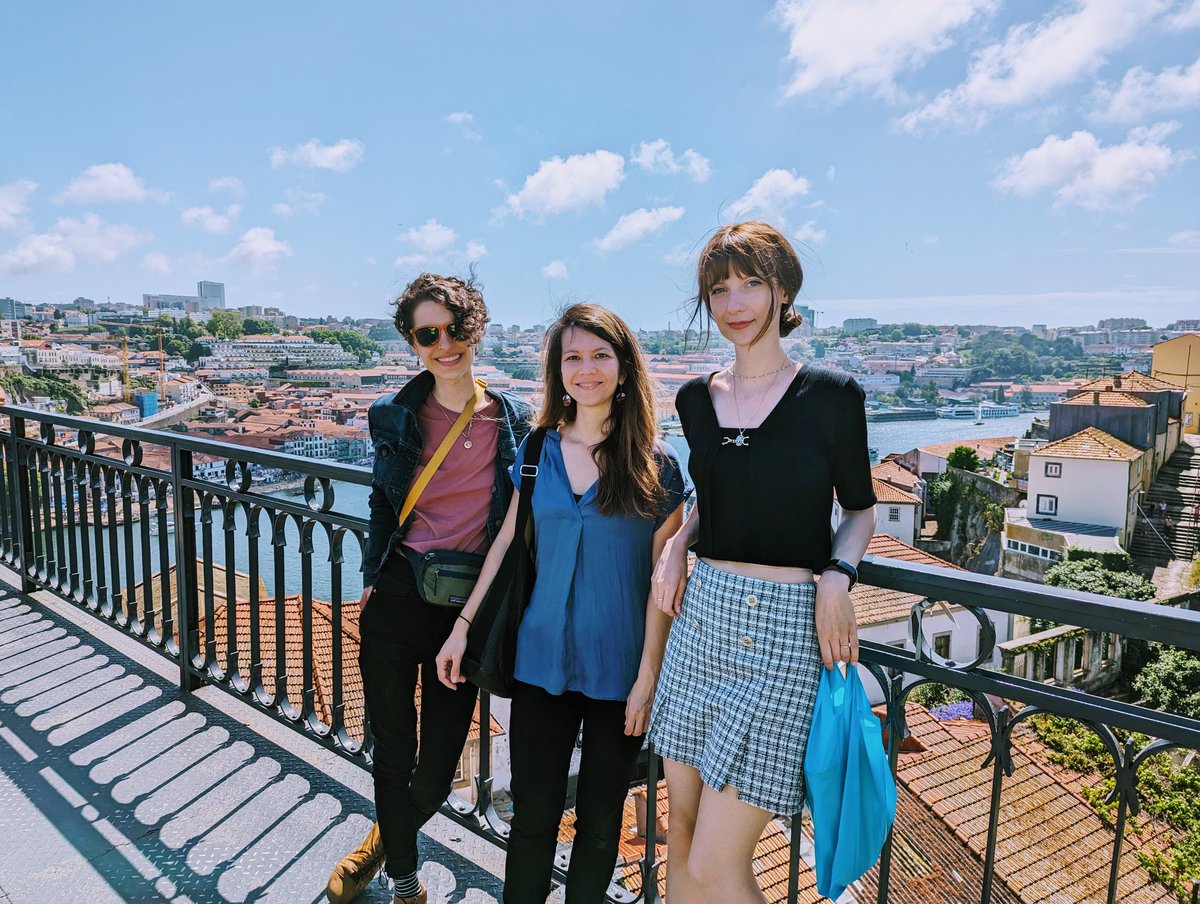
ALT Three women smiling, on a bridge with Porto City view in the background and lovely blue sky.
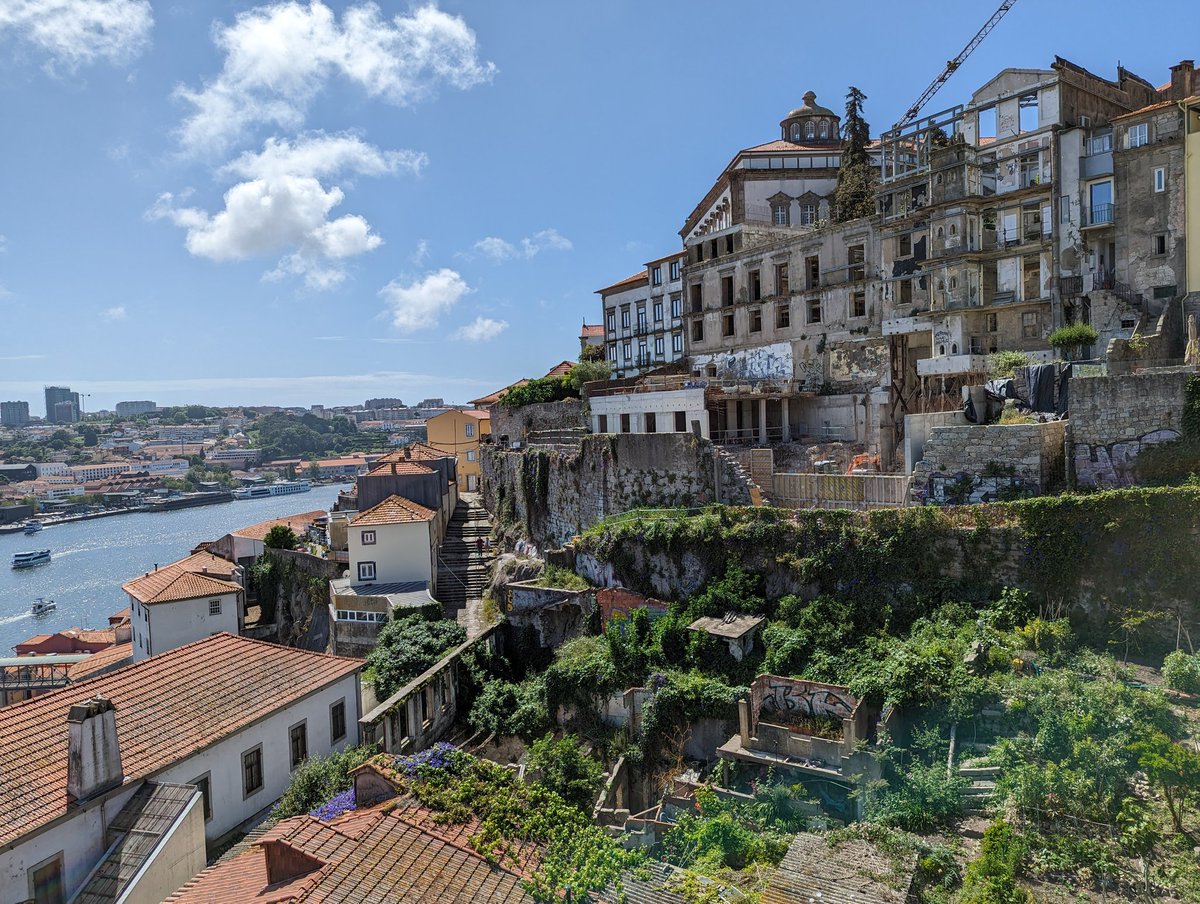
ALT Old buildings on a hill and sliver of river, Porto.
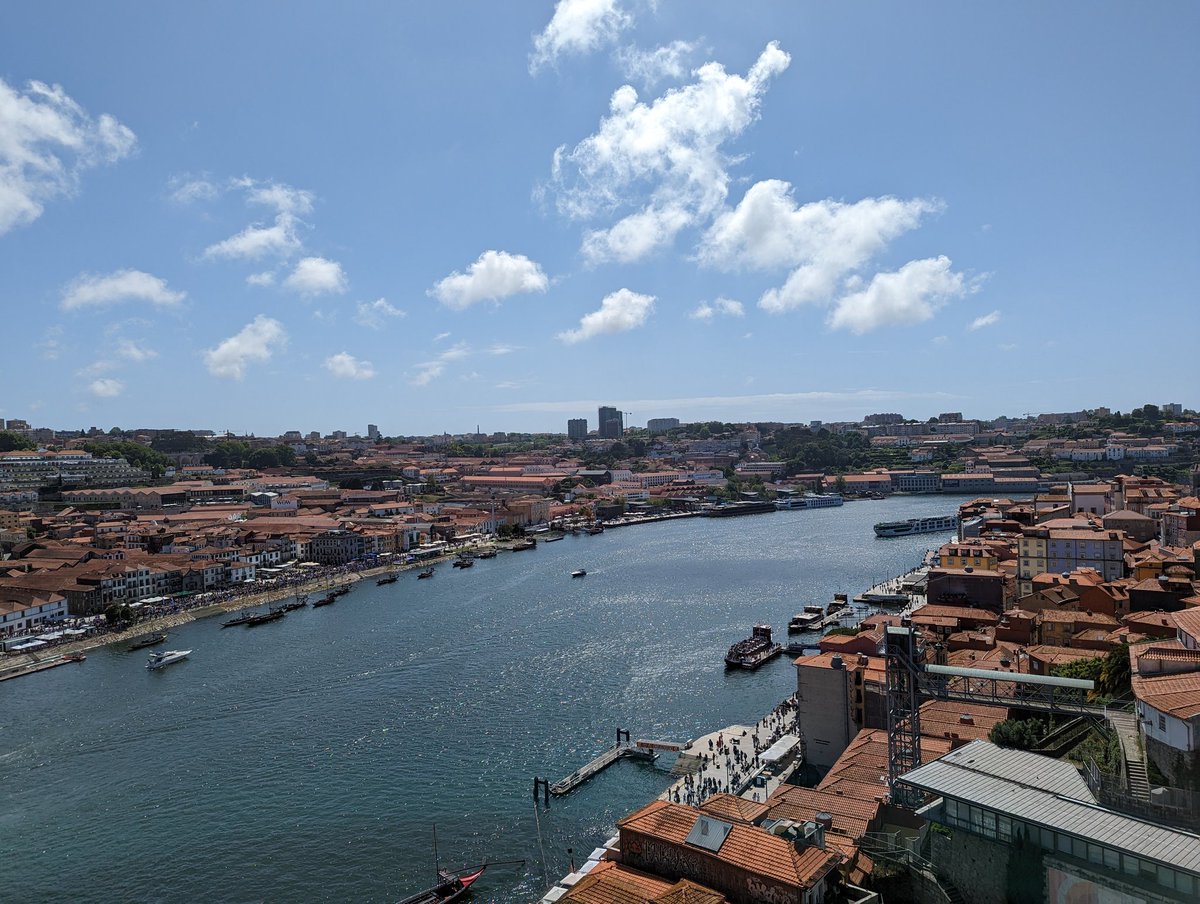
ALT Panoramic view of river and houses from a bridge in Porto
1
3
38
3,805