
The best tool to create #ScienceFigures! 🧠 We help you illustrate your research easily - no design skills needed | A @cactusglobal solution | #AcademicTwitter
Joined November 2011
- Tweets 4,625
- Following 1,224
- Followers 1,331
- Likes 1,192
1,709 Photos and videos


Pinned Tweet

30 Sep 2025
Too often, scientists have to compromise on visuals, forced to use illustrations that are "close enough." We think that's a problem.
So we built PowerEdit, a new feature that gives you the power to make every figure as precise and impactful as your data.
1
1
251
30 Sep 2025
Too often, scientists have to compromise on visuals, forced to use illustrations that are "close enough." We think that's a problem.
So we built PowerEdit, a new feature that gives you the power to make every figure as precise and impactful as your data.
1
1
251
30 Sep 2025
With PowerEdit, you're no longer just a user, you're the designer.
✂️ Break it apart & edit anything
🎨 Instantly change colors
➕➖ Add, remove, or remix elements
See how it works here 👉: youtu.be/eUSMw0kDbZU?si=G1un…
#ScientificIllustrations #MindtheGraph #researcher
163
13 May 2025
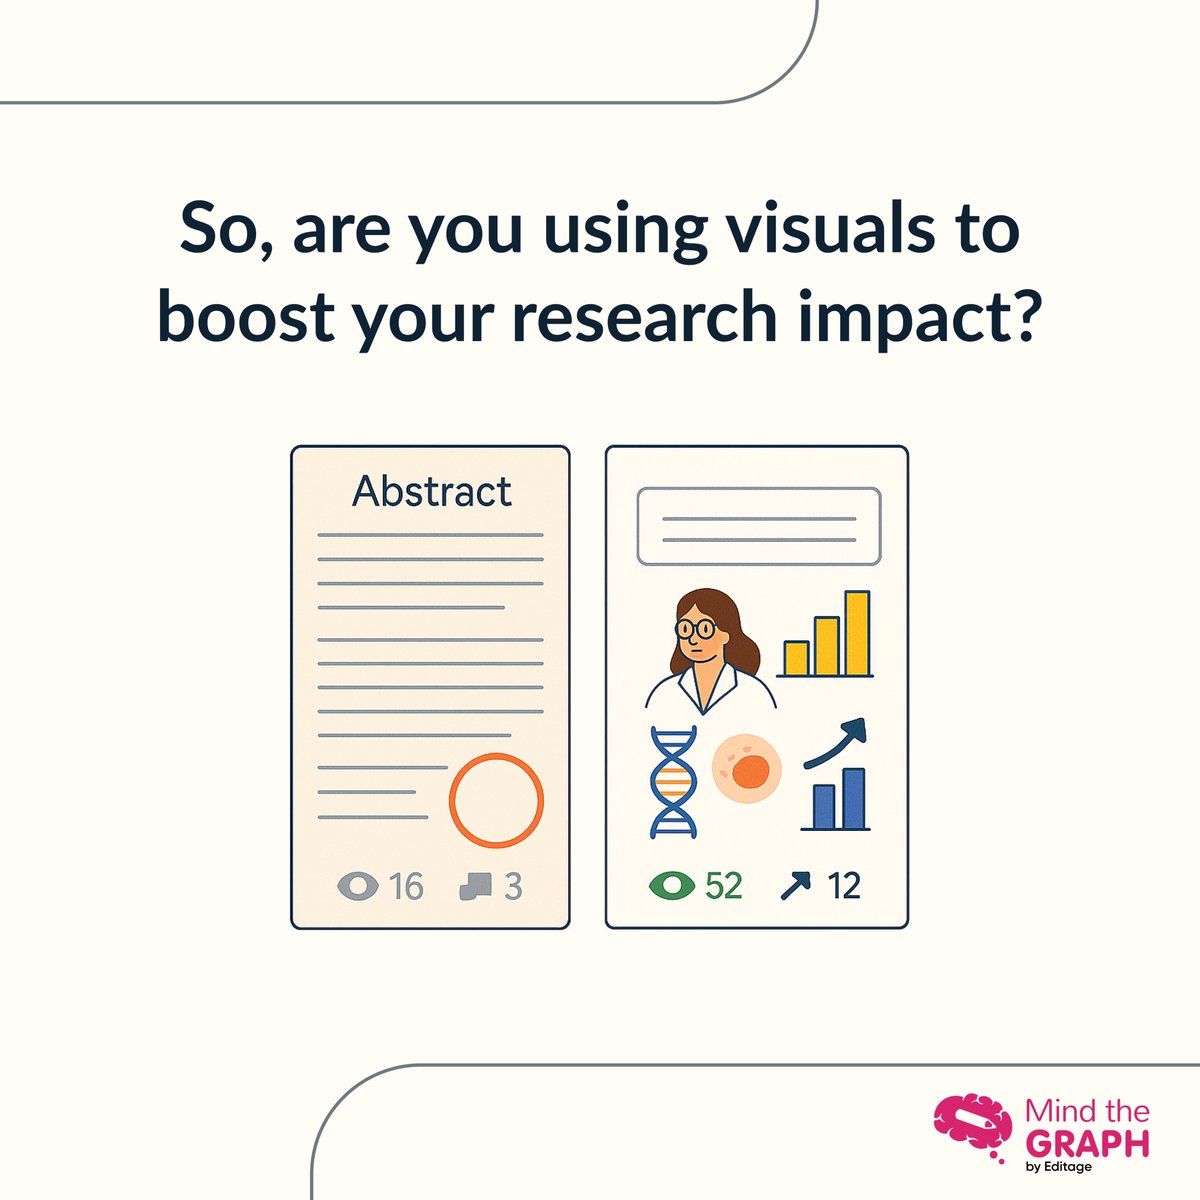
Struggling to make your research stick with readers?
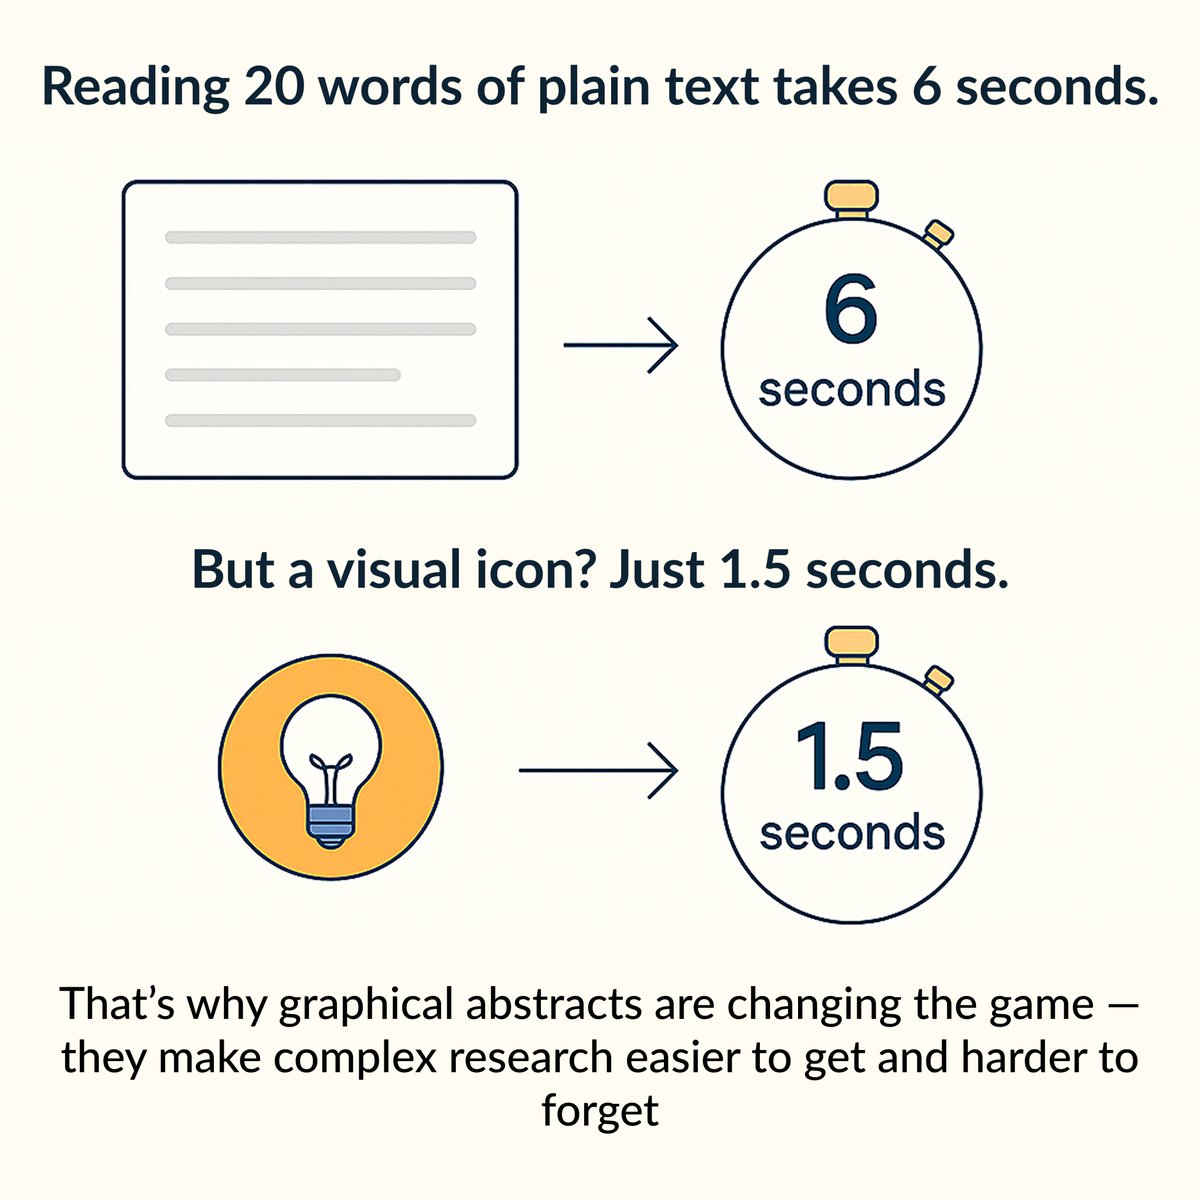
Visuals speak faster than words—and they stay longer too.
Level up your science communication with stunning graphical abstracts 🧠✨
🎨 Try Mind the Graph now: mindthegraph.com/
#MindTheGraph #ScienceDesign #AITools
1
124
5 May 2025
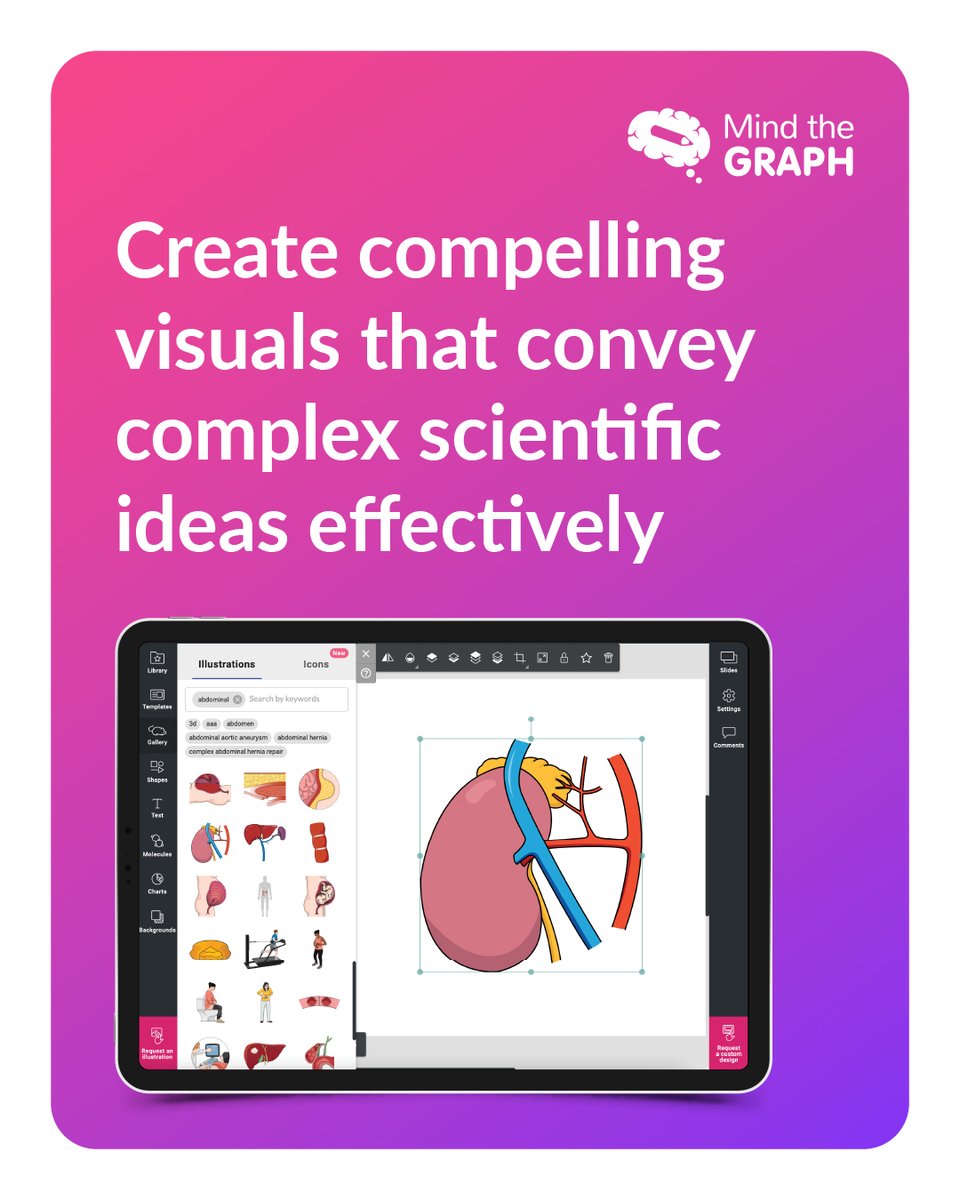
Transform Complex Science into Clear Visuals!
Scientific concepts can be intricate, but the right visuals make them accessible & engaging. From infographics to data visualizations, learn how to effectively communicate your research.
Read the blog here: mindthegraph.com/blog/graphi…
87
25 Apr 2025
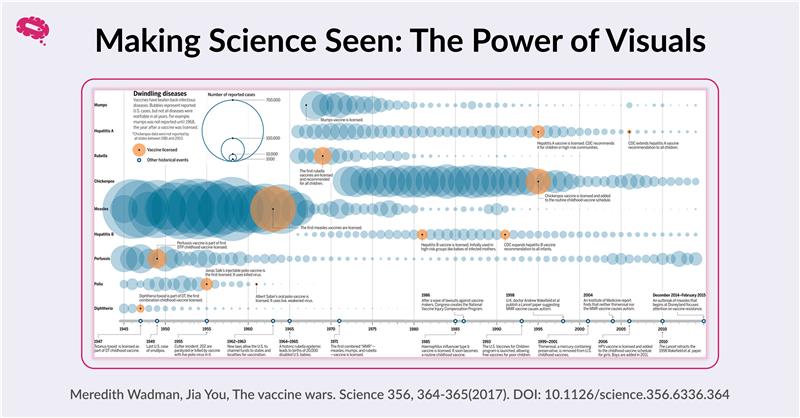
In a world flooded with opinions, clear visuals help science reach all audiences, sparking understanding and trust.
Let’s make science visible and understandable for everyone, everywhere!
Check it out here: mindthegraph.com/
#MindtheGraph #AcademicChatter #Science
1
1
95
17 Apr 2025
Did you know? 📊
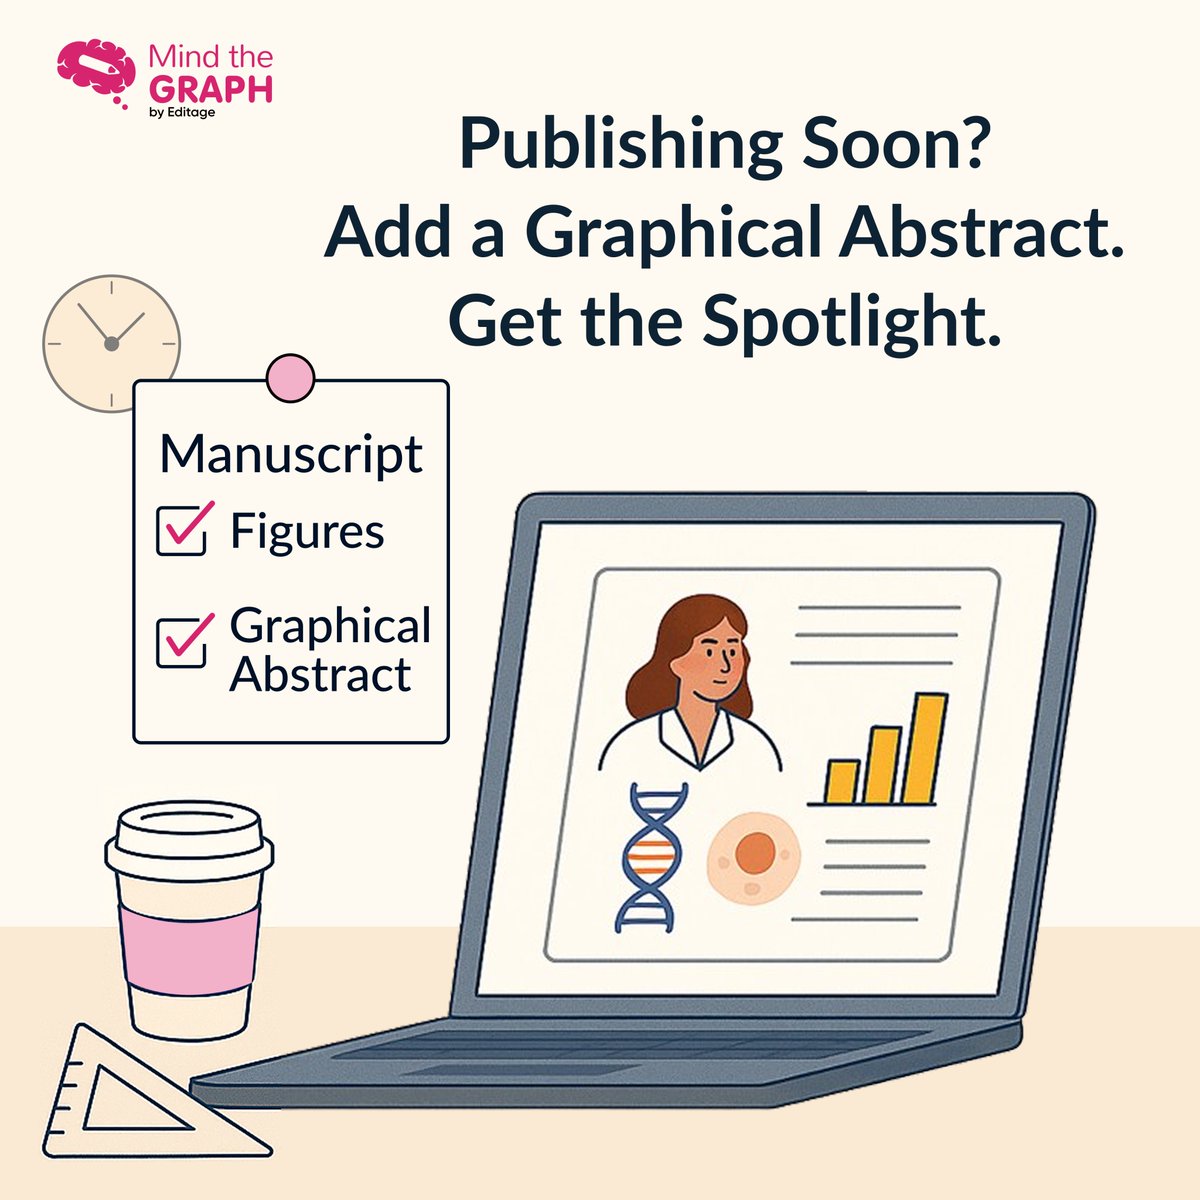
More journals—from Nature to The Lancet—now require graphical abstracts to make research more accessible and engaging.
Simplify findings, boost visibility, & meet journal needs with ease using Mind the Graph!
Try it now: mindthegraph.com/
1
227
15 Apr 2025
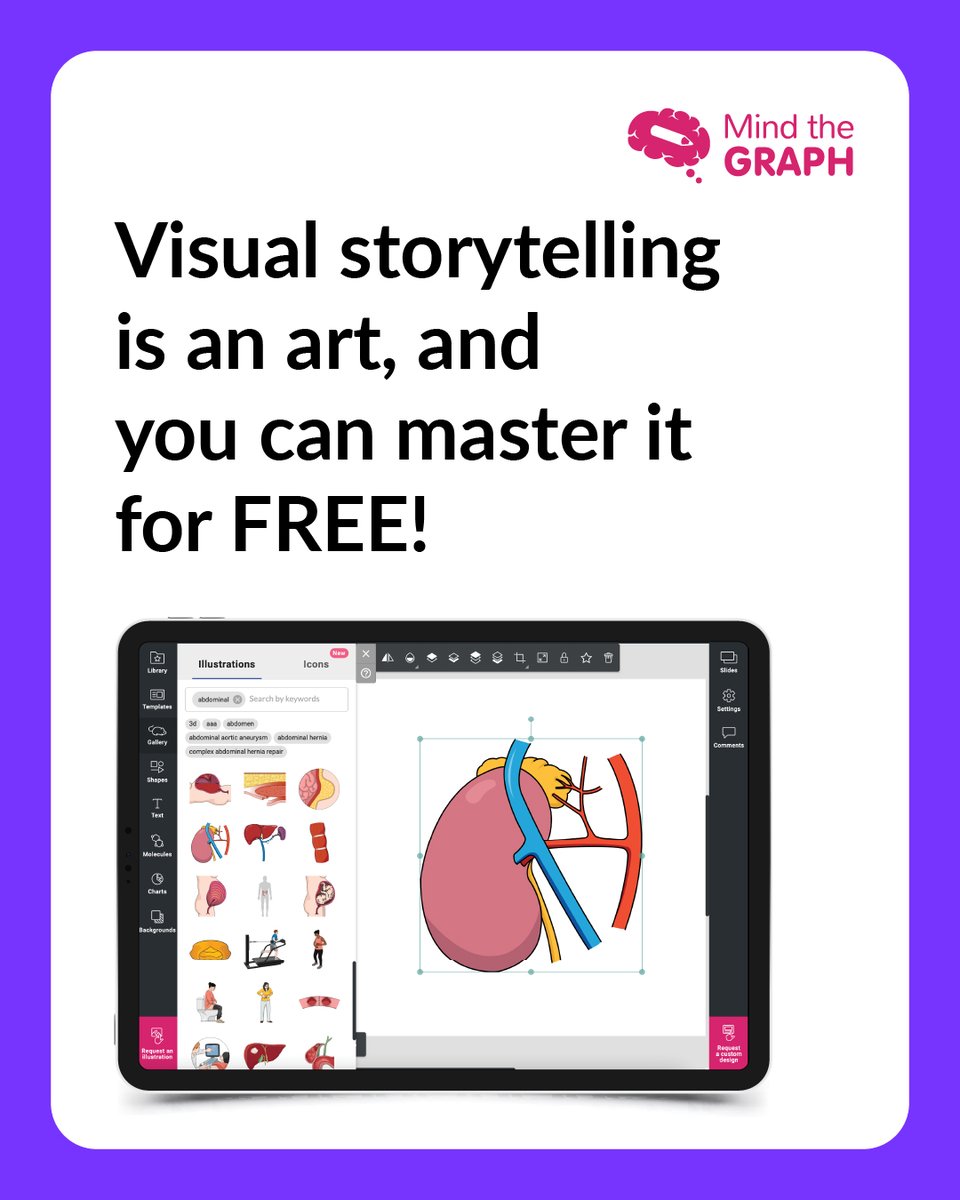
Transform complex ideas into clear, engaging visuals with Mind the Graph. Use exclusive scientific illustrations easy tools to create impactful stories. Perfect for data, presentations & more.
Start now → mindthegraph.com/
#ScienceCommunication #Infographics
1
1
122
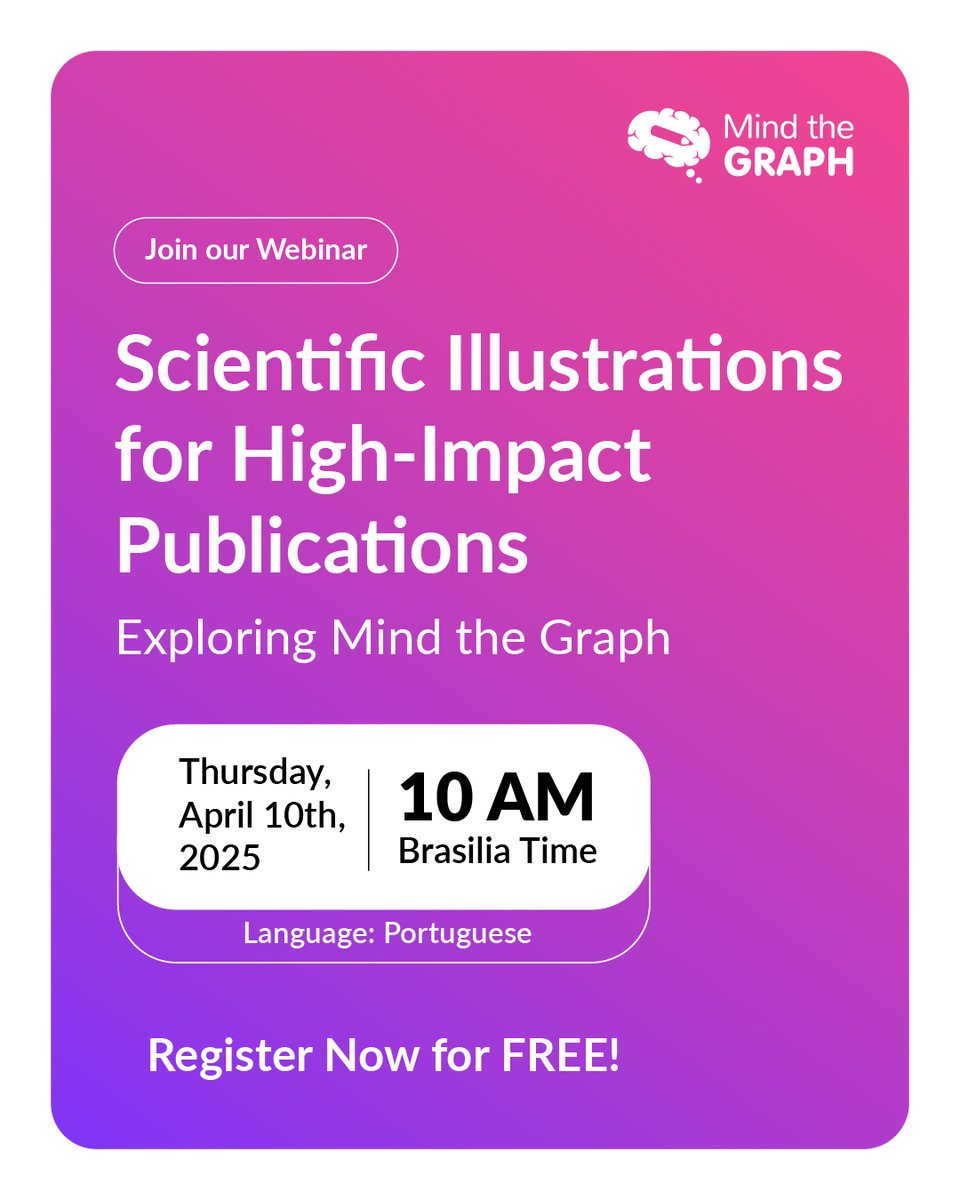
9 Apr 2025
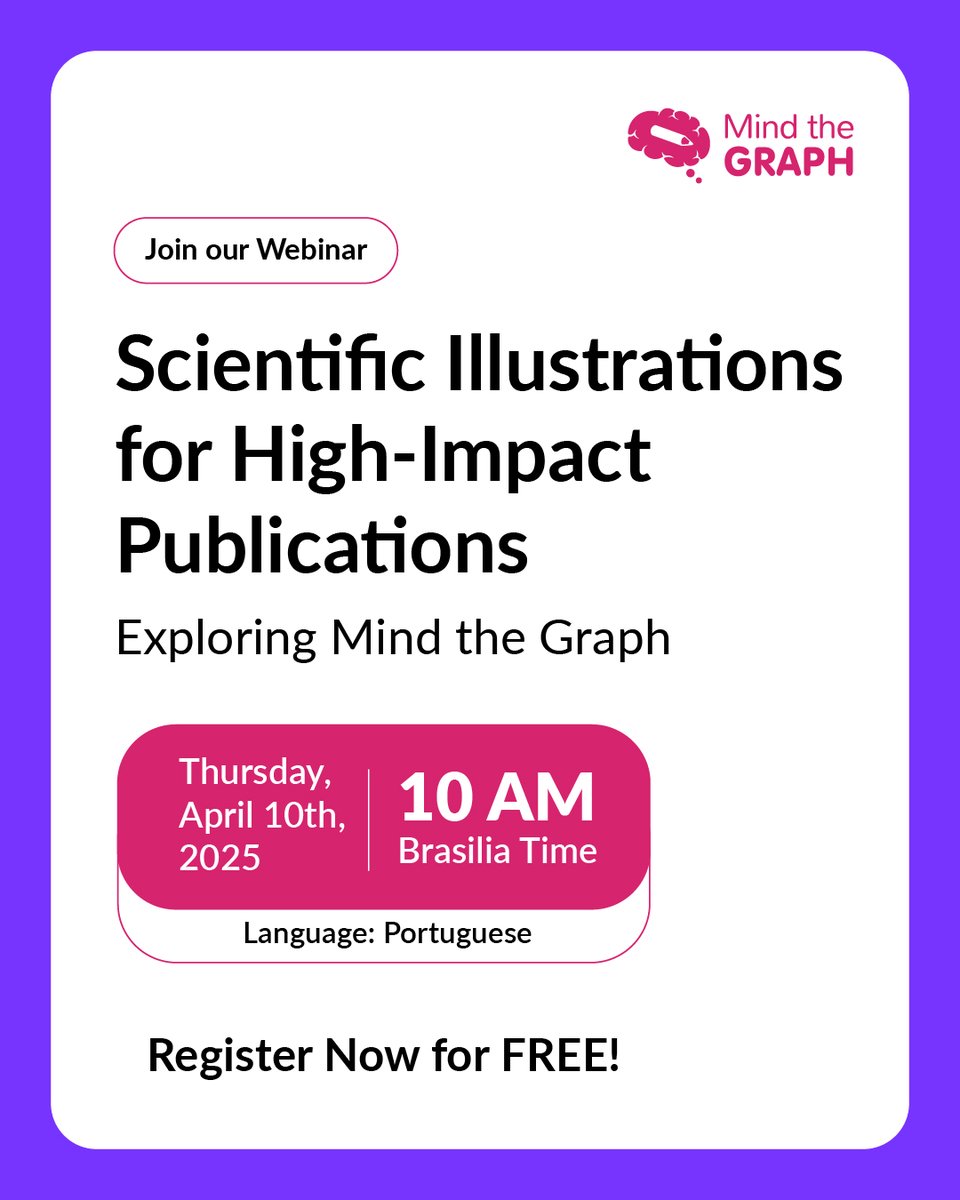
🚨Today’s the day! 🚨
🎨 Learn the visual science secrets behind high-impact publications with Sandra Bonilla, Digital Scientific Illustration Expert & Science Communicator.
🗓️ April 10 | ⏰ 10 AM Brasilia Time
Secure your spot now! Register Here: bit.ly/4j5akTM
2
1
307
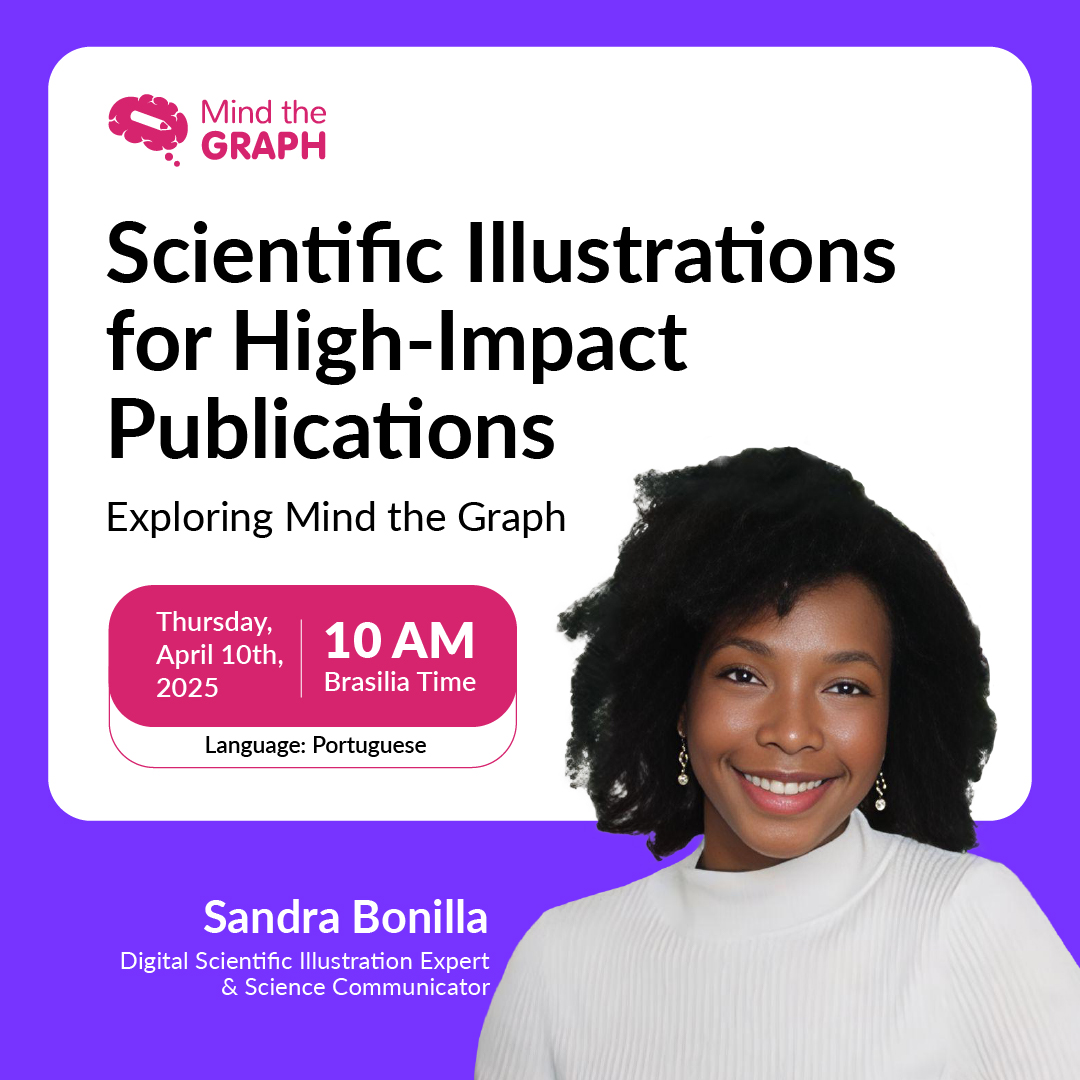
7 Apr 2025
Want your research to grab attention at first glance? 🎯
Join Sandra Bonilla, Digital Scientific Illustration Expert & Science Communicator, for an engaging workshop: "Scientific Illustrations for High-Impact Publications: Exploring Mind the Graph."
1
94
7 Apr 2025
Learn how to turn complex scientific concepts into clear, eye-catching visuals that elevate your work and improve engagement.
1
61
7 Apr 2025
📅 April 10, 2025 | ⏰ 10 AM Brasilia Time
Don’t miss this chance to discover how the right illustration can be a game-changer for your academic impact.
📌 Register now: bit.ly/44iNpzJ
#Reseach #academia #ScientificIllustrations
58
3 Apr 2025
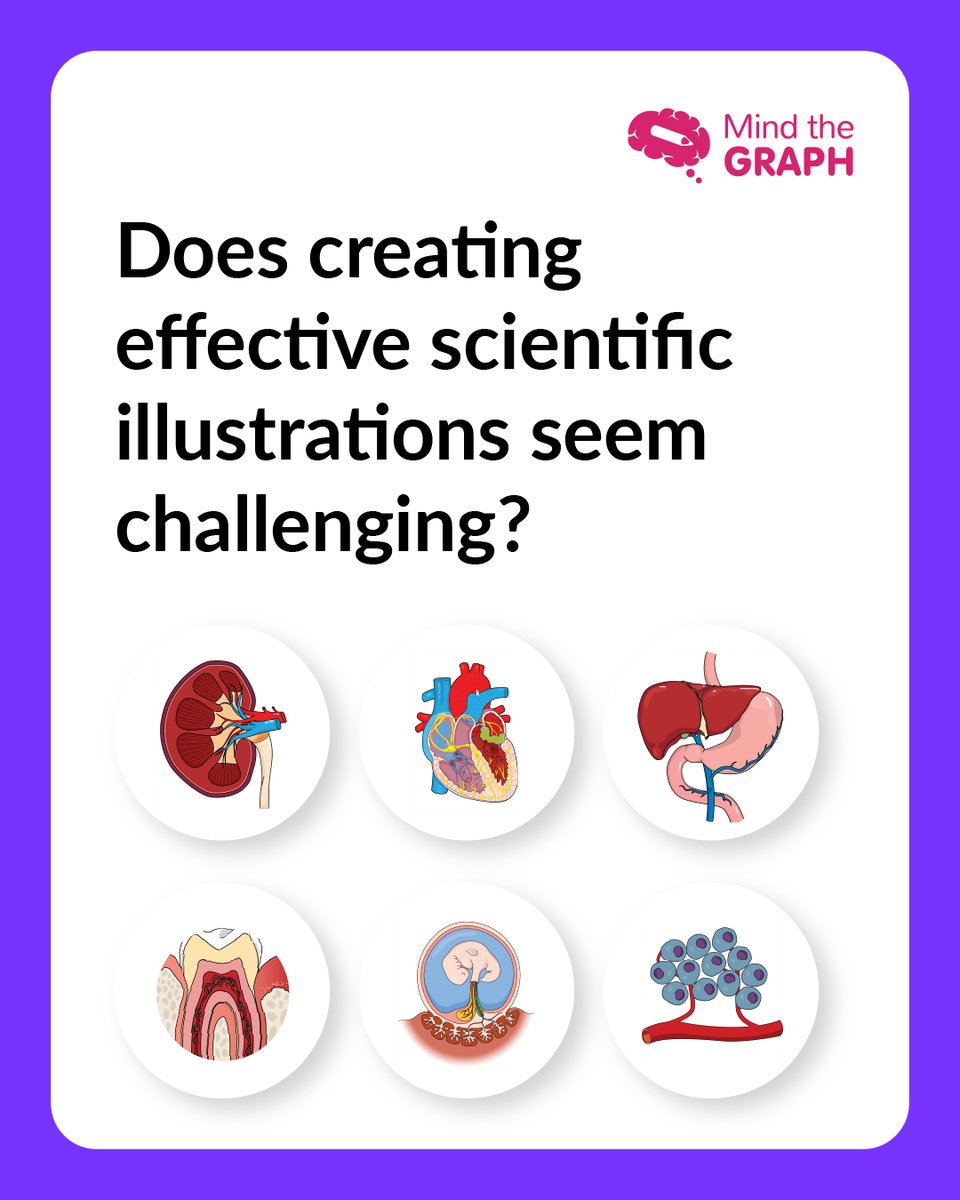
If creating impactful visuals for your research feels overwhelming, this workshop is for you!

1
2
1
224
3 Apr 2025
Join Sandra Bonilla, Digital Scientific Illustration Expert & Science Communicator, for an interactive session on "Scientific Illustrations for High-Impact Publications: Exploring Mind the Graph.

2
1
78
3 Apr 2025
Discover how the right illustrations can make your research stand out in the academic world. Don’t miss out!
Register now: bit.ly/3FSTsAR
51
1 Apr 2025
Struggling to create engaging visuals for your research?
Join us for an exclusive free webinar on “Scientific Illustrations for High-Impact Publications: Exploring Mind the Graph” with expert Sandra Bonilla!
📅Date: April 10, 2025
Register now: bit.ly/4i0PBiG
2
2
249
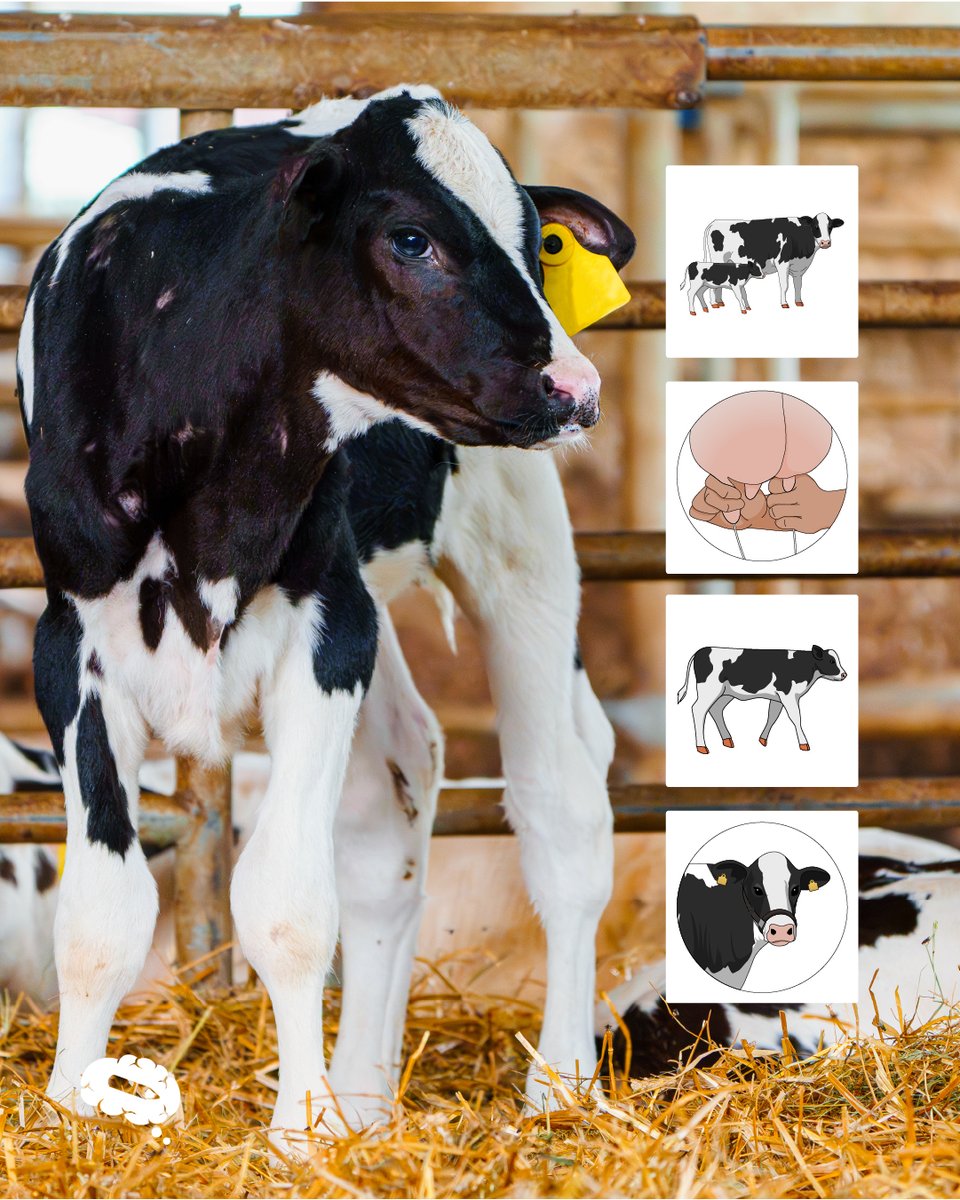
20 Feb 2025
From Zika to calf development, water pollution to tomography scans, we have the scientific illustrations you need! 🌿🧬
Explore: mindthegraph.com/illustratio…


1
1
2
101
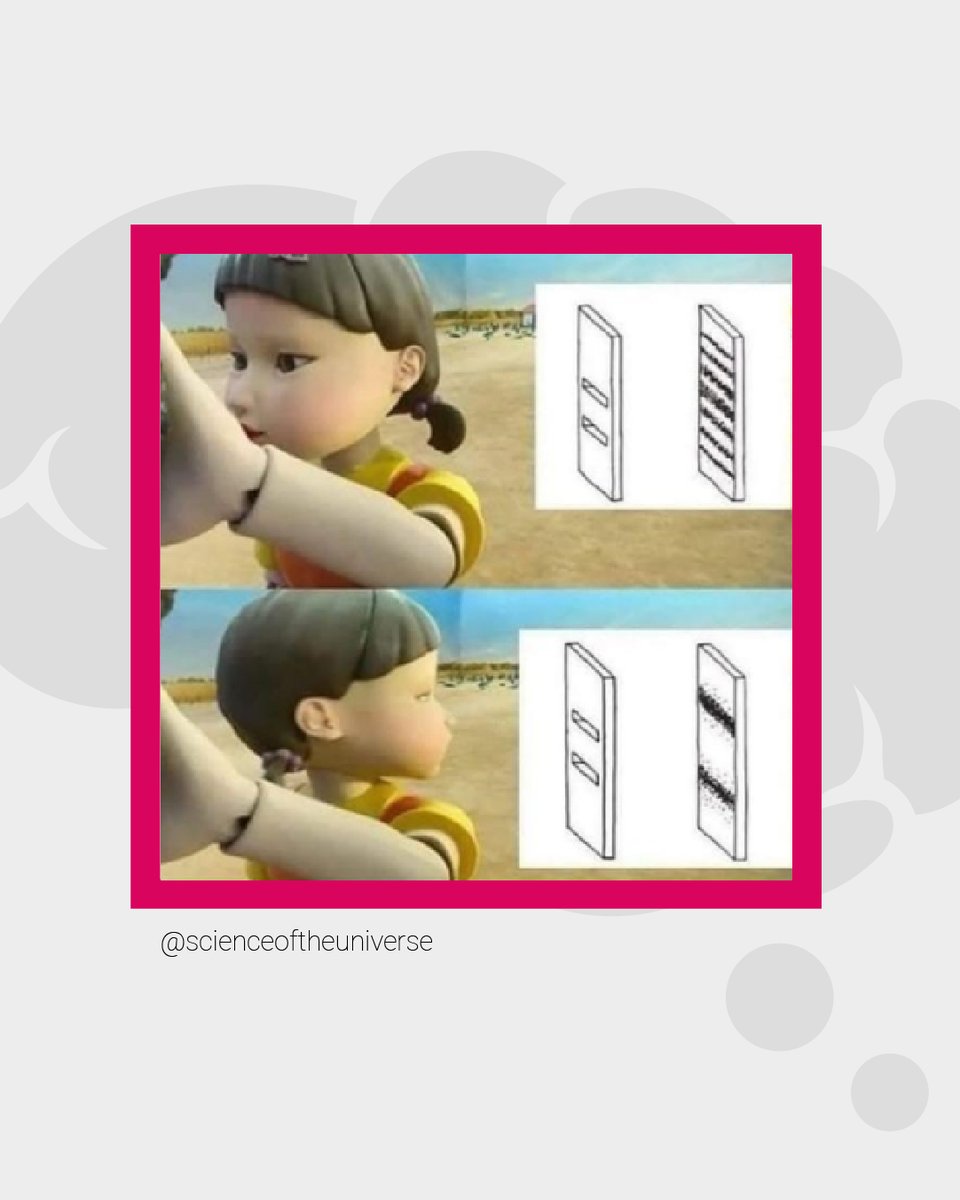
18 Feb 2025
Science humor to fuel your day of research! 🧑🔬💡
@particle_science @studymeta_008 @teabag.cartoon @scienceoftheuniverse

111
13 Feb 2025
Great writing starts with the right words! ✍️
Want to make your essays clearer and more engaging? Learn how word choice can transform your arguments and structure. Check out our latest blog post!
🔗 mindthegraph.com/blog/words-…
62