
CMT • MBA • CFP® • @MRA_Planners • Securities through @CommonwealthFN • Member finra.org sipc.org bit.ly/cfnterms
Joined September 2011
- Tweets 14,151
- Following 413
- Followers 6,864
- Likes 28,592
3,620 Photos and videos


Shane C. Murphy, CMT retweeted

Jun 9
Today on The Morning Show with @SJisrael @JC_ParetsX @sstrazza - Would you buy Apple here?
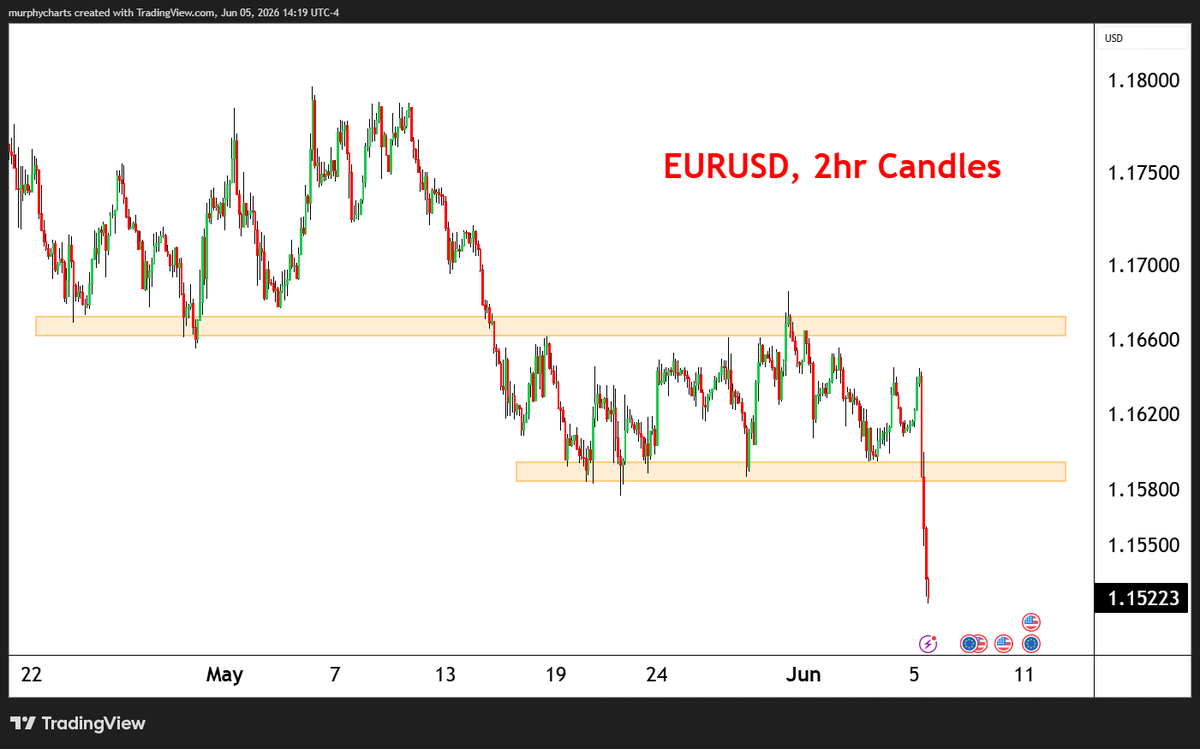
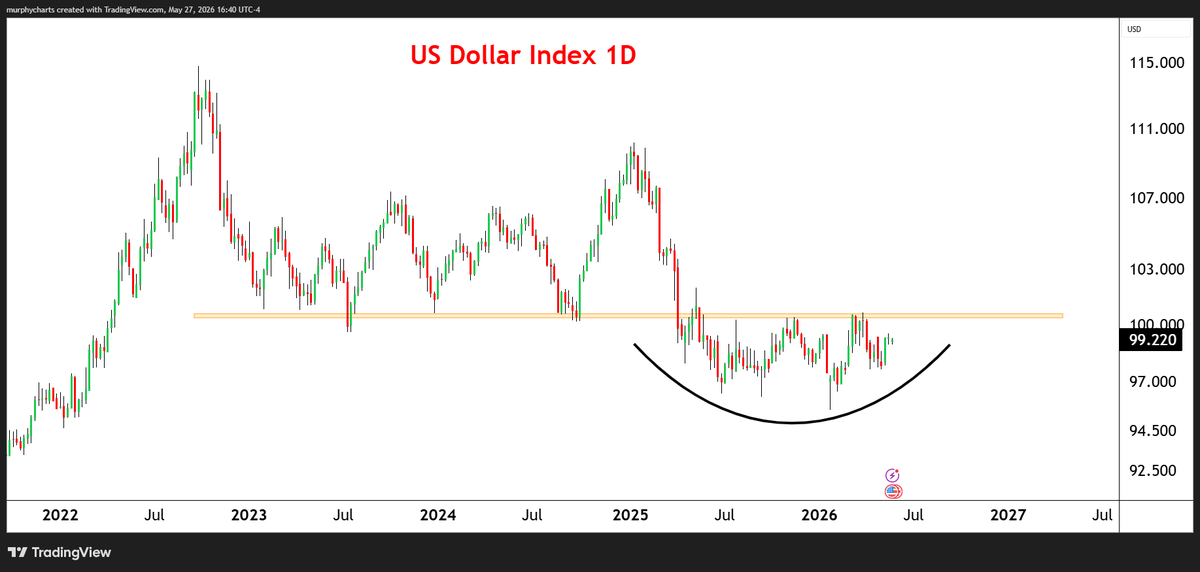
Plus @murphycharts stops by to tell us why he's taking solace in the dollar.
Live here at 8:30 ET youtube.com/live/BsFBYNR4aKc

1
4
707

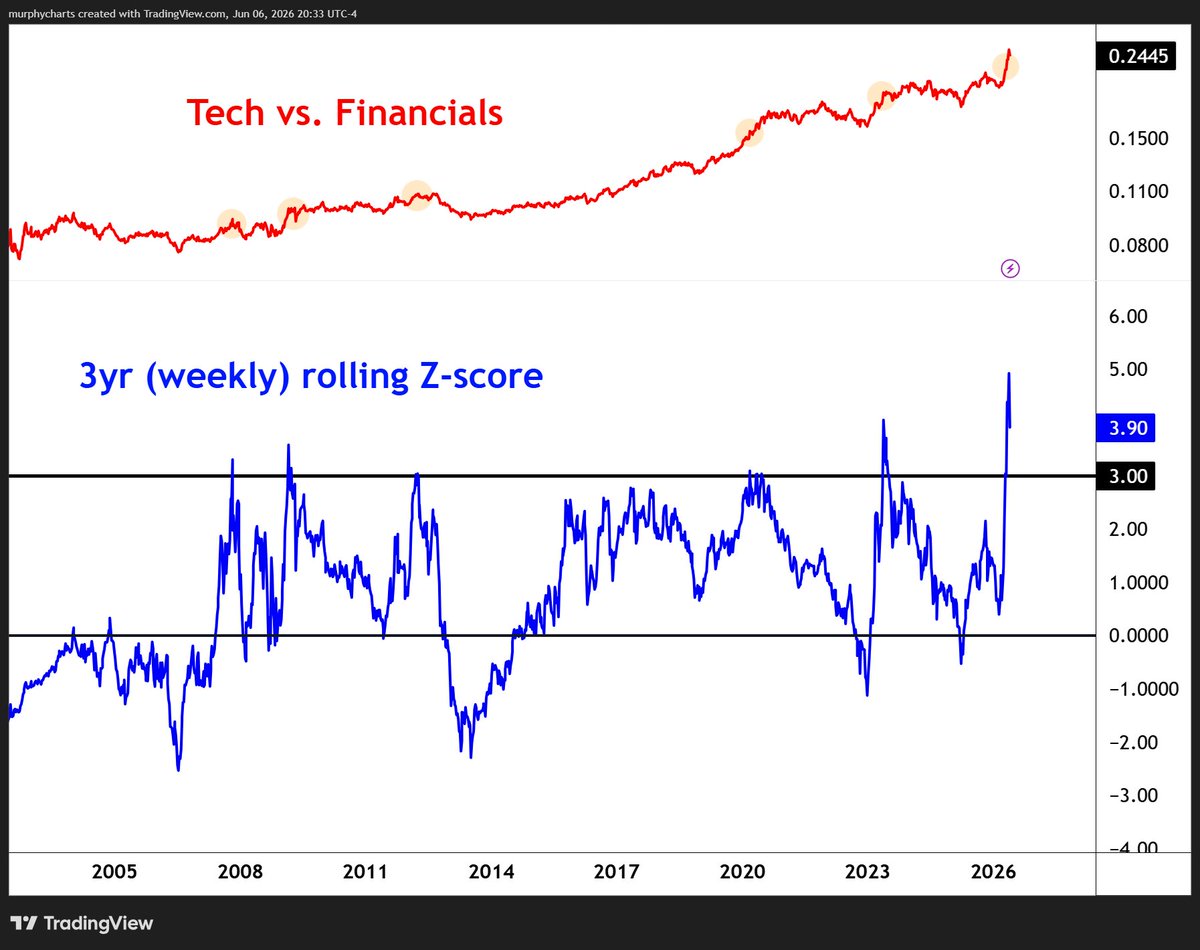
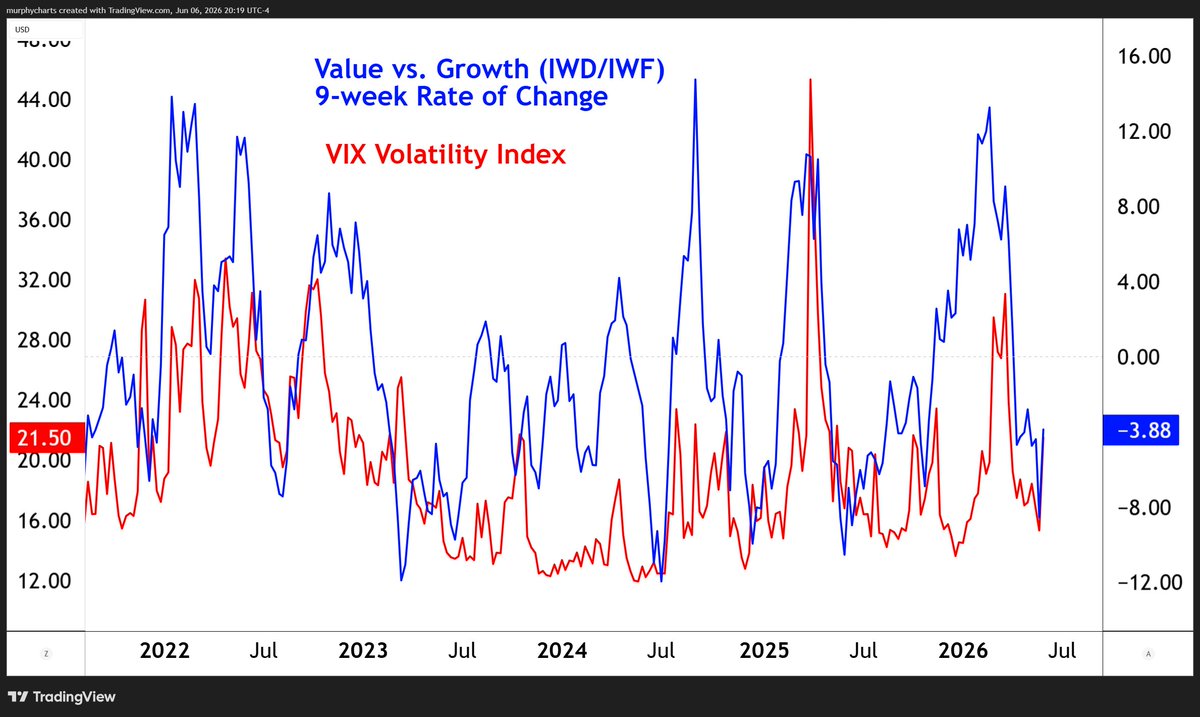
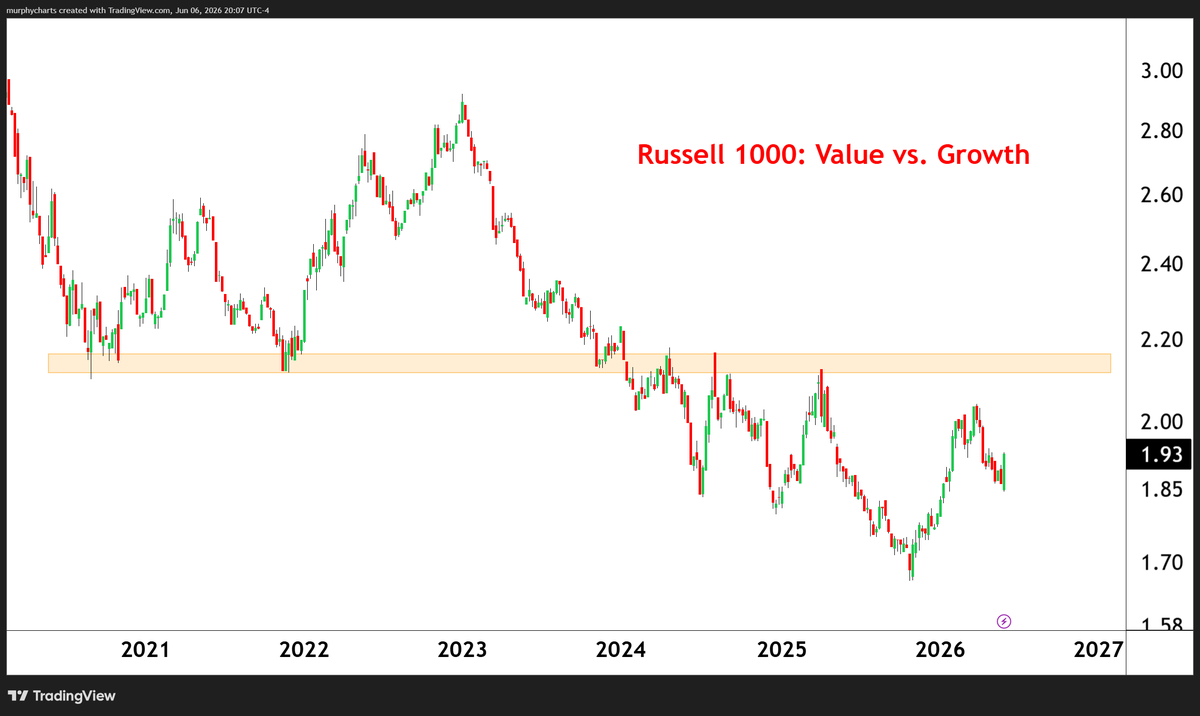
2) With the Tech sector comprising nearly 40% of the S&P 500 Index and over 50% of the Growth Index, spikes in the $VIX have corresponded with Value leading Growth.
4
4
633
I don't think technicals on crypto could get any worse. That's the tough thing about 'basing/accumulation patterns' within an existing downtrend - the chart can go from constructive to absolute dog shit in a matter of weeks.

Make or break time for bitcoin:native 📊📈
1
1
627
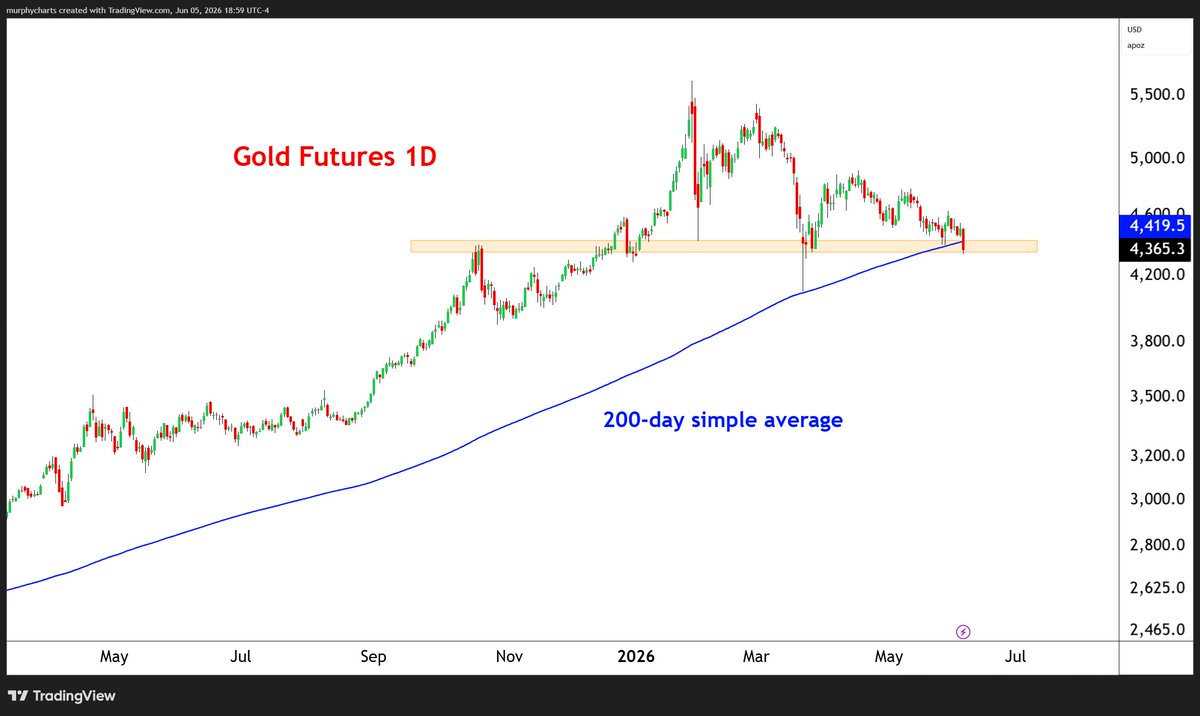
Gold Futures $GC_F
First close below the 200-day average since Nov '23. 4400 is a level of real confluence, evidenced by the 200-day average and well-tested supply/demand zones. The yellow metal is now flat (-0.02%) year-to-date, erasing a once 25% gain.
2
4
25
2,247

1
3
392
No Vol vs. Low Vol
S&P 500 Low Vol $SPLV compounded at 5.58% over the last 5yrs, Cash at 3.44%. Tough look!
4
365
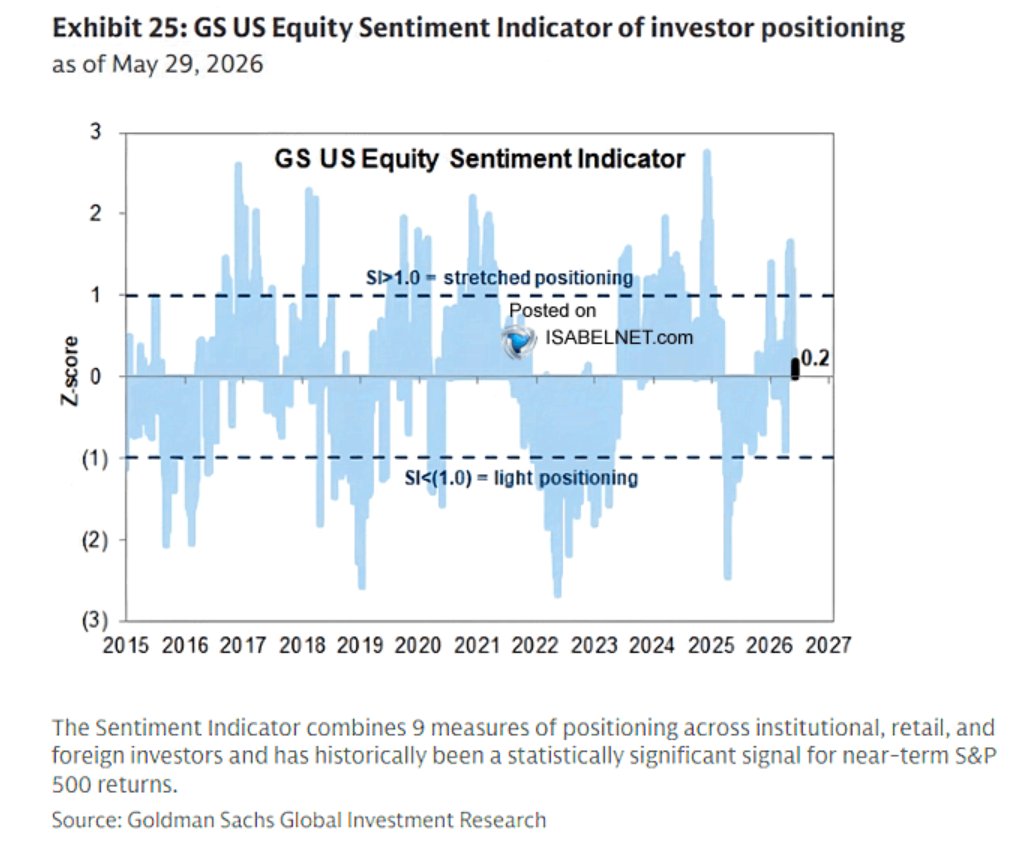
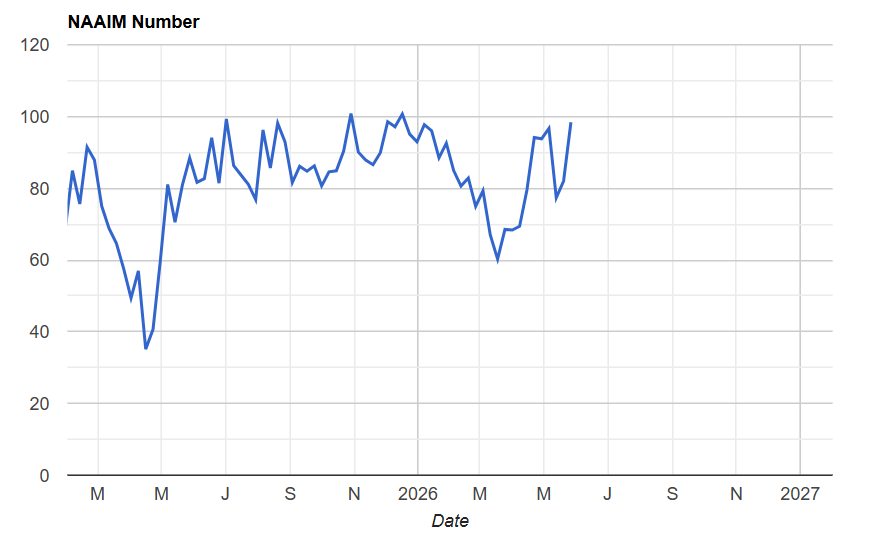
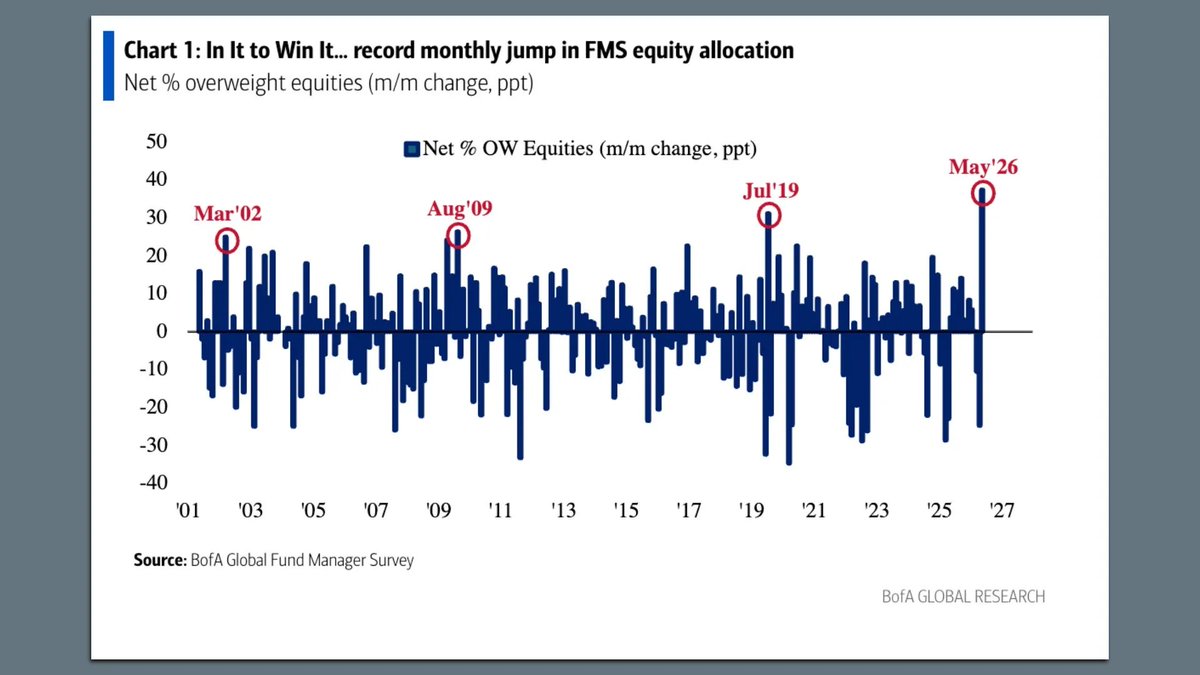
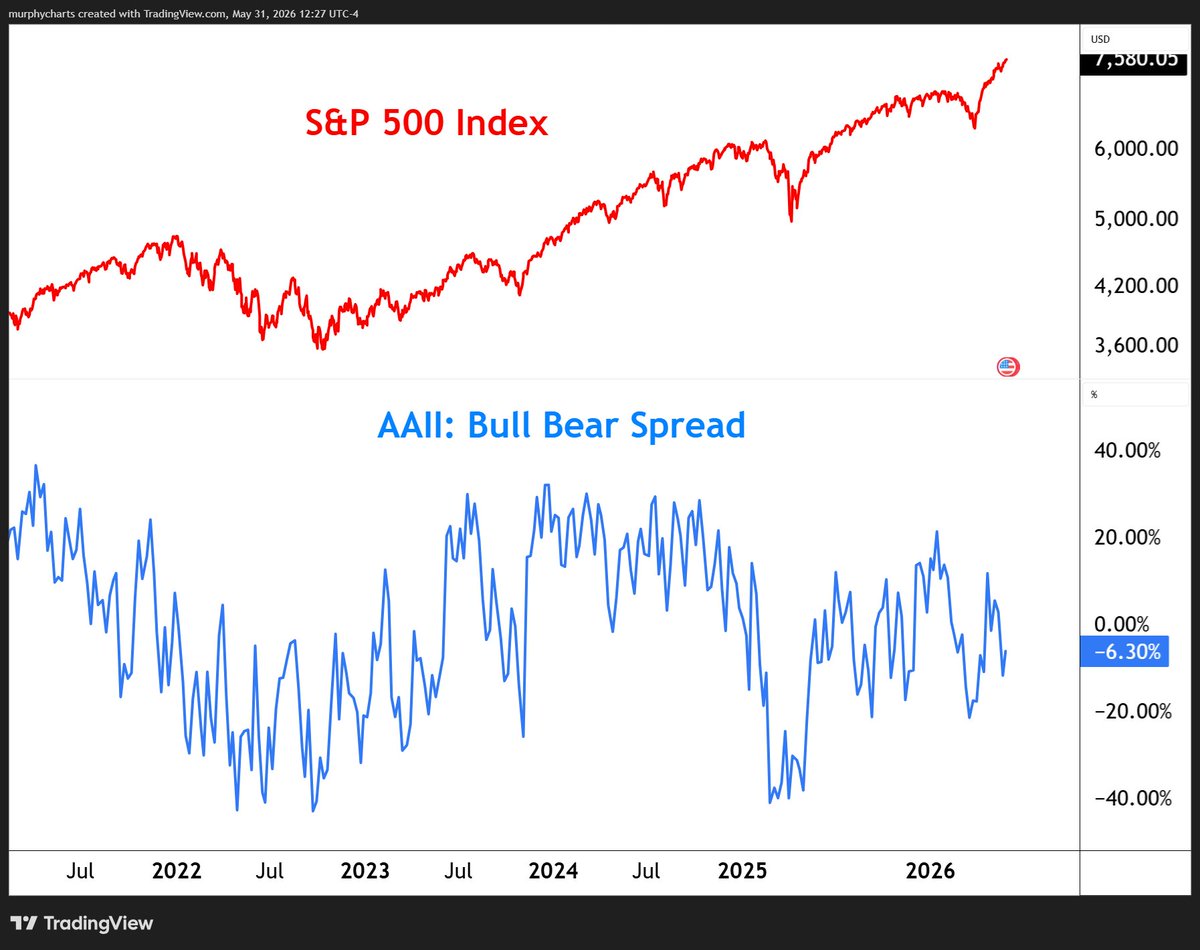
Positioning metrics remain mixed.
GS US Equity Sentiment Index: ~0.2, neutral.
AAII: Bulls 35.6% (below 37.5% avg) / Bears 41.9% (above 31% avg) - retail remains skeptical IMO.
NAAIM: 98.39 - active managers are fully loaded.
BofA FMS: Equity allocation jumped to 50% OW.
$BULLISH $BEARISH $SPY $NDX
1
10
706
2
391
Shane C. Murphy, CMT retweeted

We’ve come a long way from people freaking out during Brexit 2016 when robo-advisor Betterment paused trading proactively.
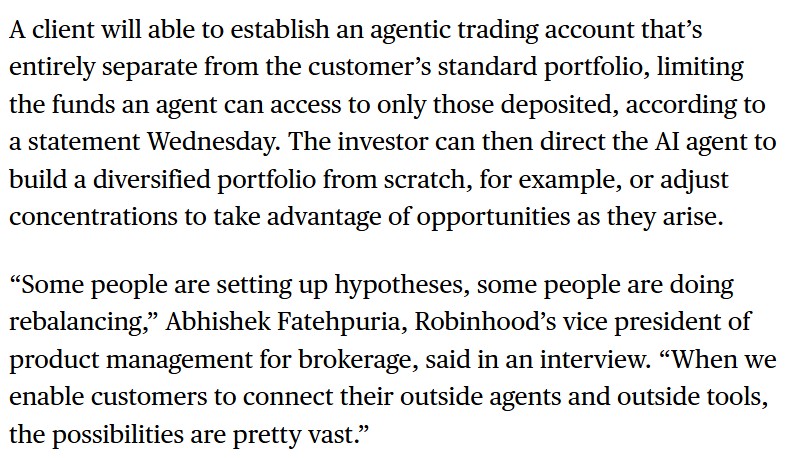
Now we’re rolling out AI agents to manage retail brokerage portfolios en-masse.
What a difference 10 years make

May 27

Robinhood will soon allow users to set up AI agents that trade stocks on their behalf bloomberg.com/news/articles/…
1
5
2,575
The market is riding two horses simultaneously! A stellar earnings cycle AND elevated multiples. This is a bull market as pure as they come. But with stocks priced to near perfection per the Fed Model, higher yields could force a stock market re-rating. This is tail risk #1 IMO.
May 29

We know that inflation is less driven by commodity prices than in the past, but the chart below shows that goods inflation still matters. When the 5-year CAGR of the Bloomberg Commodity Spot Index is consistently above the 5-year inflation rate, it tends to “pull” the CPI higher.
All of this suggests that while it’s important to celebrate the epic earnings cycle we are in, we shouldn’t forget the valuation risks if bonds enter the 5% danger zone and the Fed Model takes its revenge. Price is at the intersection of earnings and valuation.

2
526
Shane C. Murphy, CMT retweeted

Damn you, OpenAI

13
1
47
12,801
2
1
12
662