
BI team lead and #dataviz enthusiast🥰 | x2 VOTD | Tableau, SQL, R and everything that I find interesting💫
Joined February 2013
- Tweets 388
- Following 377
- Followers 358
- Likes 446
147 Photos and videos


Pinned Tweet

1 Aug 2024
Finalized @tableaupublic dashboard template I’ve wanted to do for months!
It's a free-to-use, pre-built template with containers. Just copy all your charts to the template and easily put them on the dashboard💫
public.tableau.com/app/profi…
#datafam #tableau #dataviz #dashboard #bi

14
652
6 Oct 2025
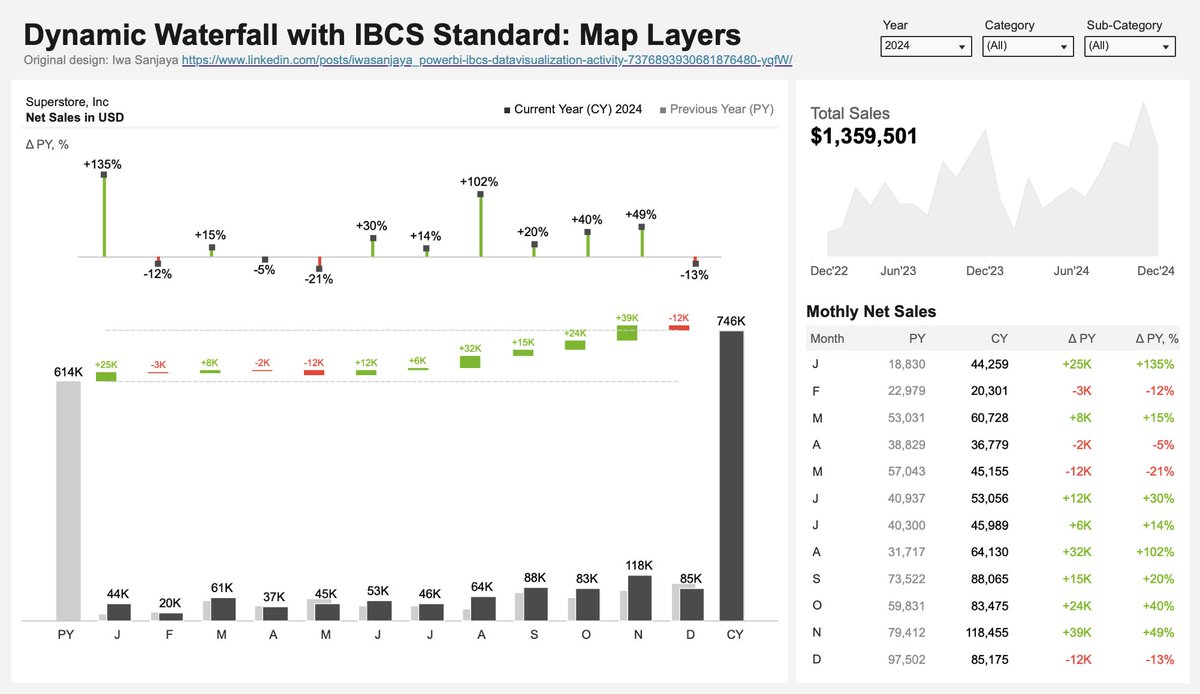
Waterfall with IBCS standard: me and @tableau , map layers and lots of lod calcs…
#dataviz #datafam #tableau
public.tableau.com/app/profi…
6
258
23 Sep 2025
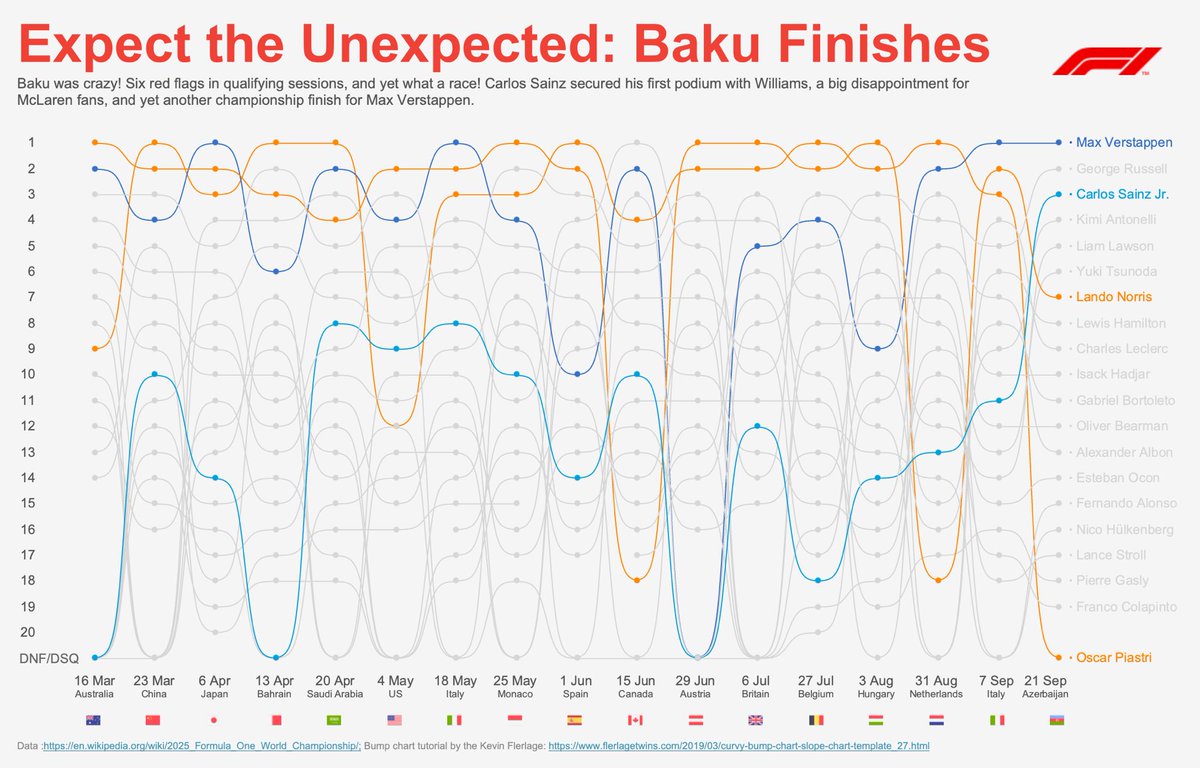
Last week my dream came true, and I had the opportunity to visit the F1 race in Baku 🏎
What a race!! Two of my favorite drivers were on the podium. And listening to the whole grandstand sing Smooth Operator — priceless ❤️
#datafam #tableau #dataviz #sportsvizsunday
1
1
12
216
23 Jun 2025
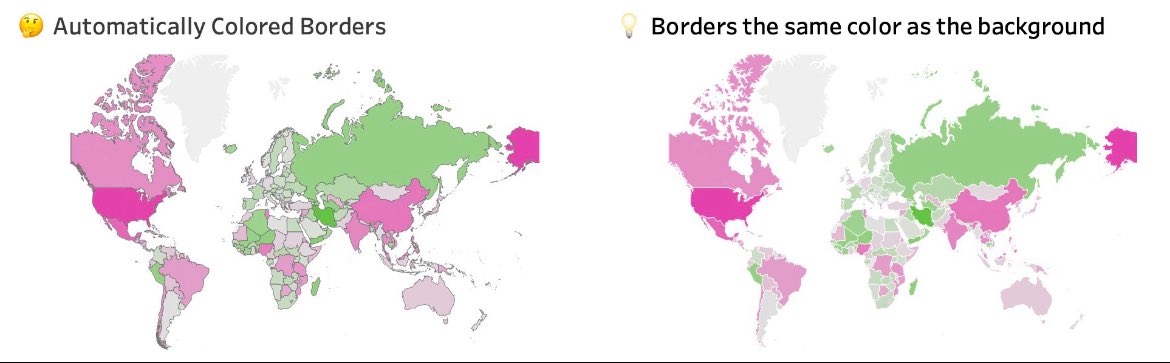
Color borders for cleaner maps 💡
I found this lifehack years ago, and it's been my go-to move with maps ever since. Every time you create a map, try coloring the borders the same color as your background.
#tableauhack #tableau #dataviz #datafam
1
2
13
558
Anastasiya retweeted

10 Jun 2025
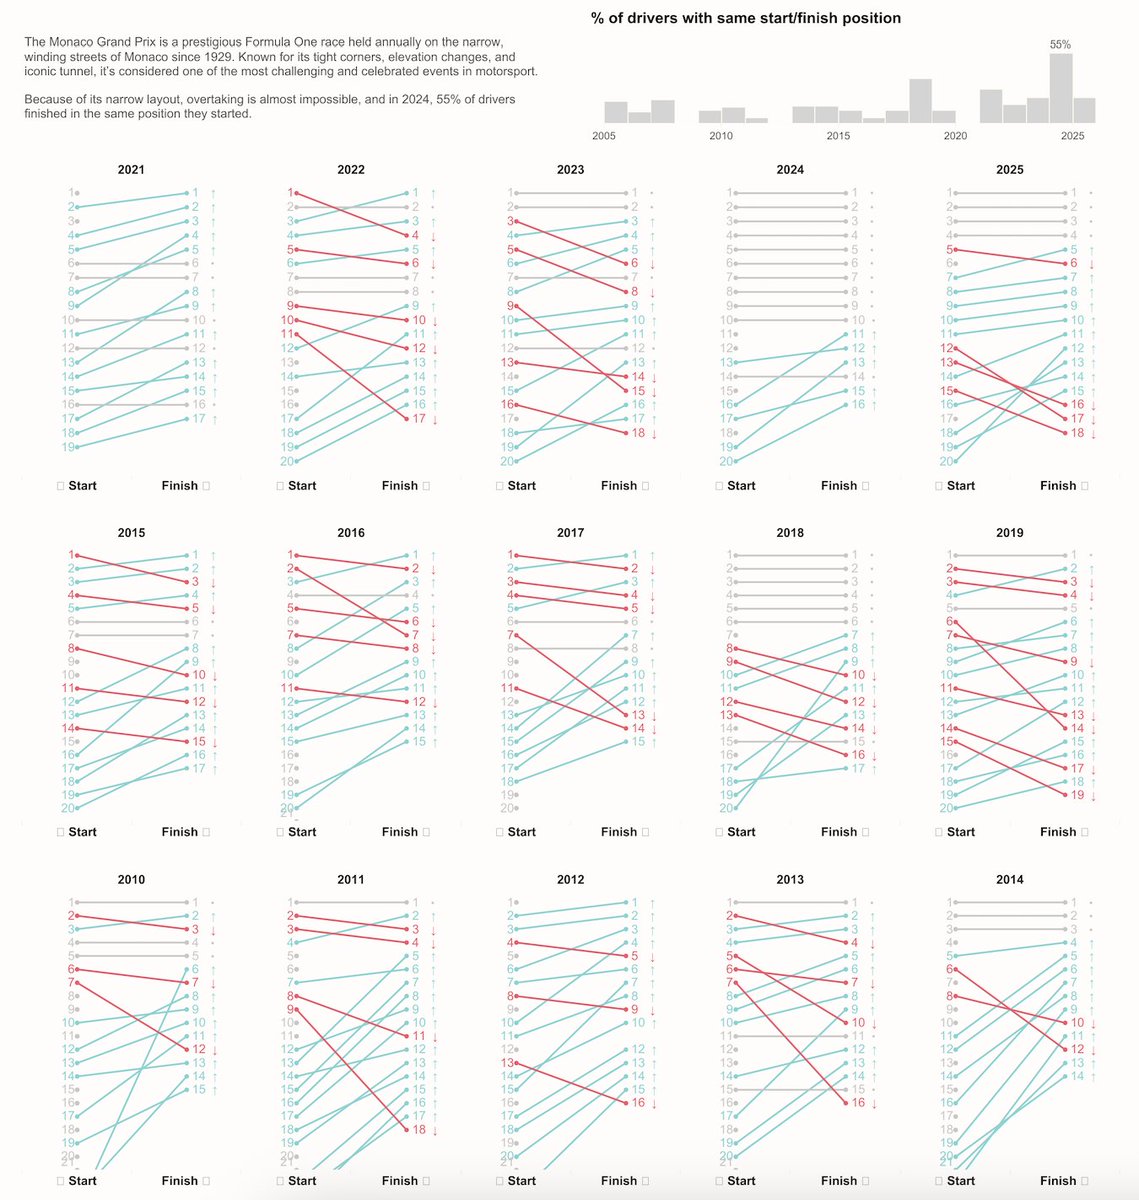
Explore this #VizOfTheDay by Anastasiia Kuznetsova, using slope graphs to show start vs. finish positions in a global single-seater race. tabsoft.co/3HyZIyI
2
3
34
3,448
1 Jun 2025
Boring Monaco? In this #dataviz, I look back at 20 years of the Monaco GP and analyze how often drivers finish in the same position they started.
public.tableau.com/app/profi…
#sportsvizsunday #datafam
1
1
40
727
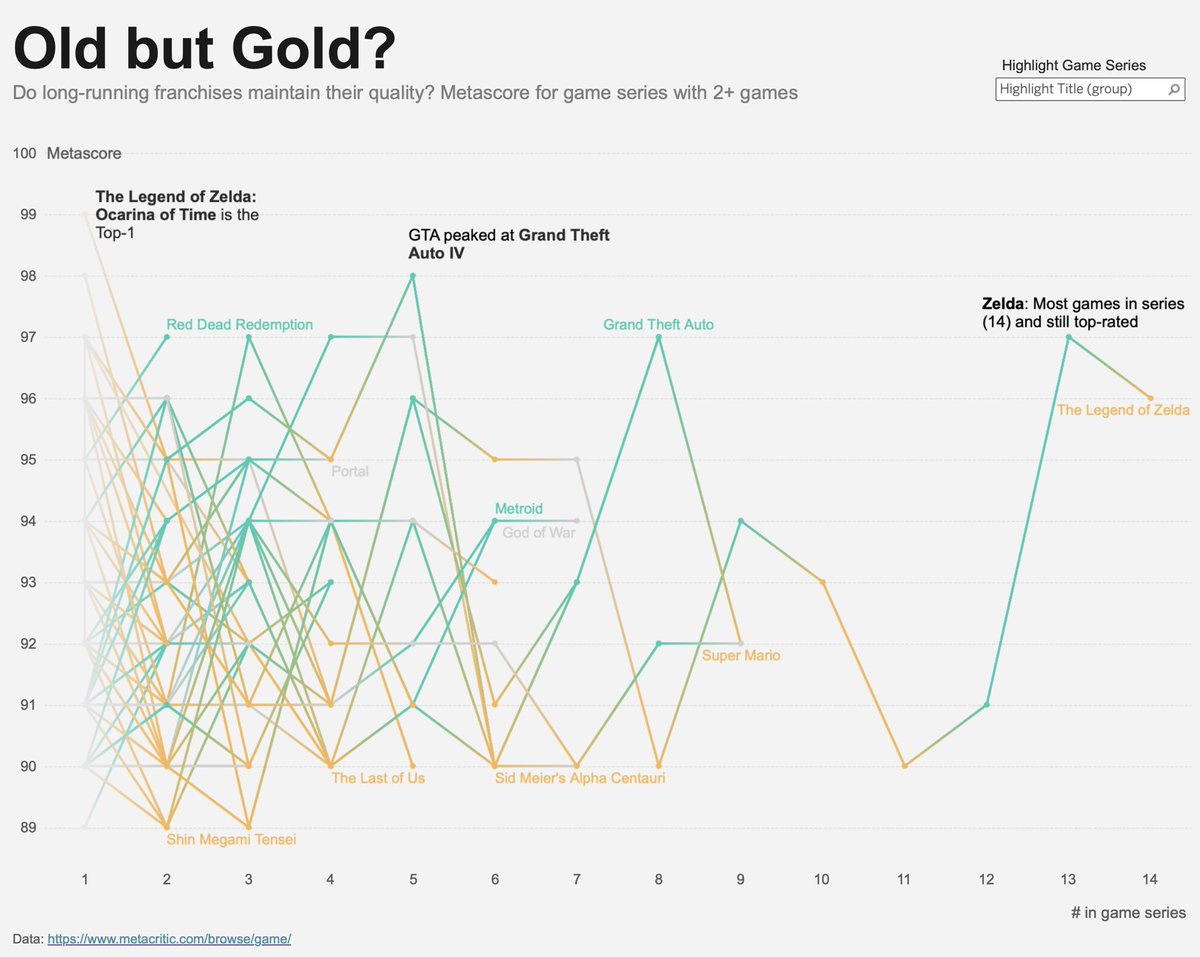
22 May 2025
For this #makeovermonday I’ve tire to looks at the metascores for different game series. Game series groups were done manually so I really hope i didn’t make any big mistakes 🙈
#dataviz #datafam
10
241
23 Apr 2025
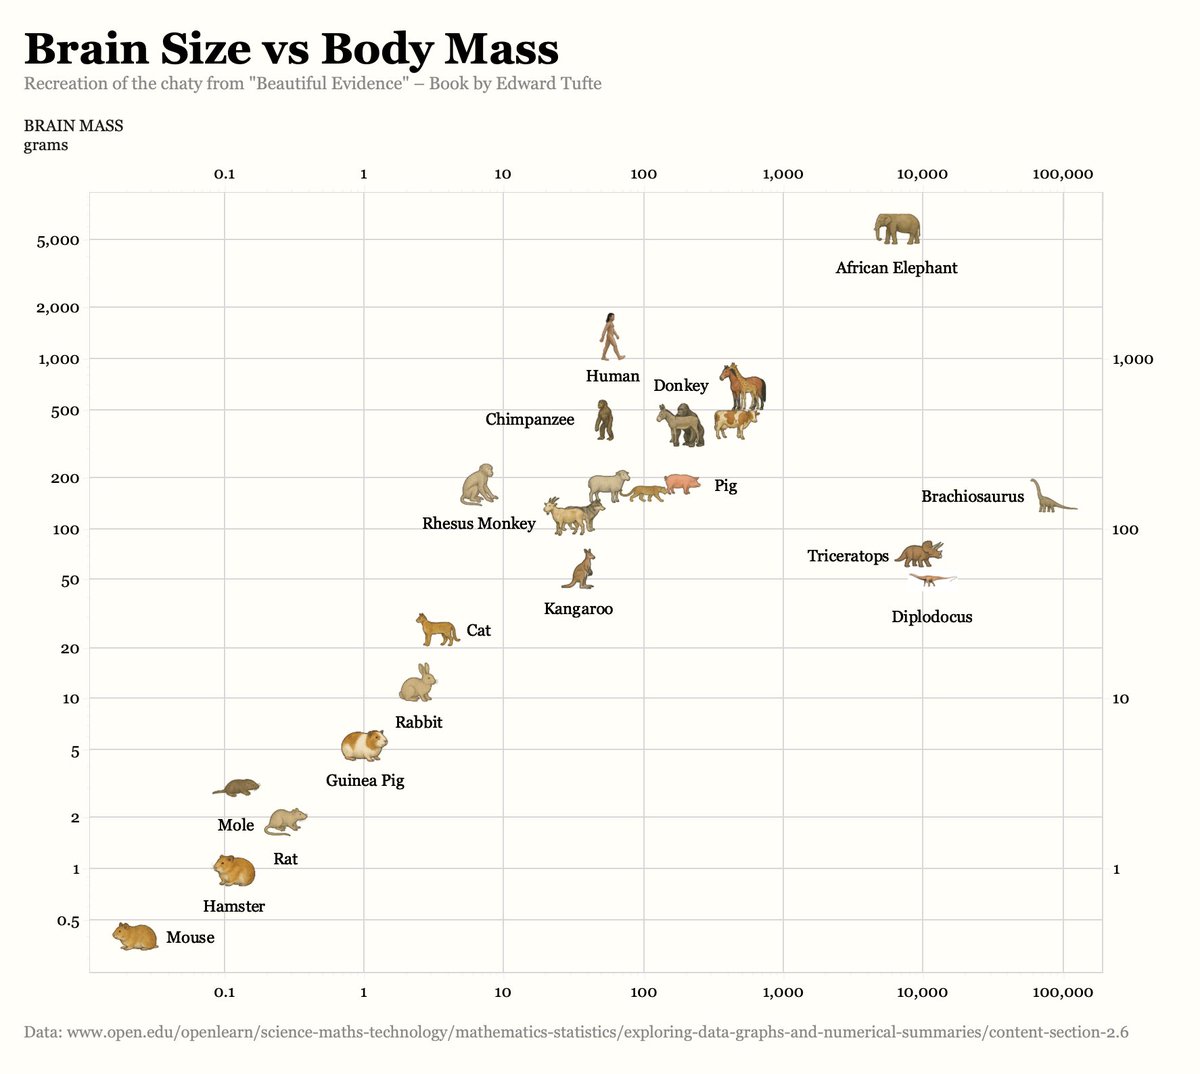
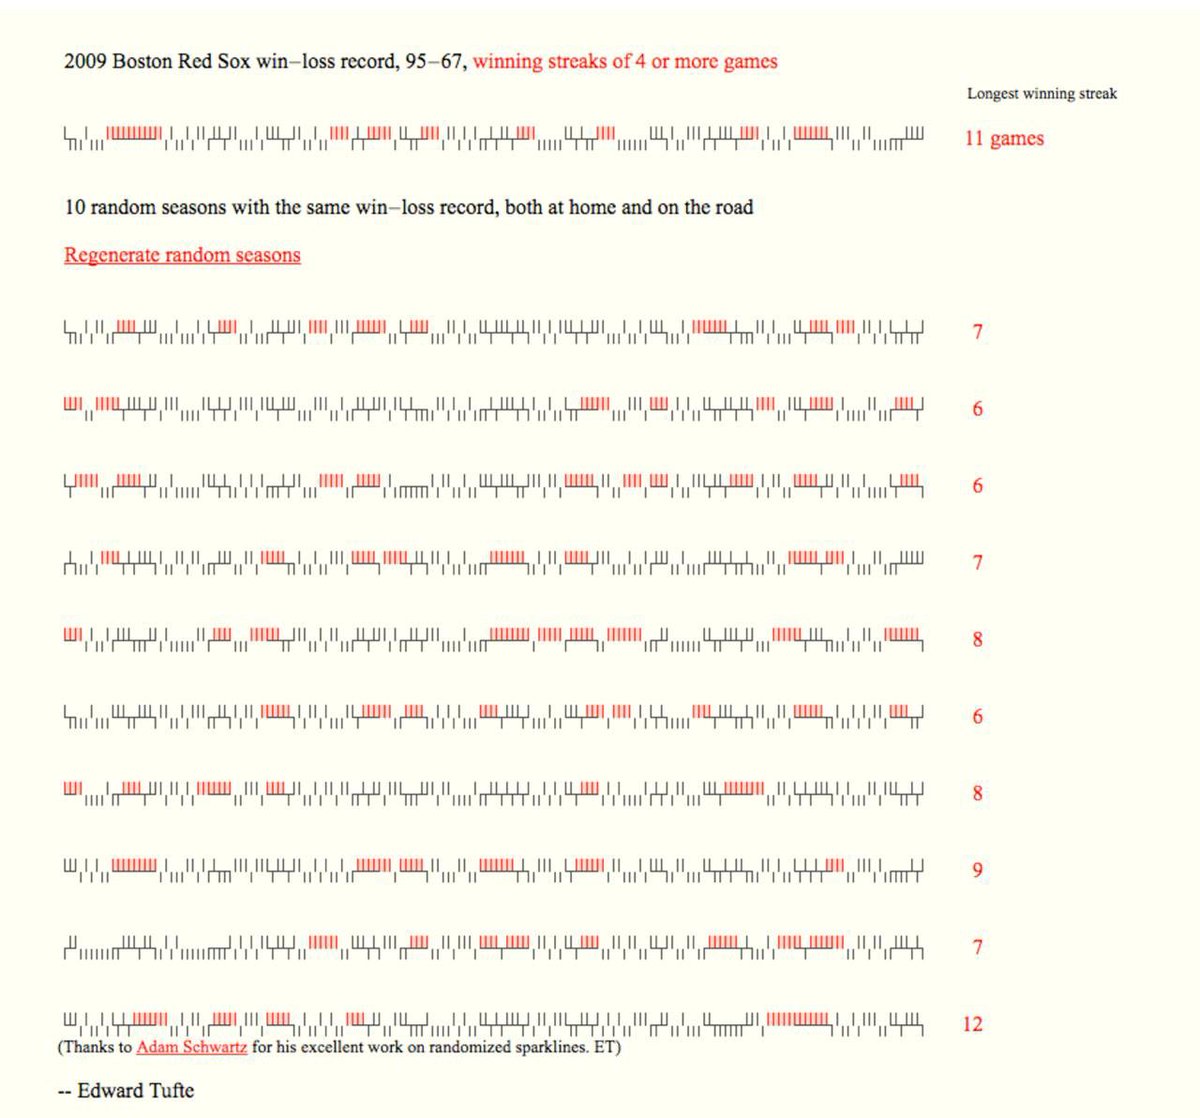
#30DayChartChallenge – Log Scale
I wanted to create something similar to the famous scatterplot from Edward Tufte’s book Beautiful Evidence. For me, it’s the best showcase of the log scale.
Creating the images was the hardest part.
2
11
362
22 Apr 2025
Stellar Scale: How Far, How Bright? 💫
A visual comparison of 174 visually brightest stars for hashtag#30DayChartChallenge - Stars
5
201
21 Apr 2025
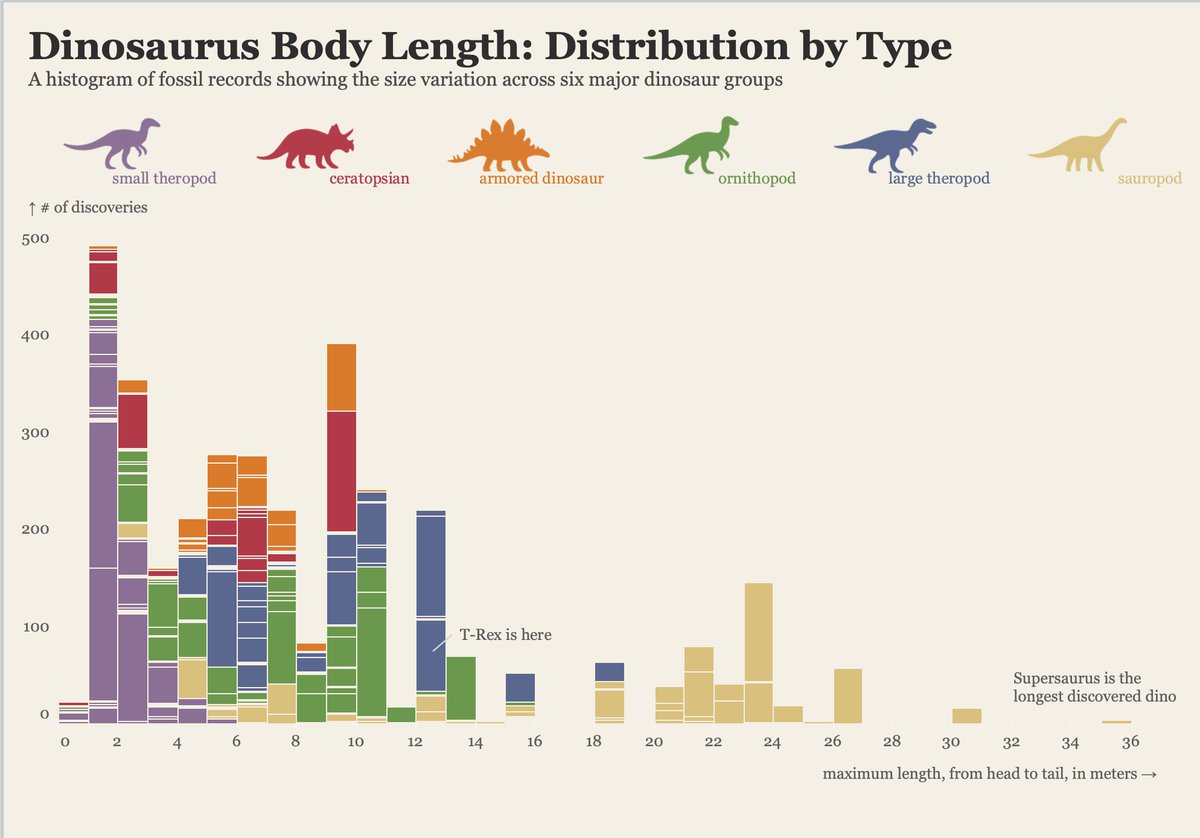
#30DayChartChallenge
It's never too late 😅 Trying to still particpate at the #30DayChartChallenge, today about fossils.
A histogram of dciovered dinosaurus body lengths
24
370
24 Mar 2025
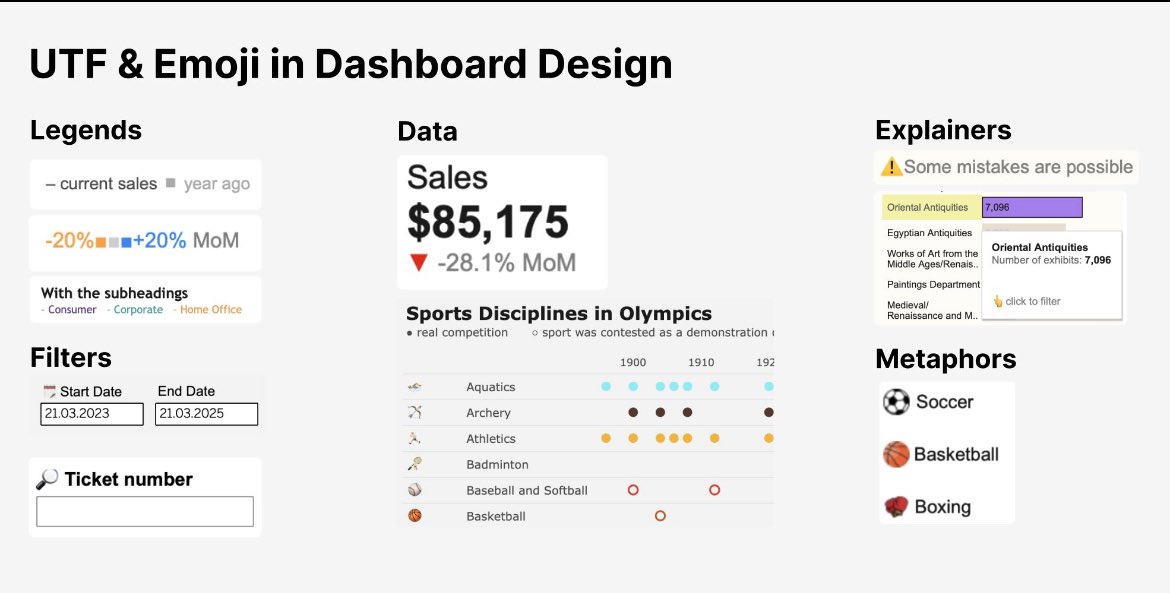
UTF and emojis in dashboard design
Wrote a bigger post in LinkedIn linkedin.com/posts/nastengra…
#dataviz #datafam #tableau #dashboards
2
13
393
Anastasiya retweeted

23 Mar 2025
The #DataFamRisingStars 2025 are live! 90 standout Tableau innovators from 17 countries are shaping the future of #DataViz #DataFam. Thanks to all nominators who keep this community thriving. 🔗adammico.medium.com/datafam-…

15
40
140
73,808
Anastasiya retweeted
26 Feb 2025
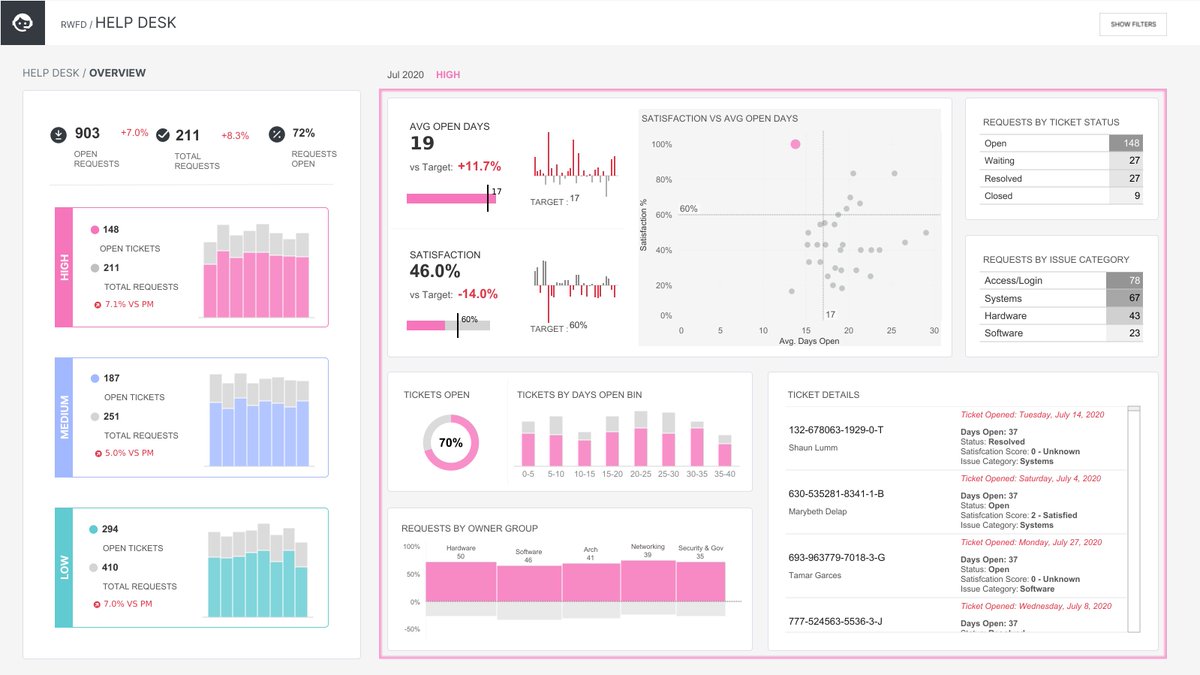
See how @saddykinss visualizes help desk metrics in this #VizOfTheDay.
This business dashboard is an entry to the Community-led project Real World Fake Data #RWFD.
tabsoft.co/3Y8KiaK
6
7
91
5,801
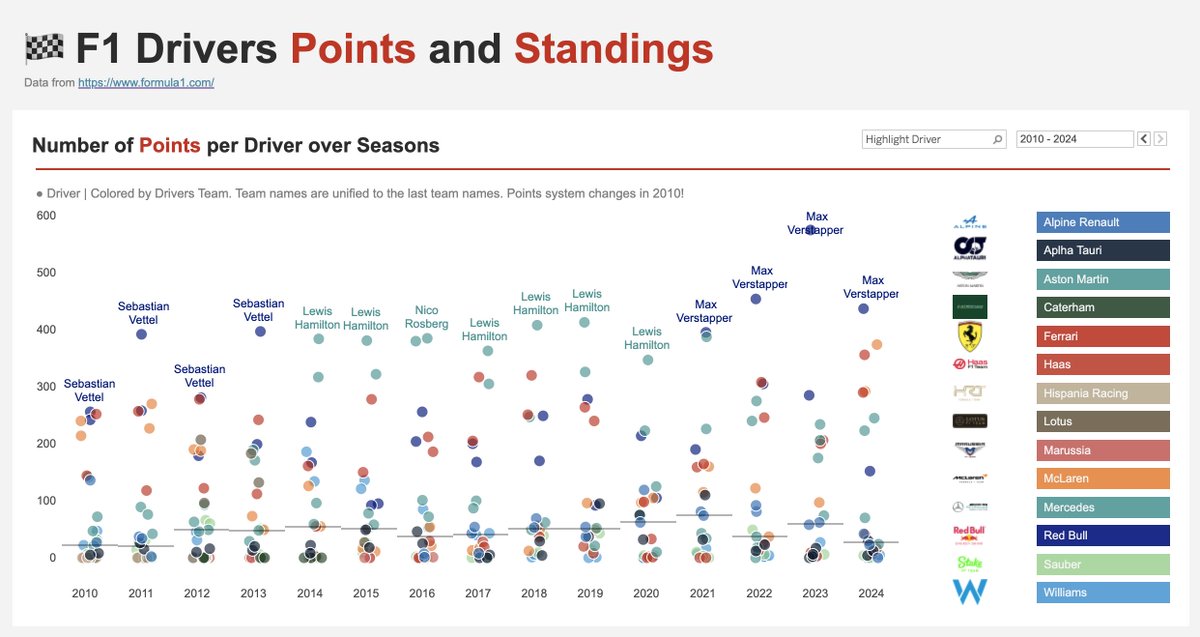
22 Feb 2025
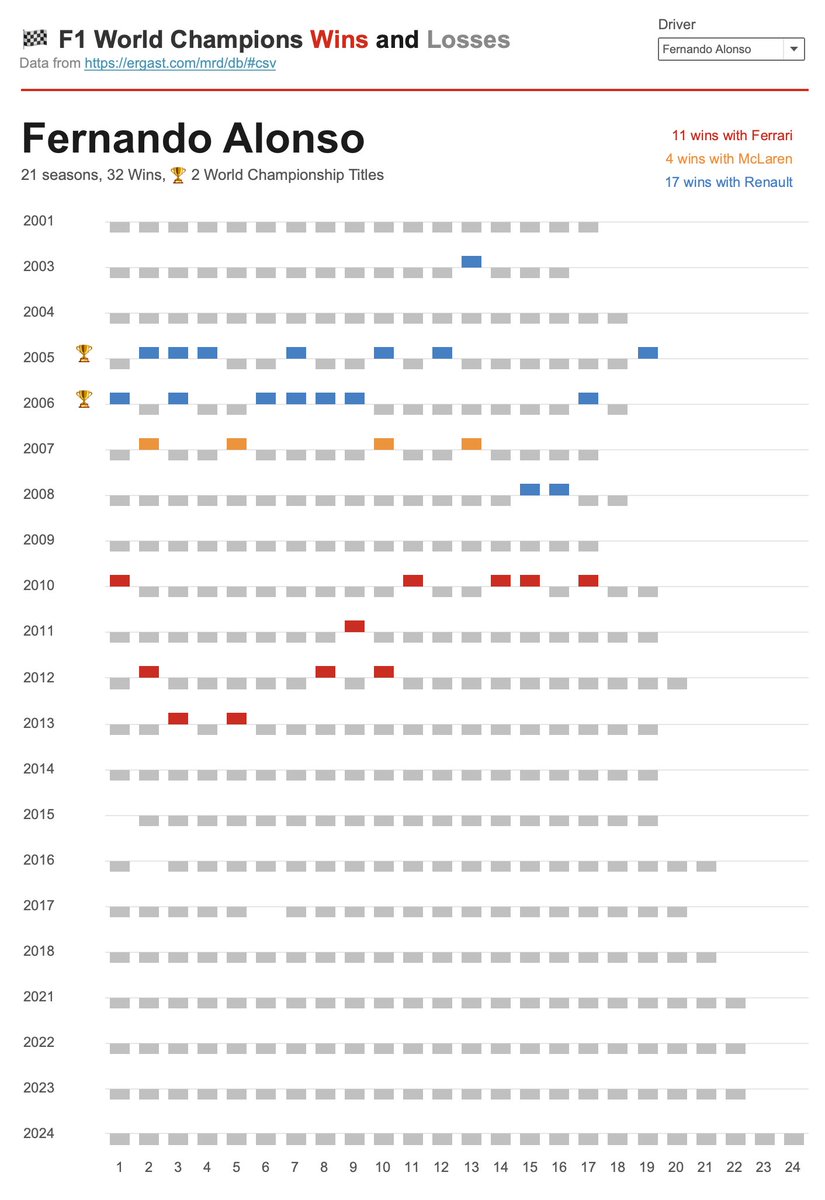
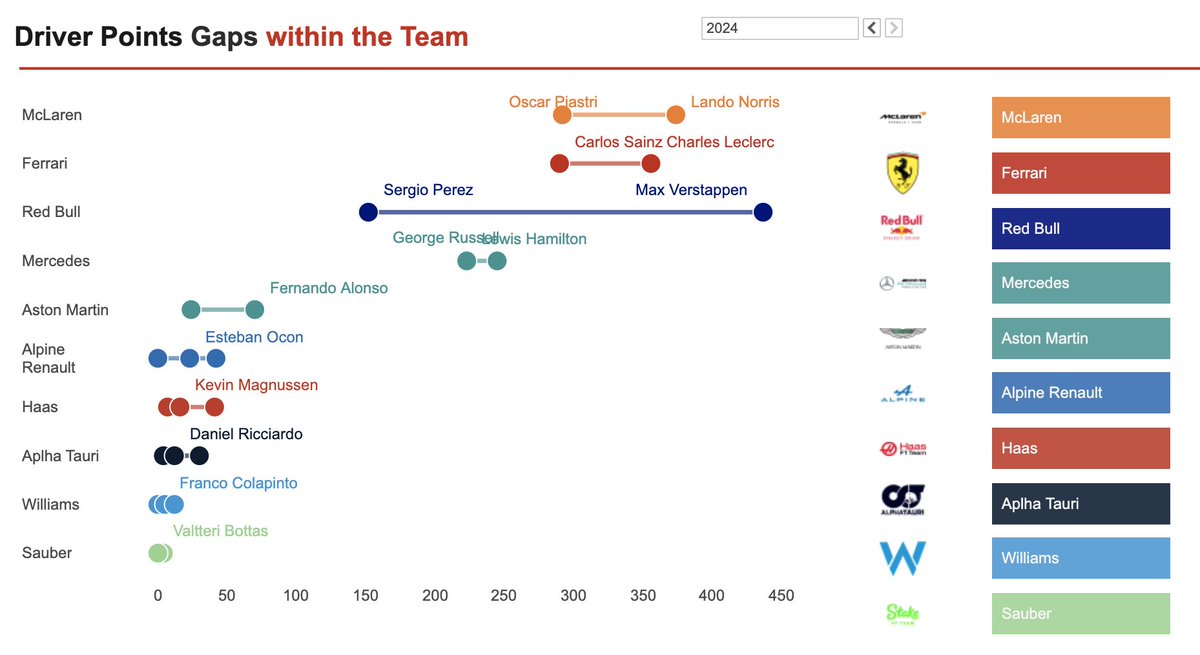
Getting ready for the new #F1 Season. Just updated my viz with the full 2024 results. Can't wait!
public.tableau.com/app/profi…
#sportsvizsunday #dataviz
15
419
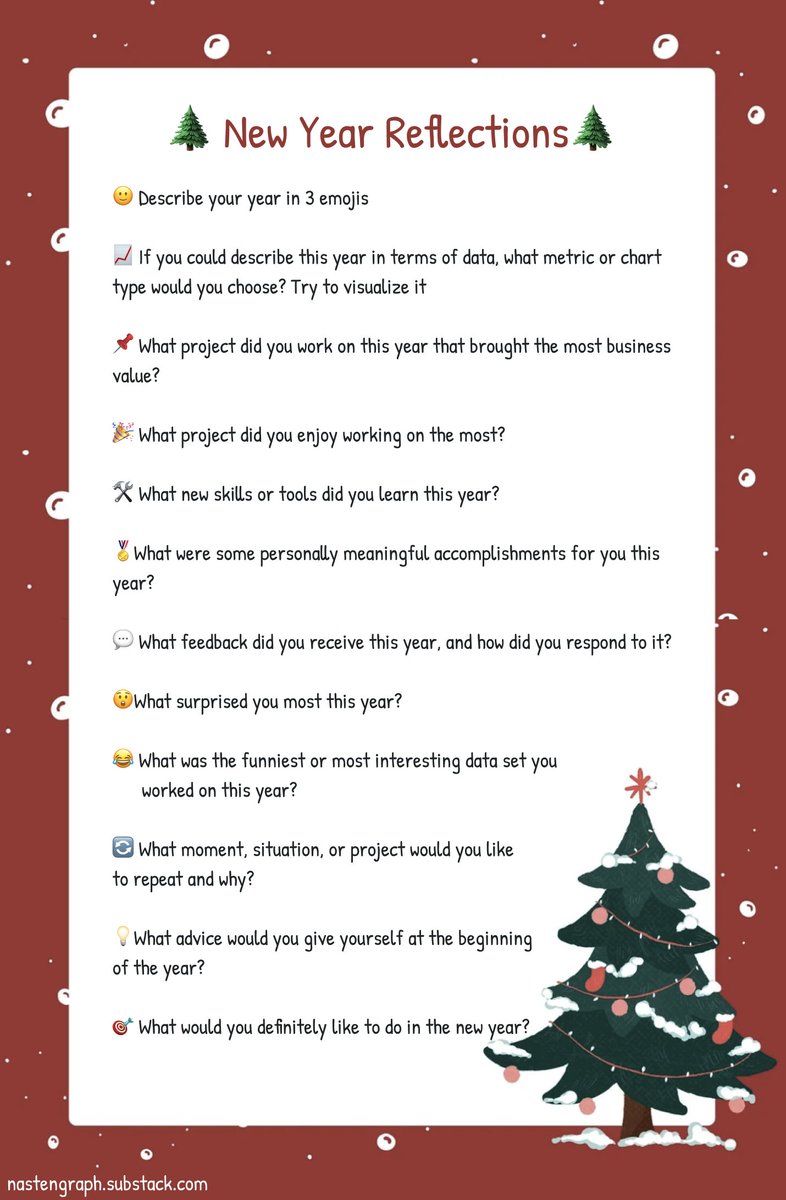
30 Dec 2024
If you are not sure how to spend your New Year's Eve, here is my suggestion for a New Year reflections questionnaire 🎄
5
230
Anastasiya retweeted
28 Dec 2024
That’s a viz wrap, DataFam! 🎉
A year of endless creativity on Tableau Public. Discover the most favorited visualizations and a curated collection of the data stories that shaped 2024: tabsoft.co/4gOHCoy
6
14
78
10,598
24 Dec 2024
Last year, I created this #dataviz showing #formula1 drivers’ salaries and damage costs throughout the season. I just updated it with 2024 data!
Pierre Gasly set a record with zero damage costs this season!
Check it here: public.tableau.com/app/profi…
#sportsvizsunday
1
28
997
Anastasiya retweeted

15 Dec 2024
#SportsVizSunday weekly roundup time! A brief look into some of the cool sports data stuff that people are doing at the moment, plus a great interview piece.
You know the drill, check it out below! 👇
sportsvizsunday.com/post/wee…
2
3
17
749
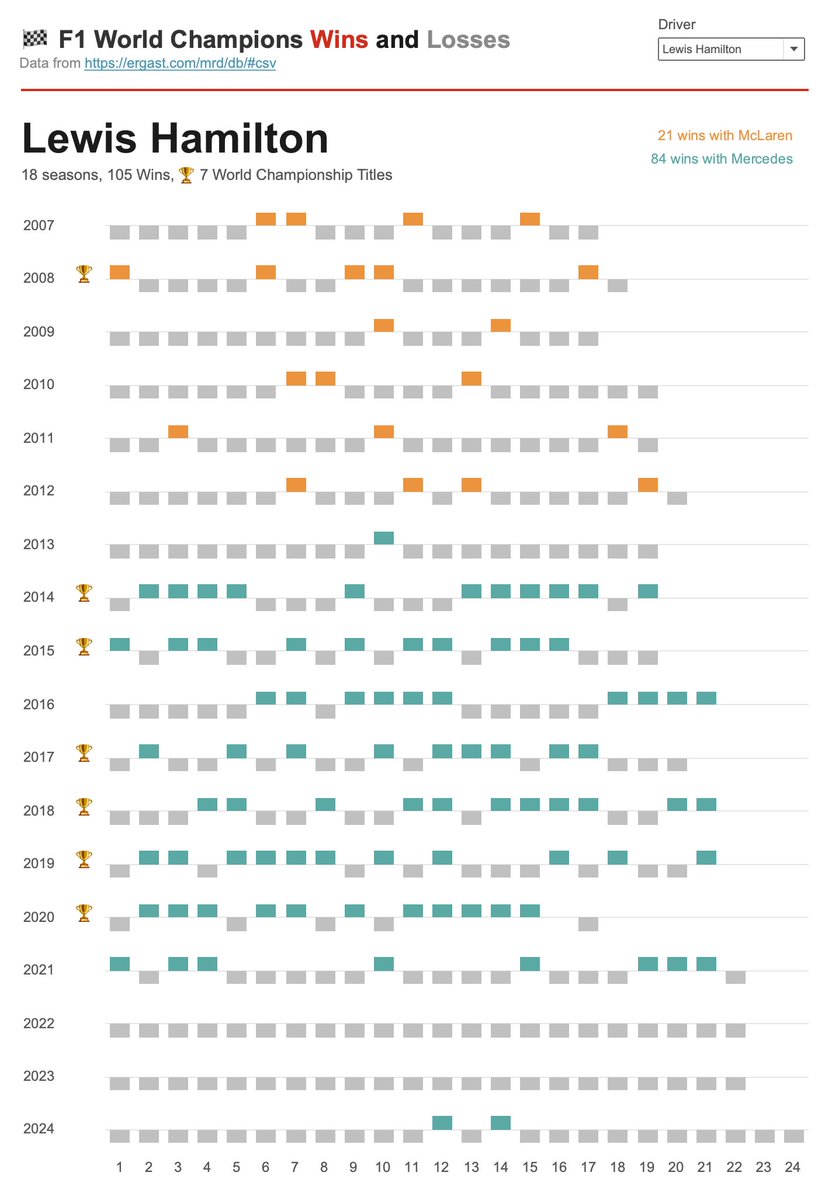
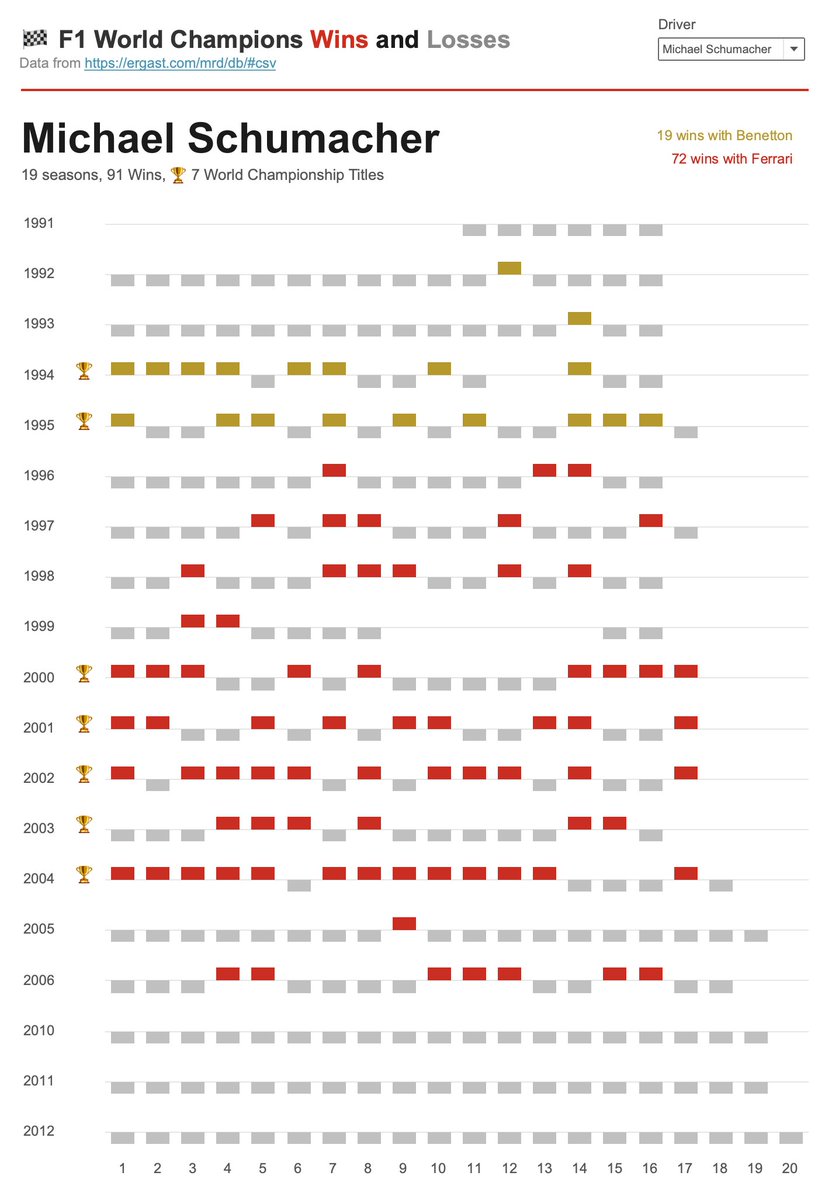
9 Dec 2024
I created an interactive version of win-loss charts. Now you can choose one of the #formula1 world champions to view their stats.
#sportsvizsunday #teamlh #f1 #f1stats
public.tableau.com/app/profi…
1
14
312
2 Dec 2024
🚀 New Regions Overview Dashboard
I created this using my dashboard template to showcase one of my favorite chart combinations – a bar chart table with sparklines. It provides both the ranking of the regions and the ability to analyze their dynamics.
#dataviz #dashboard
2
4
35
992