
Formerly Better Trader Academy. The home of "Mr Breakouts". Algo Breakout Trading Specialists. Follow for tips and strategies on algorithmic breakout trading.
Joined April 2018
- Tweets 3,298
- Following 11
- Followers 6,378
- Likes 1,026
1,777 Photos and videos


Pinned Tweet
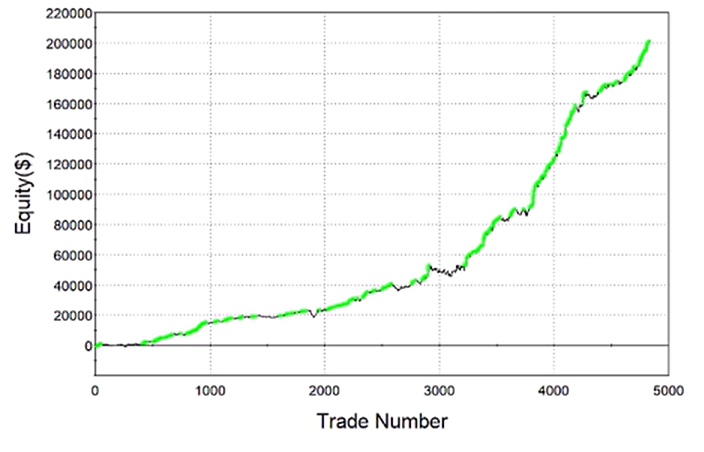
One condition. No indicator. No parameter to optimize. It filtered 80% of bad trades from a NASDAQ breakout strategy.
The condition: is the high of the entry bar above today's open?
That's it. One line of code.
If yes, the market has been trading above today's open. There's an established uptrend for the day. Enter the long breakout.
If no, the market is below today's open when your signal fires. You're not in an uptrend. You're trading noise. Skip.
Before:
- Net profit/drawdown ratio: 5.24
- Drawdown: ~$40,000
- Average trade: $120
After:
- Net profit/drawdown ratio: 7.97
- Drawdown: ~$25,000
- Average trade: $162
Net profit went up while drawdown got cut. That's the signature of a genuine filter. It's removing the right trades, not random ones.
Why does it work? Breakout trading is about momentum. If you're buying a breakout to the upside but the market has been trading below its open all day, there's a contradiction. The price level is breaking out, but the day's direction says otherwise. Those trades are the ones that chop you up.
No parameters means no overfitting. This is pure trading logic. You could test it on any long breakout strategy, on any market, in minutes.
The power isn't in complexity. It's in asking the right question.
What's the simplest filter you've ever used?
13
22
199
118,537
Breakout Trading Academy retweeted

31 Oct 2025
I asked AI to generate 100 different indicators.
Then I put them through 3,500 breakout strategy tests on Nasdaq 60m.
The goal: find the #1 indicator that actually improves performance.
I expected something fancy.
But the real winner shocked me.
It wasn’t an exotic oscillator or hidden formula.
The top performers were Bar Range and ATR - the simplest volatility filters traders have used for decades.
They consistently improved profitability, drawdowns, and win % across both in-sample and out-of-sample data.
The lesson? Don’t overcomplicate.
The edge isn’t in complexity. It’s in robustness.
Watch the full breakdown below ↓
1
3
36
4,795
Breakout Trading Academy retweeted
9 Aug 2025
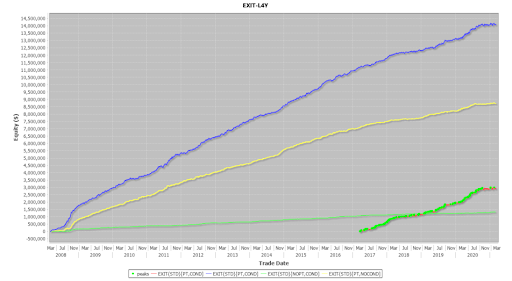
You’ve heard about all kinds of exit rules.
ATR-based, trailing stops, volatility brackets...
But our hedge fund tests proved one rule beats them all:
A fixed USD profit target.
✅ It’s simple
✅ It’s consistent
✅ It’s nearly impossible to overfit
For swing strategies, we pair it with end-of-week exits.
For day trading, we add end-of-day timing.
That combo alone powers dozens of our best strategies.
And we keep seeing it win across all futures markets.
Want reliable performance?
START with reliable exits.
6
6
95
9,497
Breakout Trading Academy retweeted
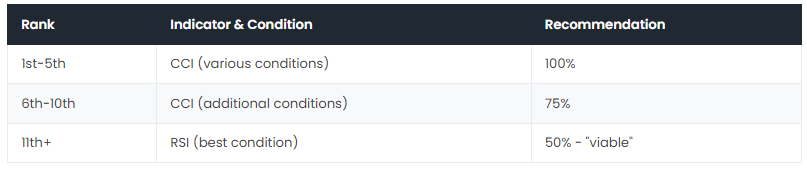
I tested 15 RSI and CCI conditions across 1,000 E-mini NASDAQ strategies.
Here's the full scorecard.
The setup: one base breakout strategy, DNA-extracted into 1,000 siblings representing 1,000 different market regimes. Every indicator condition tested across all 1,000 at the same time. 4,500,000 total iterations inside BreakoutOS.
Three fitness functions scored each condition: net profit/drawdown ratio, average trade, and bounce index (what % of originally losing strategies did this filter recover).
A condition needs to clear 500 out of 1,000 on all three to earn a full recommendation.
RSI results (best condition):
> Recommendation: viable (50%)
> Top fitness function score: marginal
> Scorecard position: lower half
CCI results (best condition):
> Strategies improved on net profit/drawdown: 640/1,000
> Strategies improved on average trade: 650/1,000
> Strategies improved on bounce index: 610/1,000
> Average trade improvement: 65%
> Bounce index improvement: 60%
> Scorecard position: top of every category
The specific winning condition:
> Lowest CCI over last 12 bars must be below -100.
> CCI period: 33.
Not a real-time reading. A lookback check. Has the market recently shown enough downward momentum to register as deeply oversold, even briefly? If yes, the breakout entry is valid.
Why this works structurally.
CCI is unbounded. It can stay extreme longer than RSI, which is capped between 0 and 100 and reverts to the mean quickly. The "lowest CCI over N bars" condition captures sustained momentum shifts in a way RSI simply can't express as cleanly.
For trend-following breakout strategies, you want to know if directional context exists. CCI measures that. RSI tends to measure short-term exhaustion.
The optimization map showed a wide green zone: CCI periods from 24 to 36, lookbacks from 8 to 16, all producing robust results. The best value and everything near it works.
Live impact on the base strategy: average trade up from $116 to $128. Maximum drawdown down from $40,000 to $30,000.
Not optimized on one backtest. Validated across 1,000 strategies and 1,000 market conditions.
4,500,000 tests. One clear winner.
1
1
14
1,662
Save this one. The exact parameters, optimization maps, and full scorecard breakdown are all in the post.
Full breakdown: breakoutos.com/blog/cci-vs-r…
465
Breakout Trading Academy retweeted
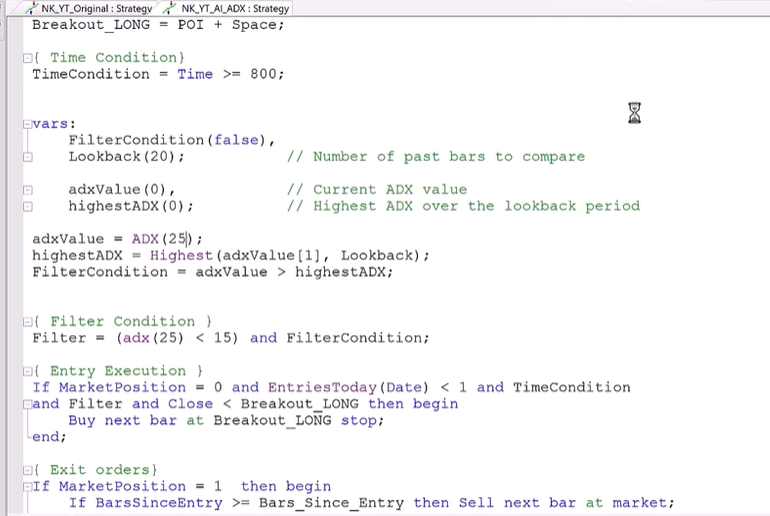
AI didn't eliminate ADX.
It refined its edge.
A properly calibrated ADX is already a strong foundation.
AI helped explore variations faster.
Some ideas reduced drawdowns.
Some improved stability.
None broke the strategy.
That is the real win.
AI works best when it improves strong foundations.
Not when it tries to invent them.
That is how I will keep using it.
2
5
29
2,027
Breakout Trading Academy retweeted
5 Jun 2025
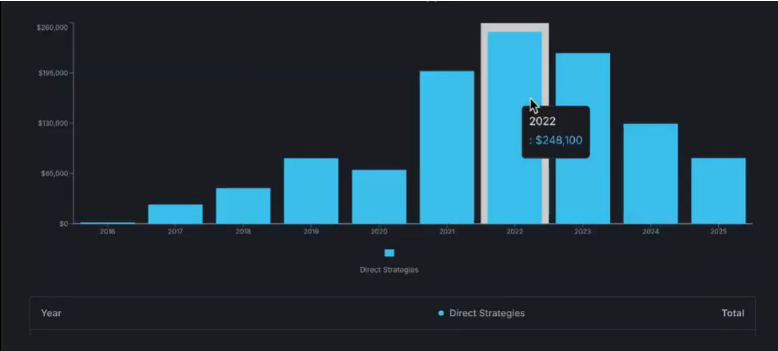
This is what I’d tell myself before building my portfolio.
STOP stalling.
STOP trying to outsmart the market.
STOP chasing one more filter.
Start here instead:
✔️ Build across uncorrelated markets
✔️ Use breakout logic that scales
✔️ Treat long and short models separately
✔️ Give yourself a finish line
That’s what I DID.
And the results speak for themselves.
Want to see what a real portfolio looks like with structure that actually holds?
Check the comments for the full breakdown and free bonus.

5
6
42
5,722
AI didn't eliminate ADX.
It refined its edge.
A properly calibrated ADX is already a strong foundation.
AI helped explore variations faster.
Some ideas reduced drawdowns.
Some improved stability.
None broke the strategy.
That is the real win.
AI works best when it improves strong foundations.
Not when it tries to invent them.
That is how I will keep using it.
2
5
29
2,027
If you like this, check out my FREE research on 100 trading indicators tested across 4,100 strategies (what actually works and what doesn't).
Read it here: go-bta.com/research-indicato…
1
286
Breakout Trading Academy retweeted
If you are adding RSI with a threshold of 63.5 to filter false breakouts, you are not solving the problem.
You are fitting your strategy to a statistical artifact.
Here is the distinction that changes how you build strategies:
A filter based on "is the market trending up today?" captures genuine directional momentum.
A filter based on "is the 14-period RSI above 63.5?" captures a data artifact. When the strategy goes live, the filter breaks down because it was never capturing a real edge.
We tested this across 2,500 breakout strategies in a hedge fund environment.
The filters that held up out-of-sample all share one property: they describe structural market conditions, not optimized indicator thresholds.
The simplest example is the trend direction filter.
For a long entry, check one thing: is the entry bar's high above today's open?
That is it. Zero parameters. Nothing to optimize. Nothing to curve-fit.
Results on E-mini NASDAQ:
> Profit/drawdown ratio improved by 53%
> Max drawdown dropped from ~$40,000 to ~$25,000
> Average trade increased from $120 to $162
A filter with no parameters cannot be overfit by definition.
The same principle scales up to more complex filters.
Parameterless volatility filter for long entries: High of 2 bars ago minus True Range must be greater than today's Open.
Every value is taken directly from price bars. No lookback period to tune. No multiplier to set.
Results on E-mini S&P 500: $606 average trade.
Applied without modification to Dow Jones and S&P 400 MidCap: worked on both.
That cross-market consistency is what a real edge looks like.
Compare this to a trader who tunes an RSI threshold across five years of NASDAQ data, watches the backtest improve, then deploys the strategy. The filter worked in-sample because it was fitted to that specific data. It had no edge at all.
The rule: every parameter you add is a degree of freedom. Every degree of freedom is an opportunity to overfit.
Start with zero-parameter structural conditions. Validate them out-of-sample. Then and only then consider adding a single, broad-category parameter (like ATR bin range: short-term vs. long-term, not a specific number).
The traders who blow up their backtests chasing better in-sample numbers are the traders who wonder why their live results look nothing like their testing.
Structural filters. Zero parameters. Out-of-sample validation.
That is the entire framework.
4
1
26
2,237
Bookmark this for your next strategy session. Full AI trading toolkit breakdown:
breakouttradingacademy.com/i…
1
496
If you are adding RSI with a threshold of 63.5 to filter false breakouts, you are not solving the problem.
You are fitting your strategy to a statistical artifact.
Here is the distinction that changes how you build strategies:
A filter based on "is the market trending up today?" captures genuine directional momentum.
A filter based on "is the 14-period RSI above 63.5?" captures a data artifact. When the strategy goes live, the filter breaks down because it was never capturing a real edge.
We tested this across 2,500 breakout strategies in a hedge fund environment.
The filters that held up out-of-sample all share one property: they describe structural market conditions, not optimized indicator thresholds.
The simplest example is the trend direction filter.
For a long entry, check one thing: is the entry bar's high above today's open?
That is it. Zero parameters. Nothing to optimize. Nothing to curve-fit.
Results on E-mini NASDAQ:
> Profit/drawdown ratio improved by 53%
> Max drawdown dropped from ~$40,000 to ~$25,000
> Average trade increased from $120 to $162
A filter with no parameters cannot be overfit by definition.
The same principle scales up to more complex filters.
Parameterless volatility filter for long entries: High of 2 bars ago minus True Range must be greater than today's Open.
Every value is taken directly from price bars. No lookback period to tune. No multiplier to set.
Results on E-mini S&P 500: $606 average trade.
Applied without modification to Dow Jones and S&P 400 MidCap: worked on both.
That cross-market consistency is what a real edge looks like.
Compare this to a trader who tunes an RSI threshold across five years of NASDAQ data, watches the backtest improve, then deploys the strategy. The filter worked in-sample because it was fitted to that specific data. It had no edge at all.
The rule: every parameter you add is a degree of freedom. Every degree of freedom is an opportunity to overfit.
Start with zero-parameter structural conditions. Validate them out-of-sample. Then and only then consider adding a single, broad-category parameter (like ATR bin range: short-term vs. long-term, not a specific number).
The traders who blow up their backtests chasing better in-sample numbers are the traders who wonder why their live results look nothing like their testing.
Structural filters. Zero parameters. Out-of-sample validation.
That is the entire framework.
4
1
26
2,237
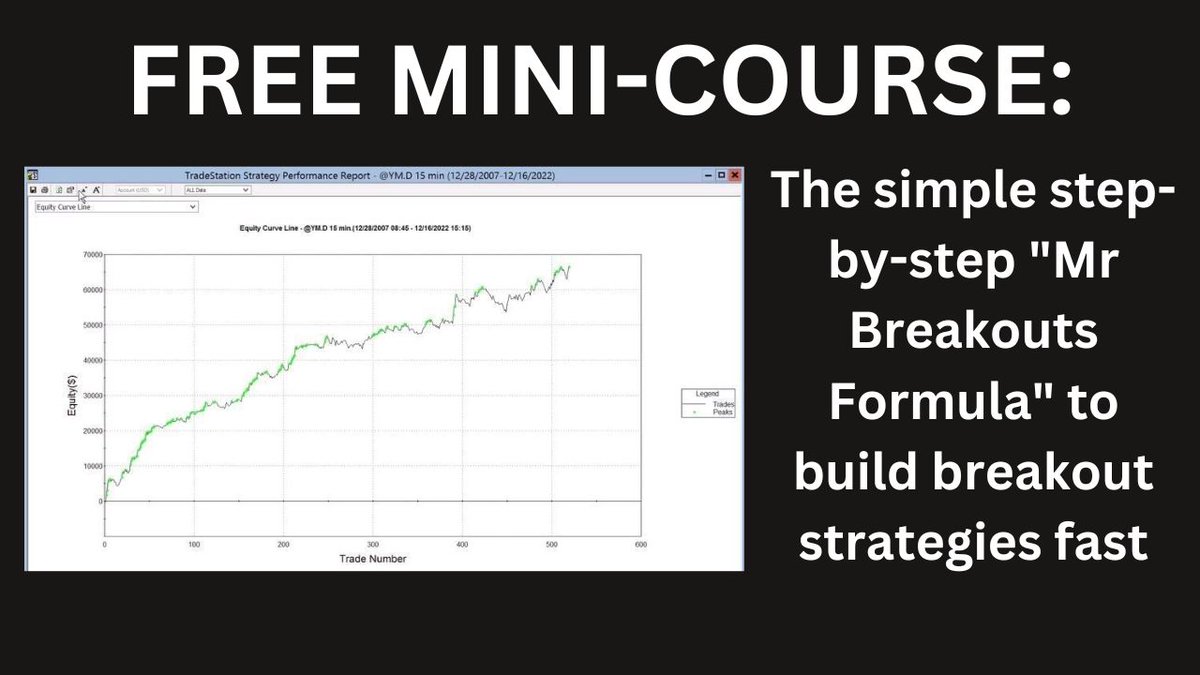
If you like this, check out my FREE mini-course on how to build breakout trading strategies fast using the "Mr Breakouts Formula" (includes a free example strategy).
Get it here:
go-bta.com/x-freeminicourse
326
Save this. The distinction between structural filters and optimized thresholds is one of the most important concepts in systematic trading.
Full research: breakoutos.com/blog/research…
2
432
Breakout Trading Academy retweeted
11 Nov 2024
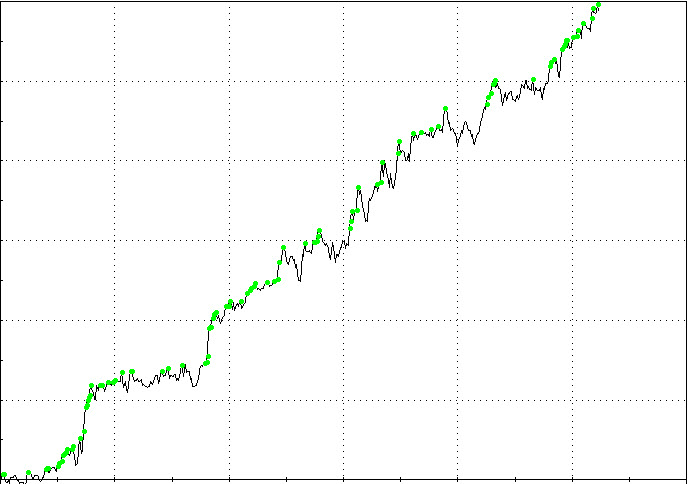
Here's why most traders fail: They think trading needs to be complicated.
They think more indicators = more profit.
They think longer hours = more money.
The truth? They're dead wrong...
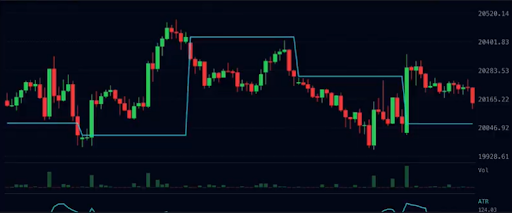
Here’s a simple example of a 1 bar algo trading strategy:
4
12
122
33,256
Breakout Trading Academy retweeted
I tested almost 300 different pivot point strategies on E-mini NASDAQ.
Nearly 10,500 iterations in total.
The results surprised me.
Here is the setup.
Pivot points are calculated using prior day high, prior day low, and prior day close.
Divide by three and you get the floor pivot.
From there you can project support and resistance lines for the next session.
Simple concept.
But the part most traders never think about: when does one session end and the next begin?
That boundary changes everything.
So I tested 8 different session boundaries, each generating 3 lines.
That is 24 different points of initiation.
Combined with ATR periods 5, 20, and 40 as the space calculation.
And tested across 4 different entry time windows: full day, regular trading hours, pre-market, and after session.
All strategies were day trading setups with EOD exit at 11 PM.
> almost 300 combinations.
> 25 multiplier values per strategy.
> Nearly 10,500 iterations.
Here is what came out.
By raw performance, midnight ranked number one.
That makes sense.
It is the most logical session boundary.
But here is the surprise.
When I sorted by robustness, meaning how many different multiplier values produced profitable results, midday came out on top.
Nearly 90% of all tested spaces were profitable on the midday pivot.
That is an exceptionally robust result.
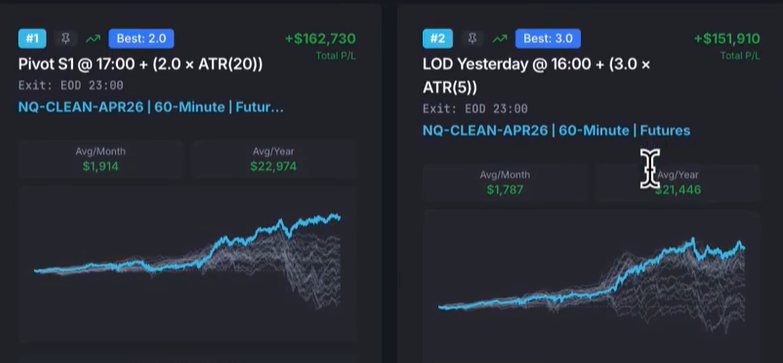
The winning setup:
> Market: E-mini NASDAQ
> Timeframe: 60-minute bars
> Pivot boundary: Midday
> Space: ATR 20 x 1.4 multiplier
> Entry: Breakout long or short
> Exit: End of day at 11 PM
> Filters: None - foundational model only
Multiplier 1.4 ranked number one across all walk-forward periods.
Robustness score: 62%.
Recency alignment: strong.
This is a foundational model with no filters yet.
Adding the right filter on top of this foundation is where it gets really interesting.
4
2
38
2,906
Most traders blame themselves when a strategy stops working in live trading.
They think they picked the wrong indicator.
Wrong timeframe.
Wrong market.
So they start over.
What they almost never consider is that the platform they are building on never gave them the tools to validate the strategy properly in the first place.
TradingView and MetaTrader 5 are excellent execution platforms.
But they are not serious strategy development environments.
If either platform was serious about helping traders build strategies that hold up in live trading, both would have two things built in already.
In-sample/out-of-sample validation.
And walk-forward analysis.
Neither does.
Which means every strategy you build natively on either platform is missing two of the most fundamental validation steps in systematic trading.
In-sample/out-of-sample testing works like this:
> Build and optimize your strategy on the first portion of your data
> Reserve a clean, untouched portion for validation only
> Test the strategy on data it never saw during development
> If it holds there, you have a real edge
Walk-forward analysis goes further.
It runs your strategy across multiple different unknown future windows and checks whether it holds up consistently.
It also tells you whether your strategy handles regular re-optimization well as conditions change.
The problem is not that traders are skipping these steps on purpose.
They are skipping them because the platforms made backtesting easy and made proper validation nearly invisible.
The fix: build your validation workflow outside the platform, validate fully, then deploy the code.
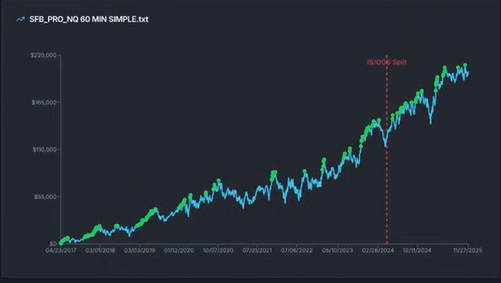
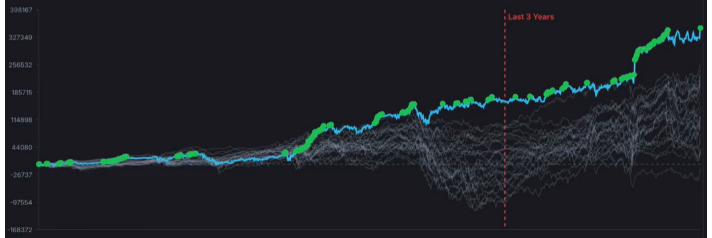
On a recent E-mini NASDAQ model, 10 years of data with the last 3 years reserved for out-of-sample testing.
ATR multiplier 2.0 ranked number one across all walk-forward periods.
Robustness index: 66%.
The execution platform stays the same.
You just stop letting it be your development environment too.
2
2
723
Save this one. If you trade on TV or MT5, this is the workflow gap worth knowing about.
breakouttradingacademy.com/t…
371
Most traders blame themselves when a strategy stops working in live trading.
They think they picked the wrong indicator.
Wrong timeframe.
Wrong market.
So they start over.
What they almost never consider is that the platform they are building on never gave them the tools to validate the strategy properly in the first place.
TradingView and MetaTrader 5 are excellent execution platforms.
But they are not serious strategy development environments.
If either platform was serious about helping traders build strategies that hold up in live trading, both would have two things built in already.
In-sample/out-of-sample validation.
And walk-forward analysis.
Neither does.
Which means every strategy you build natively on either platform is missing two of the most fundamental validation steps in systematic trading.
In-sample/out-of-sample testing works like this:
> Build and optimize your strategy on the first portion of your data
> Reserve a clean, untouched portion for validation only
> Test the strategy on data it never saw during development
> If it holds there, you have a real edge
Walk-forward analysis goes further.
It runs your strategy across multiple different unknown future windows and checks whether it holds up consistently.
It also tells you whether your strategy handles regular re-optimization well as conditions change.
The problem is not that traders are skipping these steps on purpose.
They are skipping them because the platforms made backtesting easy and made proper validation nearly invisible.
The fix: build your validation workflow outside the platform, validate fully, then deploy the code.
On a recent E-mini NASDAQ model, 10 years of data with the last 3 years reserved for out-of-sample testing.
ATR multiplier 2.0 ranked number one across all walk-forward periods.
Robustness index: 66%.
The execution platform stays the same.
You just stop letting it be your development environment too.
1
405
I tested almost 300 different pivot point strategies on E-mini NASDAQ.
Nearly 10,500 iterations in total.
The results surprised me.
Here is the setup.
Pivot points are calculated using prior day high, prior day low, and prior day close.
Divide by three and you get the floor pivot.
From there you can project support and resistance lines for the next session.
Simple concept.
But the part most traders never think about: when does one session end and the next begin?
That boundary changes everything.
So I tested 8 different session boundaries, each generating 3 lines.
That is 24 different points of initiation.
Combined with ATR periods 5, 20, and 40 as the space calculation.
And tested across 4 different entry time windows: full day, regular trading hours, pre-market, and after session.
All strategies were day trading setups with EOD exit at 11 PM.
> almost 300 combinations.
> 25 multiplier values per strategy.
> Nearly 10,500 iterations.
Here is what came out.
By raw performance, midnight ranked number one.
That makes sense.
It is the most logical session boundary.
But here is the surprise.
When I sorted by robustness, meaning how many different multiplier values produced profitable results, midday came out on top.
Nearly 90% of all tested spaces were profitable on the midday pivot.
That is an exceptionally robust result.
The winning setup:
> Market: E-mini NASDAQ
> Timeframe: 60-minute bars
> Pivot boundary: Midday
> Space: ATR 20 x 1.4 multiplier
> Entry: Breakout long or short
> Exit: End of day at 11 PM
> Filters: None - foundational model only
Multiplier 1.4 ranked number one across all walk-forward periods.
Robustness score: 62%.
Recency alignment: strong.
This is a foundational model with no filters yet.
Adding the right filter on top of this foundation is where it gets really interesting.
4
2
38
2,906
If you like this, check out my FREE research on 5 proven techniques to filter false breakouts (data from 2,500 strategies).
Grab it here: go-bta.com/research-false-br…
476