
Systems Analyst & Programmer since 2000. 💻🏦 25 years Engineering financial flows for major banks. I’ve seen the "source code" of money—and it’s broken. 📉
Joined April 2012
- Tweets 3,718
- Following 8
- Followers 404
- Likes 2,824
87 Photos and videos


Jun 15
Day Twenty: $39,220,785,117,318. Down $20.9 billion in one day. Don't be fooled. This is not a reversal. This is how a hyperbola moves: not in a straight line, but in a zigzag pattern that trends relentlessly upward over time. The curve does not need every single day to go up. It just needs the average to hold. And the average holds. $7.58 billion per day over 30 days. $10.58 billion per day over the last 22 days. The hyperbola doesn't negotiate. It doesn't care about daily fluctuations. It only cares about time.
fiscaldata.treasury.gov/amer…
14
Jun 11
Day Nineteen: $39,241,722,848,798. $11.3 billion in one day. The 30-day average holds at $7.58 billion per day. But the last 22 days show something worth flagging: the actual daily average over that window is $10.58 billion. That is not the trend. That is a recent acceleration.
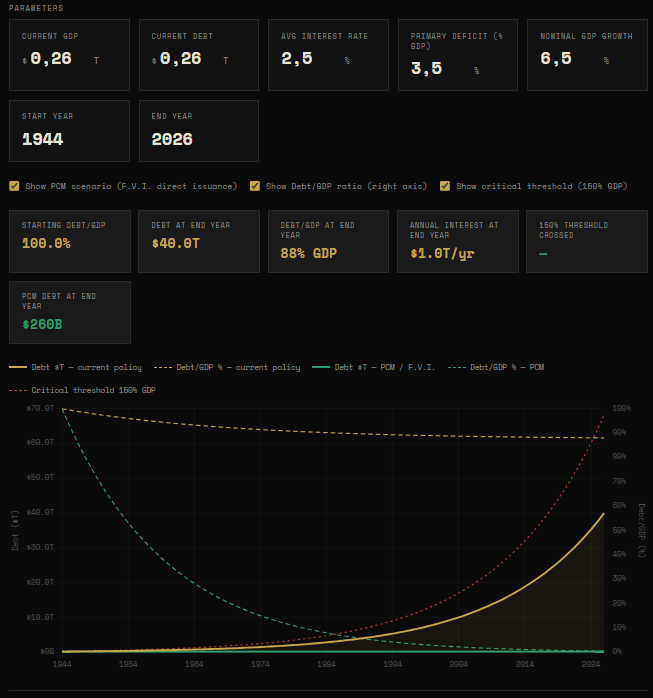
HYPOTHESIS: if this pace holds, $40 trillion arrives well before mid-September. Reversing the direction is structurally impossible. Slowing it down is the best case scenario. We will see. The hyperbola doesn't negotiate.
fiscaldata.treasury.gov/amer…
22
Jun 10
Day Eighteen: $39,230,385,715,009. $10.8 billion in one day. Back up. The hyperbola doesn't need every single day to go up. It just needs the average to hold. 30-day average: $7.58 billion per day. Still.
fiscaldata.treasury.gov/amer…
33
Jun 9
Day Seventeen: $39,219,582,387,346. Down $12.6 billion from yesterday. Posting it anyway. Again. intellectual honesty has no selective memory. The hyperbola doesn't need every single day to go up. It just needs the average to hold. 30-day average: $7.58 billion per day. Still.
fiscaldata.treasury.gov/amer…
30
Jun 6
Day Sixteen: $39,232,150,577,283. $27.2 billion in one day. 3.5x the 30-day average. At this rate: $40 trillion by mid-September 2026. The window is not closing. It is slamming shut. 30-day average: $7.58 billion per day. Still.
fiscaldata.treasury.gov/amer…
40
Jun 5
Day Fifteen: $39,204,974,715,248. Down $17 billion from yesterday. Posting it anyway. The hyperbola doesn't need every single day to go up. It just needs the average to hold. 30-day average: $7.58 billion per day. Still.
fiscaldata.treasury.gov/amer…
37
Jun 4
Day Fourteen: $39,221,984,586,285. $26.5 billion in one day. 3.5x the 30-day average. Two weeks of data. Same conclusion every day. The hyperbola doesn't negotiate. The hyperbola doesn't care about our feelings. 30-day average: $7.58 billion per day. Still.
fiscaldata.treasury.gov/amer…
40
Jun 3
Day Thirteen: $39,195,502,287,422. Down $12.2 billion from yesterday. Posting it anyway. Again. One day down doesn't move the 30-day average. It doesn't change the direction. It doesn't fix the formula. The hyperbola doesn't care about ours feelings. 30-day average: $7.58 billion per day. Still. fiscaldata.treasury.gov/amer…
34
Jun 2
Day Twelve: $39,207,759,598,302. After one day down and one day sideways, the curve remembered where it was going. $31.4 billion in 24 hours. The hyperbola doesn't negotiate. 30-day average: $7.58 billion per day. Still.
fiscaldata.treasury.gov/amer…
44
Jun 1
Day Eleven: $39,176,301,795,549. Yesterday it came down. Today it came back up. The hyperbola doesn't care about single data points: it cares about direction. 30-day average: $7.58 billion per day. Still.
fiscaldata.treasury.gov/amer…
37
May 29
Day Ten: $39,163,302,863,182. Down from yesterday.
Posting it anyway. Intellectual honesty matters more than a good story. The 30-day average is still $7.58 billion per day. One day below the trend doesn't change the trend. The hyperbola doesn't care about single data points.
fiscaldata.treasury.gov/amer…
42
May 28
Day Nine: $39,171,154,946,667. $59 billion in ONE day. The 30-day average is $7.58 billion. Yesterday was 8x that. Still under control, they say.
fiscaldata.treasury.gov/amer…
38
May 27
This social network is useless. Either you say what the owner likes, or only you see your posts. How sad: those who proclaimed themselves saviors from censorship have completely betrayed their mission.
33
May 27
Day Eight: $39,112,192,265,187. $41 billion in 4 days.
The 30-day average holds: $7.58 billion per day. Every day. America had a long weekend. The debt didn't.
fiscaldata.treasury.gov/amer…
$2 2=4. Period.
34
May 23
Day Four: $39,071,200,457,366. Up again.
Yesterday it breathed in. Today it breathed out. The 30-day average never lies. $7.58 billion per day. Every day. While someone explains why the deficit is under control.
fiscaldata.treasury.gov/amer…
$2 2=4. Period.
56
May 20
$39,008,999,901,378 today. At $7.6B/day, the US will cross $40 trillion before the November midterms. For the first time in history.
fiscaldata.treasury.gov/amer…
1
1
112
May 22
Day Three:$39,049,639,932,662. Down from yesterday.
Don't celebrate. This is not a trend. This is a cycle.
Interest payments cluster. Settlement dates cluster. The debt breathes in and out on a weekly rhythm.
Watch the 30-day average. That one never goes down.
fiscaldata.treasury.gov/amer…
2
1
59
May 23
Day Four: $39,071,200,457,366. Up again.
Yesterday it breathed in. Today it breathed out. The 30-day average never lies.
$7.58 billion per day. Every day. While someone explains why the deficit is under control.
fiscaldata.treasury.gov/amer…
$2 2=4. Period.
33