
• Global EdTech Platform | • 50K Alumni | 89% Hired | • 65 Countries | • Remote Internships | • Instructor-led Classes | • hello@quantumanalyticsco.org
Joined February 2021
- Tweets 5,453
- Following 320
- Followers 14,818
- Likes 1,753
981 Photos and videos


Pinned Tweet

8 Nov 2024
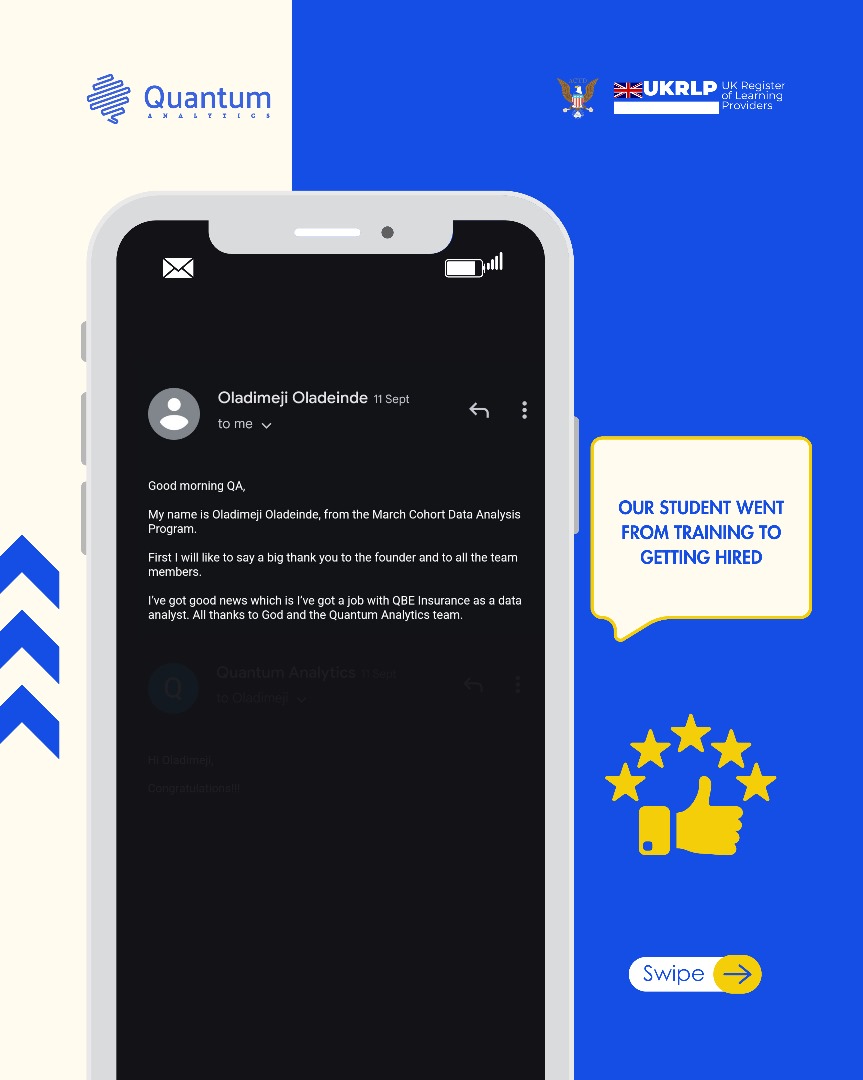
@quantumanalyst, we pride ourselves on empowering our students with industry-ready skills.
Here's proof that the journey with us opens doors to new career heights.
Congratulations Oladimeji. Cheers to more wins🎉🎉
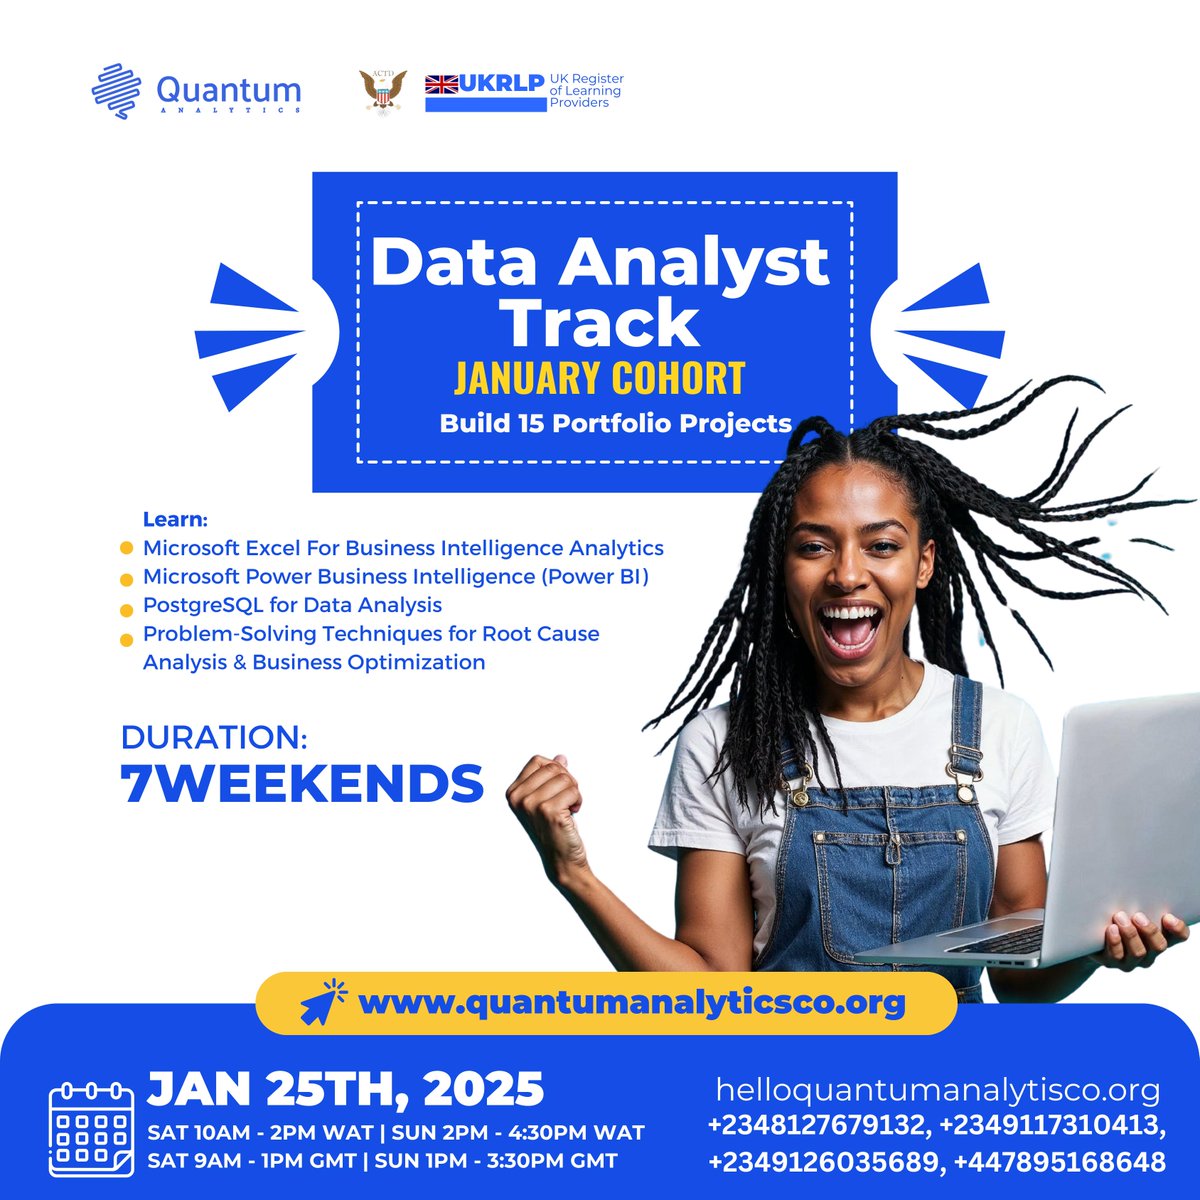
Ready to start your own success story?
Join Quantum Analytics and let’s make it happen!
Visit ur website at quantumanalyticsco.org to get started.
#successtory #edtech

4
3
19
6,614
Mar 30
Your joins in SQL can silently duplicate data.
Always validate row counts before and after.
1
3
348
Mar 30
Learn to break big problems into smaller questions. That is how complex analysis becomes manageable.
1
4
271
Mar 30
Outliers are not always errors. Sometimes they are the most important insights.
1
3
219
Mar 30
Every metric has a definition. Misunderstanding it leads to wrong conclusions.
1
1
189
Mar 30
Most people jump into charts too early. Spend more time understanding the dataset structure first and your insights will improve instantly.
1
1
154
Mar 30
Start your day like a great analyst
be curious about everything.
Question what you see
and look for patterns others ignore.
Small insights today can lead to big breakthroughs tomorrow.
1
1
138
Mar 25
The fastest way to grow in tech is to build projects, not just watch tutorials.
2
5
226
Mar 25
Do not just learn tools like Power BI or Tableau. Learn how businesses think.
1
2
213
Mar 25
If your dashboard needs explanation, it is already too complex.
2
9
30
790
Mar 25
Always question the data source. Clean visuals cannot fix bad data.
2
8
283
Mar 25
A good chart tells a story. A great chart makes a decision obvious.
1
2
144
Mar 25
Always check for missing values before any analysis. Skipping this step can destroy your results.
1
1
147
Mar 25
Stop memorizing functions. Start understanding when and why to use them.
1
1
222
Mar 23
Break big problems into smaller questions.
Clarity comes from structure.
1
1
162
Mar 23
Know your business metrics.
Revenue, churn, conversion rate.
Tools don’t matter if you don’t understand these.
2
1
148
Mar 23
Check outliers before removing them.
Sometimes the “error” is the most important insight.
1
2
160
Mar 23
Use simple visuals first.
Bar charts and line charts solve most business problems better than fancy ones.
1
1
2
169
Mar 23
Always compare something.
This week vs last week.
This region vs another.
Context creates insight.
1
1
114
Mar 23
A clean dataset is more valuable than a complex model.
Garbage in still equals garbage out.
4
3
219
Mar 23
Never trust a dataset at first glance.
Validate totals, ranges, and data types before analysis.
1
2
134