
Crafting python claude automations for fundamental business problems. recover hours. expand margin. deploy in days.
Joined April 2026
- Tweets 62
- Following 6
- Followers 14
- Likes 42
9 Photos and videos


Pinned Tweet

Apr 18
most AI content is theater. it doesn't survive contact with real work.
i've shipped plenty of slop myself.
this page is for the people who build systems, run operations, and make key decisions from data.
if this is your world, follow along.
1
4
813
Jun 3
companies are capping or killing AI subscriptions. the bills are huge and most usage is non-productive code that never ships.
the answer isn't less AI. it's smarter usage:
• scripts only call AI for the parts that need judgment
• python handles the data, files, calculations (free)
• more output per dollar than ad-hoc usage ever delivers.
1
17
May 6
What is some complex data you’ve been struggling with as far as analysis or even automation of reports?
Comment below and let’s see if that’s solvable
1
82
May 2
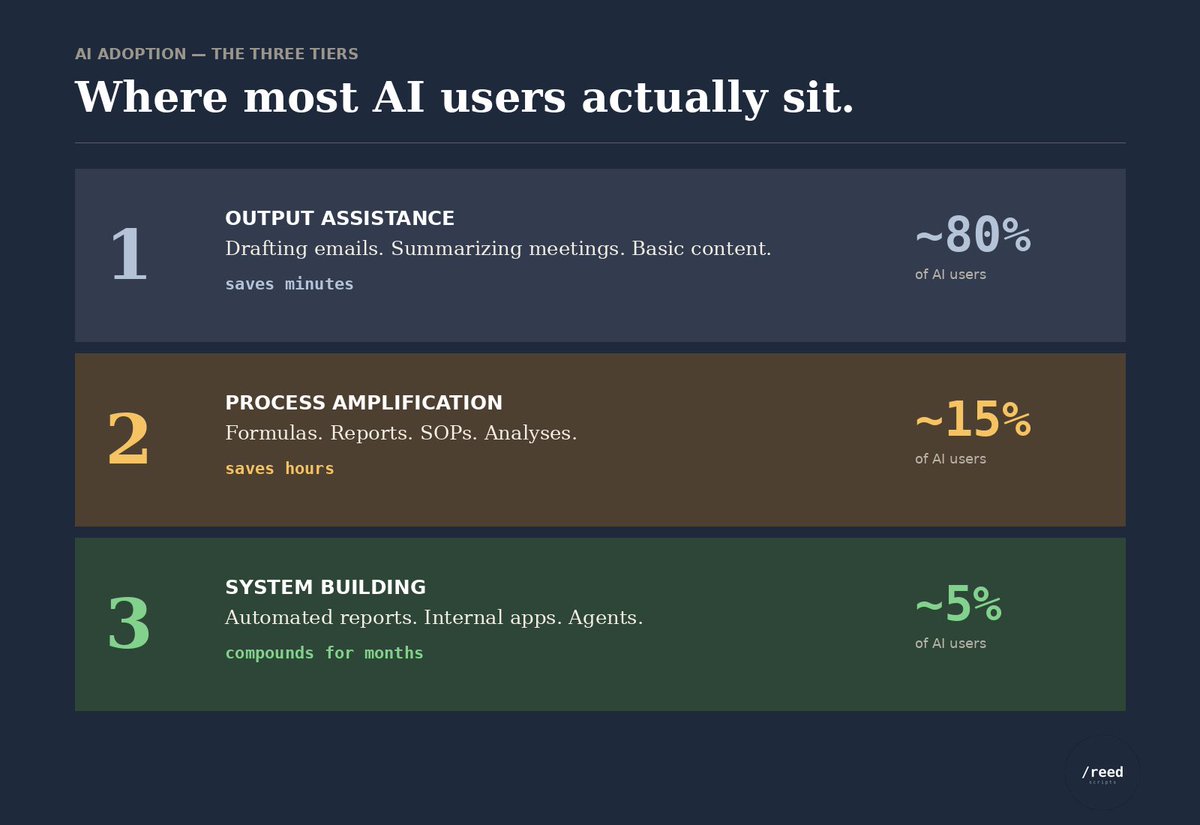
in my years of experience with AI, i've seen usage fall into three tiers.
most users are stuck in tier 1. only a few ever reach tier 3.
do you agree?
2
127
May 1
most companies hand the AI initiative to someone who's never built with AI. six months in, there's a strategy deck and zero working use cases.
if you're closer to the data than they are, the case is yours to make.
• pick one specific inefficiency you already understand — start contained, not ambitious
• run the script on your actual data, with all of its inconsistencies. that's where it has to work
• show one person a real dollar figure. champions move faster than committees
the path forward isn't waiting for permission. it's the use case you build this week.
1
2
154
May 1
“We just hired a VP of AI who’s an expert”
When you hear this it’s hard to believe. Sure there are some experts out there but they don’t know everything. A majority of these people are experienced in tech but haven’t got their hands dirty with AI.
Take action on your own, we are still very early on.
78
May 1
waiting for someone at your company to show you how AI fits your role? they don't know either. the people figuring this out are figuring it out by trying.
• the only way to learn what AI can do for your data is to point it at your data and see what comes back
• you'll be more useful in three weeks than the people still waiting in three months
• every script you build teaches you the next one. it compounds
i post examples here every week. follow if you want to see what real attempts look like.
62
Apr 27
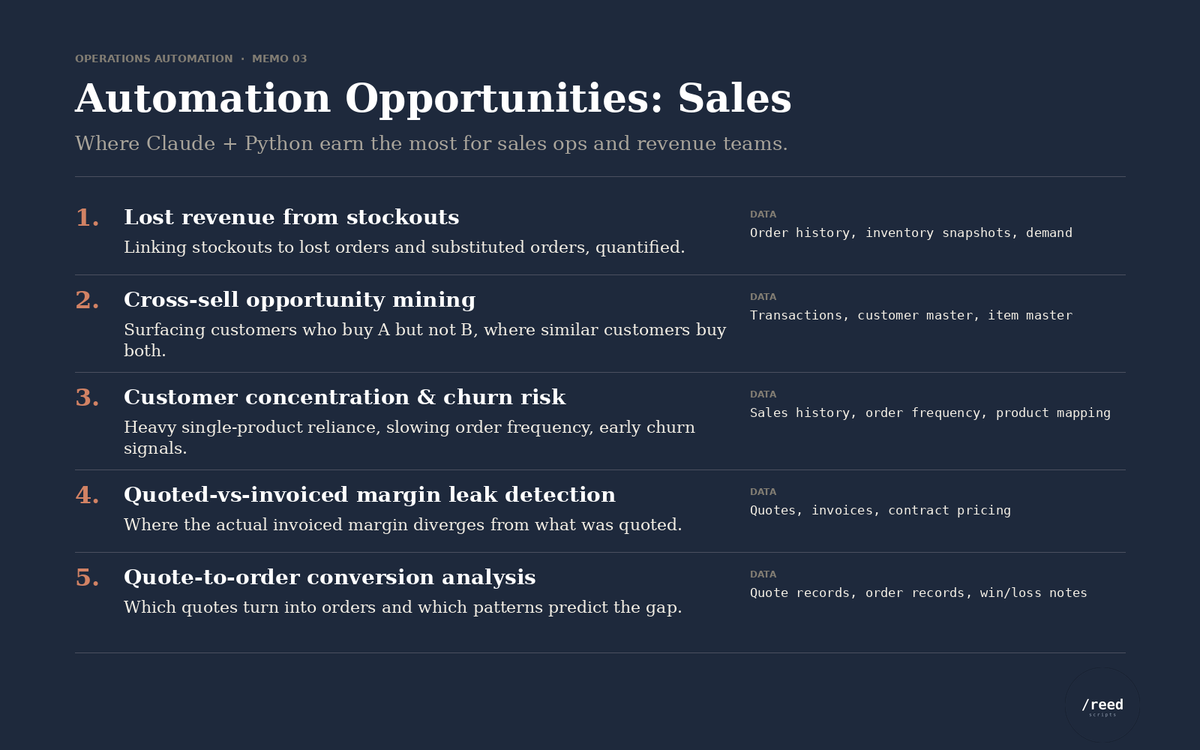
most sales teams have thousands of dollars in untapped data potential. a few python scripts unlock it.
- every script runs on data already in your CRM and ERP — order history, inventory, customer master
- these are time-saving compounders — you build once, they run forever
here are five thought starters to get you going.
3
163
Apr 27
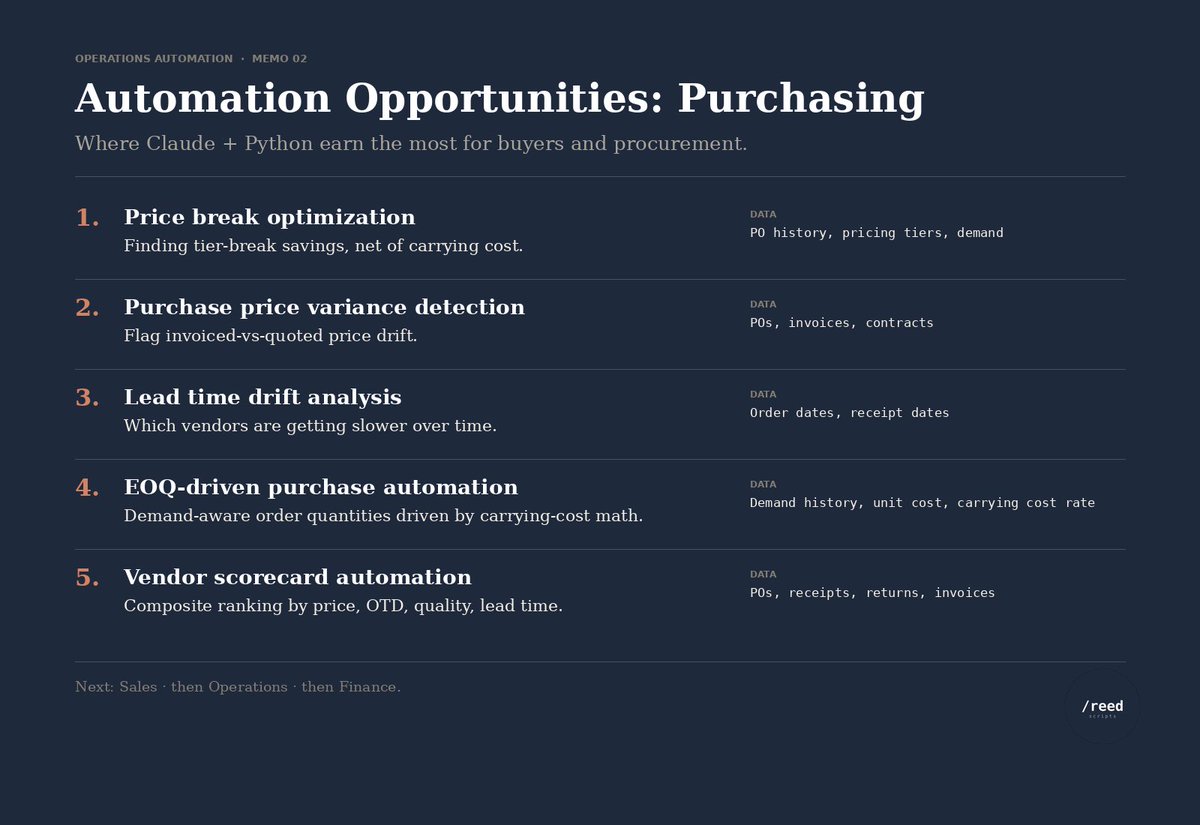
most purchasing teams know exactly what they should be analyzing. AI python is what gives them the hours back to actually do it.
• every script runs on data you already pull regularly — POs, invoices, vendor master
• these are time-saving compounders — you build once, they run forever
here are five thought starters to get you going:
3
208
Apr 26
tens of thousands in savings sit between you and a few python scripts.
• warehouse data is the most actionable data in your operation — every line ties to a real physical event with timestamps and locations baked in
• the average mid-market warehouse leaves five figures on the table every year
here are five thought starters to get you going:
3
175
Apr 25
the strongest opinions on AI almost always come from the people who've never run a real prompt.
• 91% of companies have adopted AI in some form, but only 26% of employees use it weekly or more
• among employees in AI-adopting organizations, 65% say it has improved their productivity
• about half of all AI projects fail to make it from pilot to production
if you're in the camp that hasn't tried it, the answer isn't a stronger opinion. it's an afternoon, a real problem, and a script you build yourself.
1
134
Apr 25
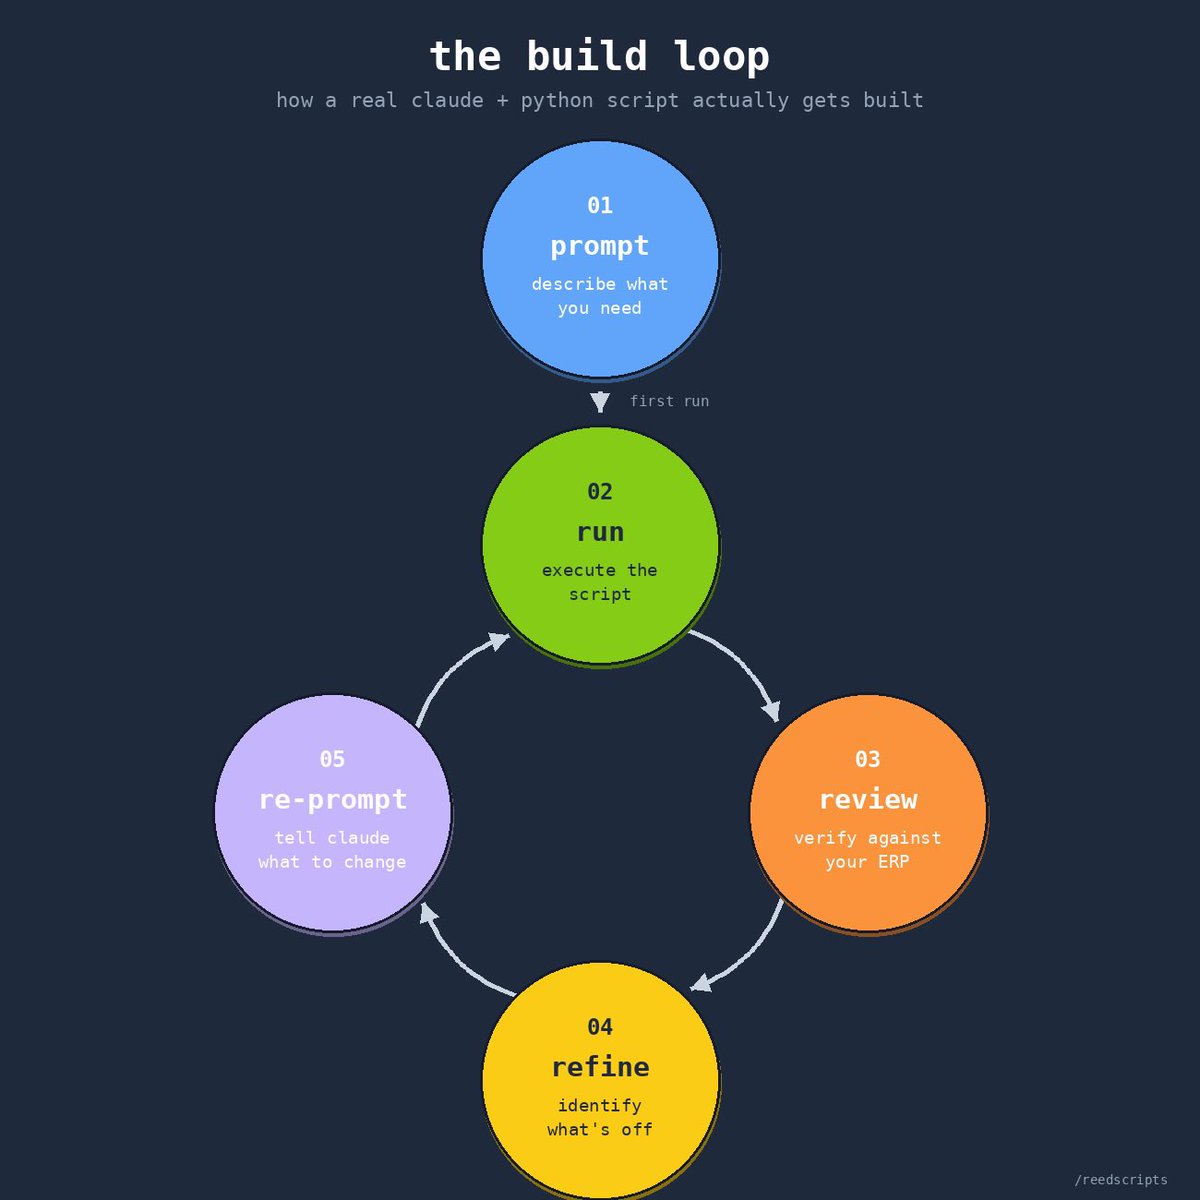
every AI post sells simplicity. real building is a loop.
• the first prompt gets you 60% of the way there. the better you write it, the further that 60% becomes
• every loop is the same: run → review → refine → re-prompt
• iterating is what gets you through the genuinely complex stuff — the prompts that would never work on the first try
1
3
164
Apr 25
most people give up before they build anything meaningful with AI. the pattern is always the same: vague first prompt, mediocre output, frustration, conclusion that "AI can't do what I do."
the AI didn't fail. the prompt didn't communicate what was actually in your head. those are different problems.
i've watched smart, capable operators bounce off this same wall — and i've done it myself. the ones who push through learn that AI can do far more than your first three prompts suggest. the ones who don't, walk away certain it's all hype.
the difference between "AI doesn't work" and "AI is the most powerful tool i have" is almost always how many loops you ran before you decided.
1
110
Apr 22
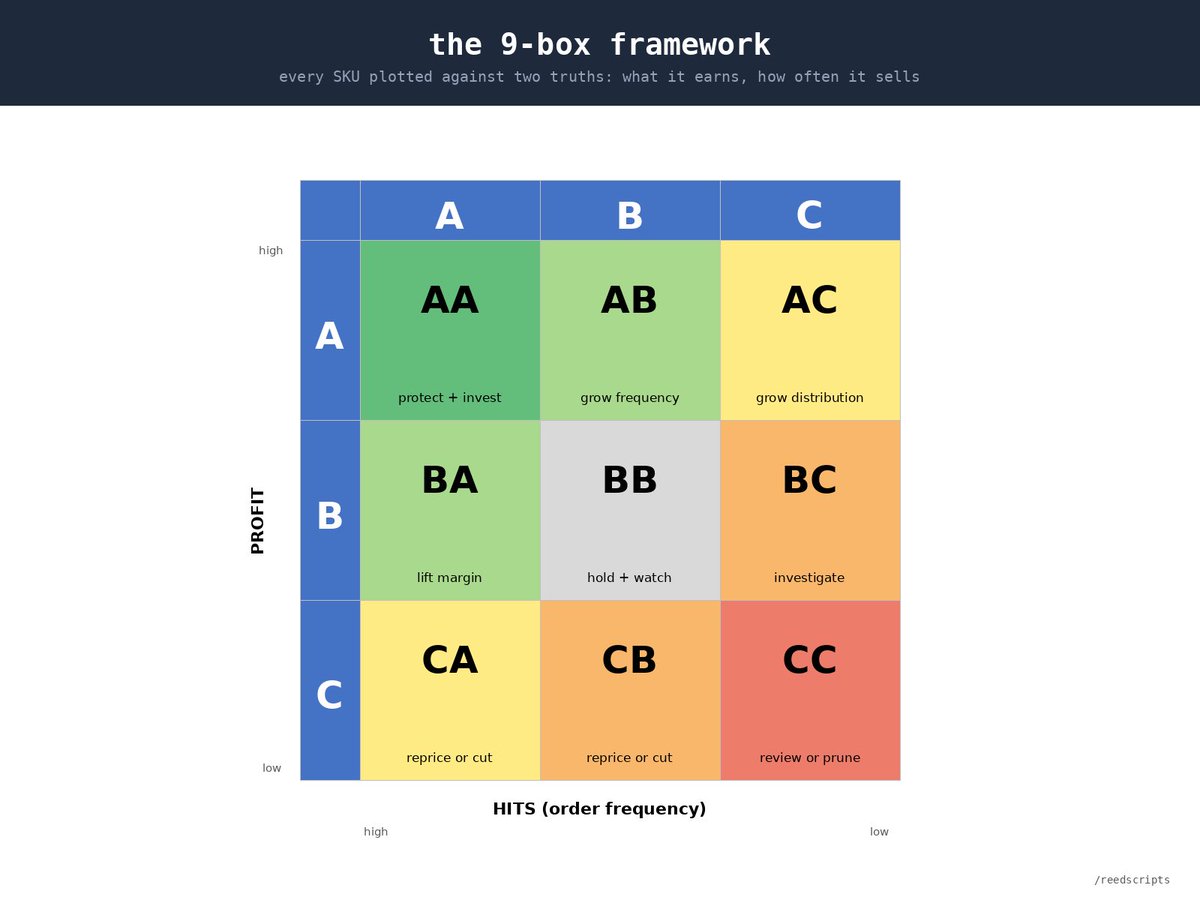
99% of AI content online is prompts without examples. this one has both.
• here's a real script input — your sales history, five columns
• here's the prompt you paste into claude to build it
• here's the actual output — every SKU graded on two axes, ranked for action
paste the headers and a few sample rows into claude, then ask: "build me a python script and a batch file to run it. the script should read sales_history.csv, calculate 12-month hits (unique order count), 12-month profit (revenue minus cost), and assign ABC ranks on each axis using pareto's rule. combine into a 9-box tier. output as abc_9box_analysis.csv — item, description, vendor, hits rank, profit rank, 9-box, hits 12M, profit 12M, unit cost."
Try for yourself and see if you get what you’re looking for.

1
3
156
Apr 22
worth noting — this prompt is intentionally simple. it's meant as an intro case, not a production script.
the goal here is to help you get familiar with the logic and see what the workflow looks like end-to-end. once you've run it once, the real value comes from iterating — adding your own edge cases, filters, and columns until it fits your actual business.
start here. adapt from there.
1
100
Apr 21
the report you keep describing to someone else? you can build it yourself.
every custom report turns into a back-and-forth with IT. you ask for something specific. they build what they heard. you come back with corrections. they rebuild. the specifics never fully land, because half of what makes a report useful is context only the operator carries.
claude python cuts out the loop. no waiting behind someone else's priorities. no translating your business logic into someone else's language. you describe what you need in your own words and build it on your own timeline.
everyone wants to be more self-service and less dependent. this is how you get there.
Follow along and check out my page to see actual use cases and problems you can solve.
2
63
Apr 21
how many hours a week do you spend turning reports into decisions the report should've told you?
if you're running AWS Redshift, QuickSight, Athena, or any of the bigger query platforms, you know the gap. these tools are built to pull data. they stop at the reporting layer. you get numbers, not decisions.
that's the last mile — the gap between data and action. most teams close it manually in excel. almost nobody builds scripts for it.
claude python does. your query tools pull the raw data. python applies the business logic — thresholds, rankings, recommended actions. same data. different output.
start a conversation if you want to see how to cut those hours and make clearer decisions.
4
71
Apr 20
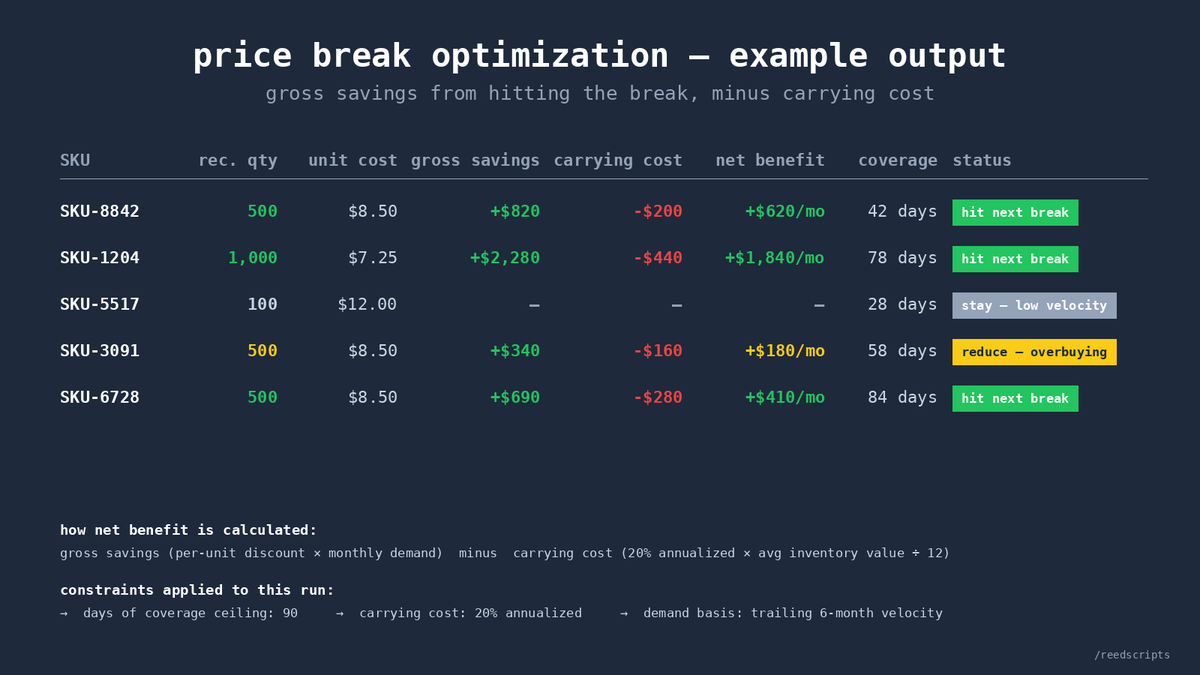
there are thousands of hidden dollars in how you buy right now. most teams never see them.
they're sitting in the gap between what your vendor's price break offers and what your team actually buys. buy too little, miss the discount. buy too much, tie up cash in inventory that sits for months.
using claude python scripting, here's what you can do:
take your historical sales data and your vendor's price break, paste the headers and a few sample rows into claude, then ask: "for each SKU in sales_history.csv and vendor_pricing.csv, calculate the optimal purchase quantity that maximizes net benefit while keeping days-of-coverage under 90. factor in a 20% annualized carrying cost. output as price_break_analysis.csv — SKU, recommended qty, new unit cost, gross savings, carrying cost, net benefit, days of coverage."
claude writes the script. you run it. you get a ranked list of the SKUs where a quantity change actually pays — and the ones where it doesn't.
this doesn't replace purchasing judgment. cash, vendor relationships, storage all still matter. but it surfaces the specific buys worth negotiating or committing to.
run it monthly. the tiers that matter change with your demand.
1
5
111
Apr 20
you already know the feeling: sat through the enterprise SaaS demo, watched 50 features get walked through, and counted maybe 5 you'd actually use.
six-figure annual contracts. months of implementation. integration headaches. all to run the handful of workflows that actually matter to the business.
claude python scripting flips that equation. you build exactly the 5 functions you need — without the 45 you don't — for almost nothing. with a few weeks of practice, plus claude doing the heavy lifting, you're producing the specific tools your business actually runs on.
SaaS still has its place when you genuinely need the whole platform. most of the time you don't. and the "we need a platform for that" reflex is often the expensive path to a cheap solution.
feel free to start a conversation if you want to see whether your current tools or workflows are good candidates.
1
5
57
Apr 19
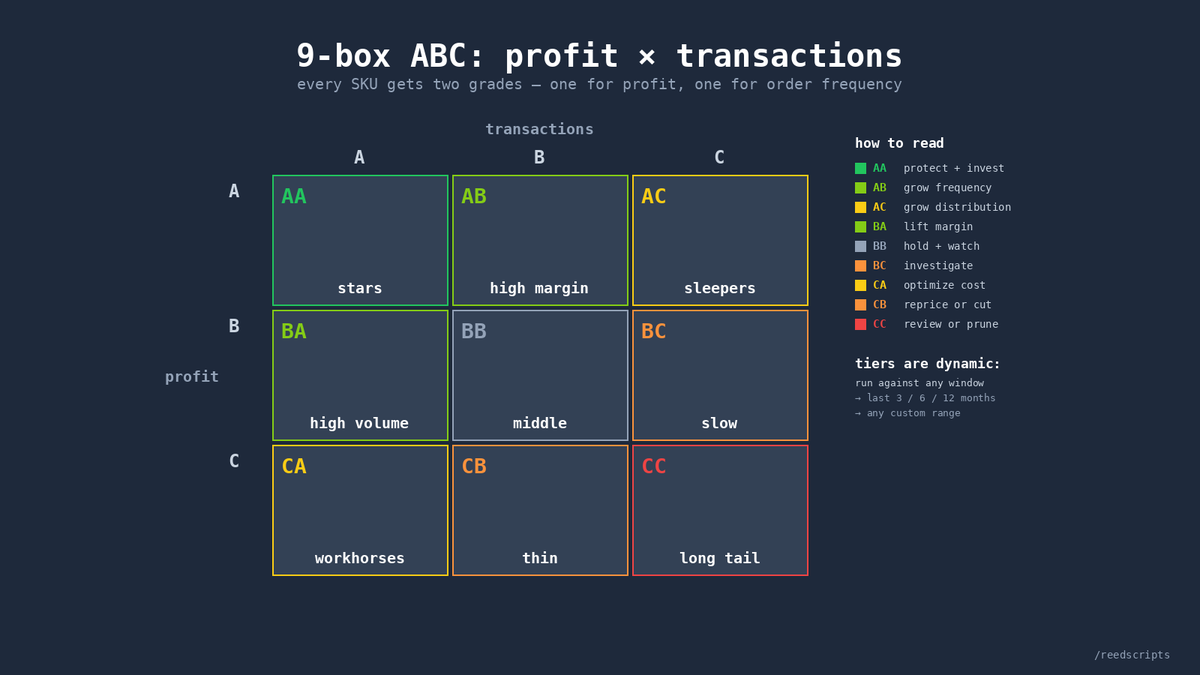
ABC classification is the clearest way to see what's actually driving your business.
most businesses run it manually — in excel, or with ERP settings that are rigid and limited. either way, the analysis lags the business.
here's how to run this yourself with a simple python script from claude:
all you need is transactional sales data: item, revenue, cost, customer.
paste your headers and a few sample rows into claude (not your full data) so it can see the format. then ask: "write me a python script that reads my salesdata.csv and gives me a 9-box ABC — profit on one axis, hits on the other, last 6 months. break each axis into 70/20/10 (top 70% = A, next 20% = B, last 10% = C)."
you'll have a working script in under a minute to test.
1
4
62
Apr 19
when you ask claude for the script, also add: "save the output file to a folder called /9-box-reporting and create the folder if it doesn't exist." now your reports stay organized automatically. no scripts dumping files into your downloads folder. no hunting through folders to find last month's output. every script you write from here on — give it a home.
1
3
37
Apr 19
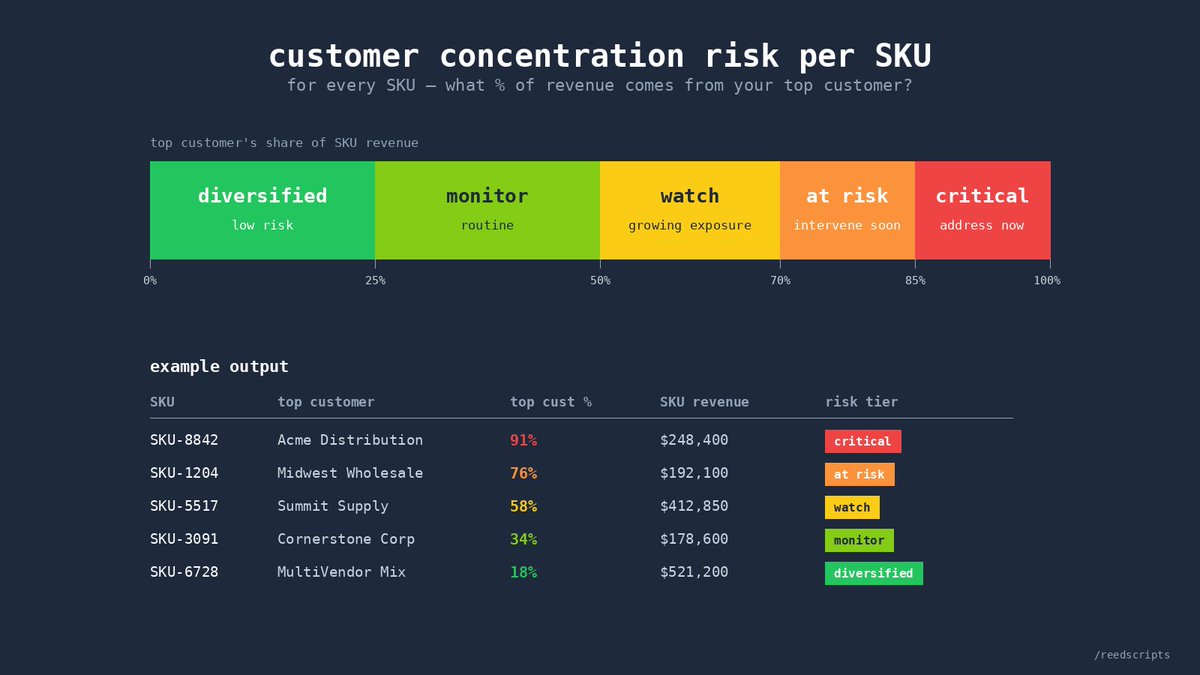
another way to leverage the same data: customer concentration risk.
for every SKU, ask: what % of revenue comes from my top customer? if one customer is 85% of SKU-123's revenue, that revenue disappears with one lost account.
using the same headers from the ABC script, ask claude: "for each item in salesdata.csv — first trim whitespace, normalize case, and parse dates — then calculate the top customer's percentage of revenue. tag each item with a risk tier: diversified (<25%), monitor (25-50%), watch (50-70%), at risk (70-85%), critical (85% ). save to the /9-box-reporting folder as customer-concentration.csv."
new file in the same folder. you now have a risk map across every SKU.
the 9-box tells you what's driving the business. this tells you what could break it.
if you want further customization, just keep building on the script. rinse and repeat.
3
44