
R function a day keeps the madness away 🧘♀️ — If you’re a new follower, check out older posts as well 😊 — From 24.01.2021 to 24.01.2022 — by @patilindrajeets
Joined January 2021
- Tweets 559
- Following 0
- Followers 19,268
- Likes 1,123
390 Photos and videos


Pinned Tweet

25 Jan 2022
As requested by some of you, there is now a book of these posts! 📗
bookdown.org/IndrajeetPatil/…
Makes it easy to-
📑 read
🔍 search
🔗 share
etc.
It ain't pretty, but that's the best I'd do in a day 😅
PRs welcome if you notice that something is amiss 🙏
#rstats #DataScience
24 Jan 2022

Today concludes this 1-year hobby project.
There won’t be new posts, so feel free to unfollow, but do keep revisiting! 🙃
With > 22K followers in 365 posts, I guess you enjoyed reading them as I much as I’d preparing them. 😅
Best luck with your jouRneys! 🤞
@patilindrajeets
10
84
371
3 Feb 2021
If you want to get a quick overview of descriptive statistics for a numeric variable, {describe_distribution} from {parameters} 📦 is your friend 🙌
easystats.github.io/paramete…
Also works with a {grouped_} dataframe from {dplyr} 👏
#rstats #DataScience

2
14
61
6 Oct 2022
This function no longer resides in {parameters} 📦.
It can now be found in {datawizard} 📦:
easystats.github.io/datawiza…
1
9
9 Apr 2021
Factor analysis (FA) can help reduce many features to a few latent features. But one first needs to check if data is suitable for FA.
The {check_factorstructure} function from {parameters} provides an informative and verbose way 🔍
easystats.github.io/paramete…
#rstats #DataScience

3
33
153
6 Oct 2022
This function no longer resides in {parameters} 📦.
It can now be found in {performance} 📦:
easystats.github.io/performa…
1
2
4
24 Jan 2022
Today concludes this 1-year hobby project.
There won’t be new posts, so feel free to unfollow, but do keep revisiting! 🙃
With > 22K followers in 365 posts, I guess you enjoyed reading them as I much as I’d preparing them. 😅
Best luck with your jouRneys! 🤞
@patilindrajeets
44
18
620
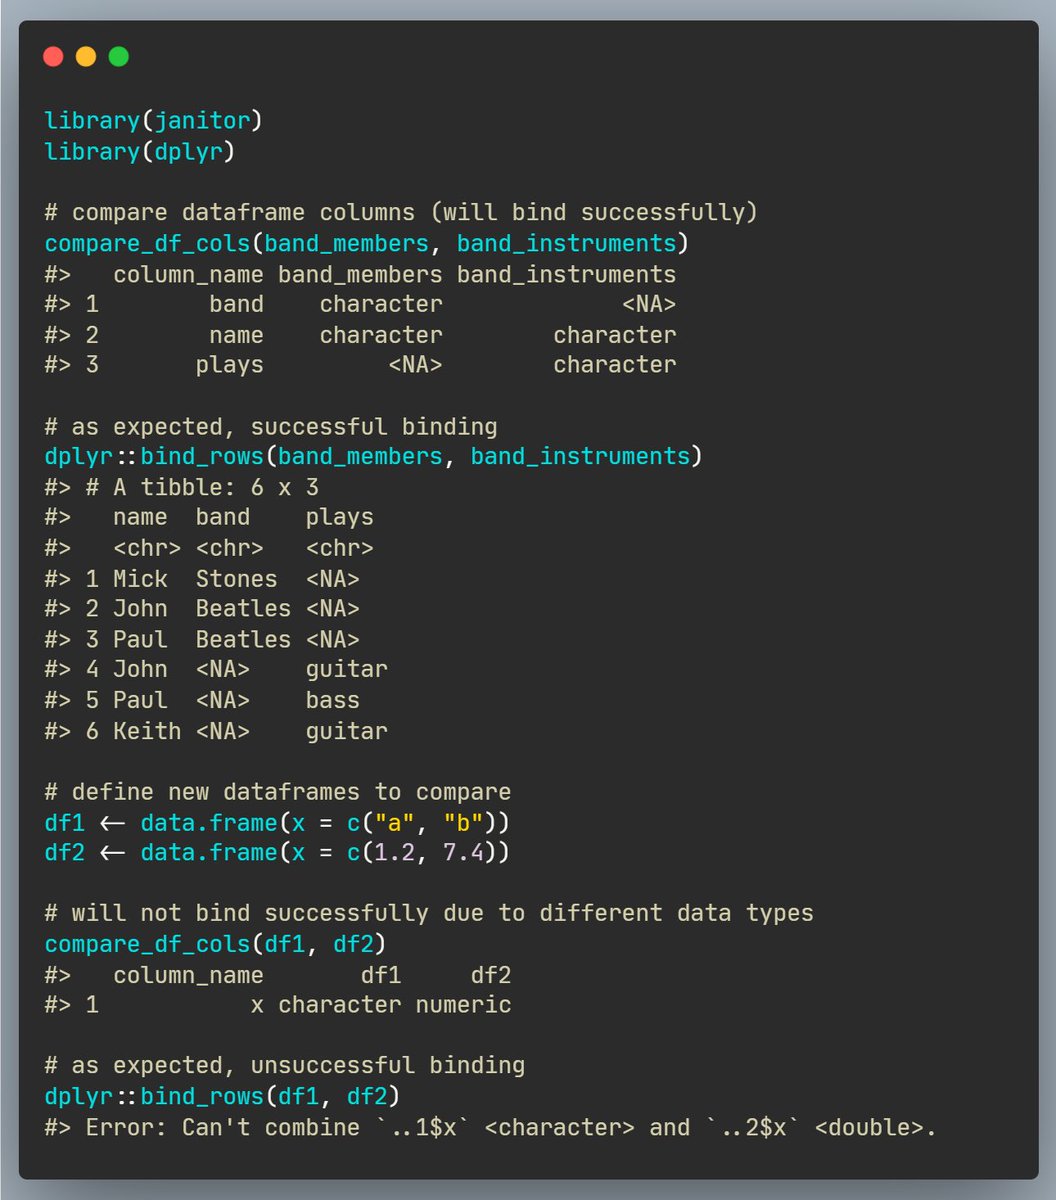
24 Jan 2022
If we need to bind multiple dataframes by rows, we may first wish to check if this can be done successfully.
The {compare_df_cols} function from {janitor} 📦 provides a summary of data types to check this! 🍎🍏
sfirke.github.io/janitor/ref…
#rstats #DataScience
1
34
172
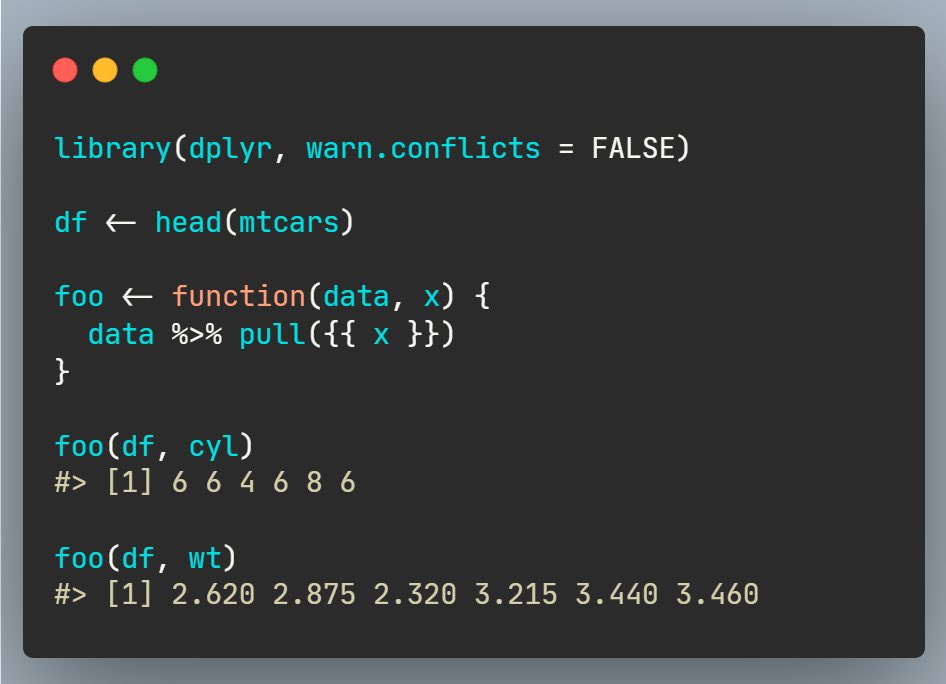
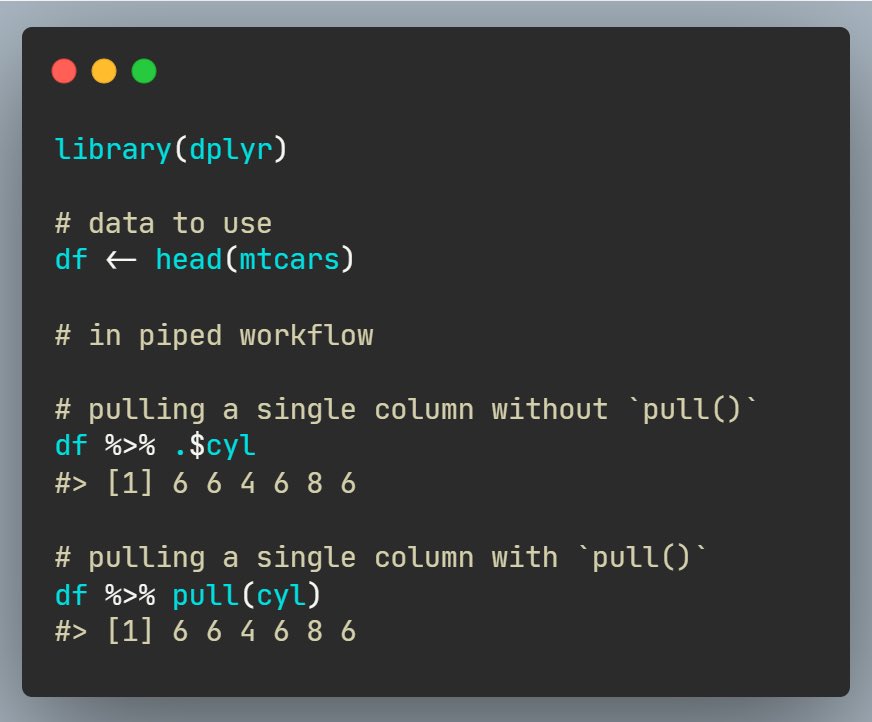
23 Jan 2022
While working in a piped workflow, if you need to extract a single column, the syntax to do so can be a bit cumbersome.
The {pull} function from {dplyr} 📦 provides a more readable syntax to this end! 💄
dplyr.tidyverse.org/referenc…
#rstats #DataScience
3
24
187
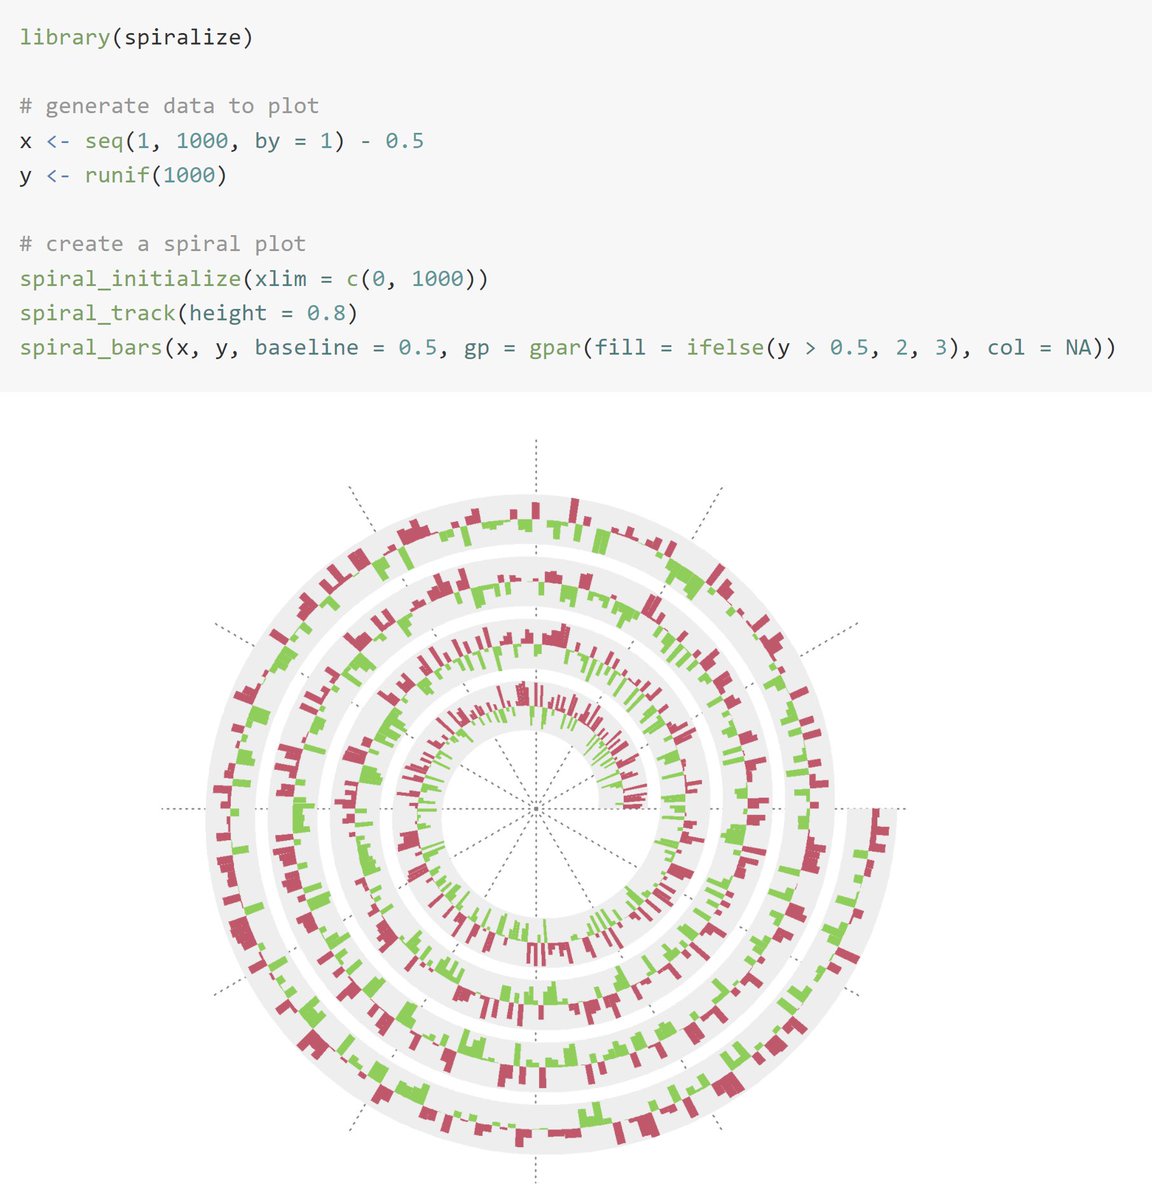
22 Jan 2022
Visualizing data along an Archimedean spiral can efficiently reveal periodic patterns in time series data.
The {spiral_*} function family from {spiralize} 📦 draws such spiral plots flexibly! 🌀
jokergoo.github.io/spiralize…
#rstats #DataScience
9
37
274
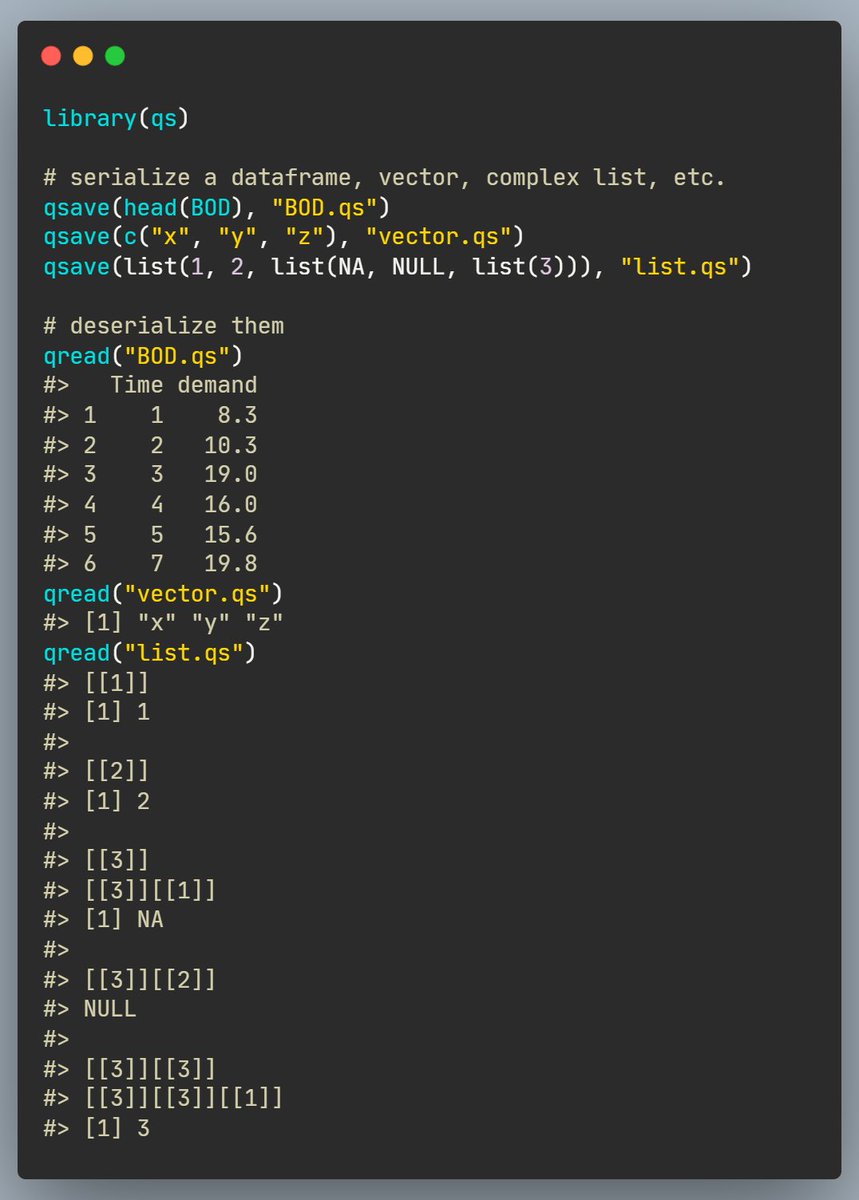
21 Jan 2022
Serialization changes objects to a byte stream that can be saved to a binary file, while deserializing does the reverse.
The {q*} function family from {qs} 📦 provides a performant way to serialize or deserialize any R object! ⚡️
rdrr.io/cran/qs/man/
#rstats #DataScience
1
6
31
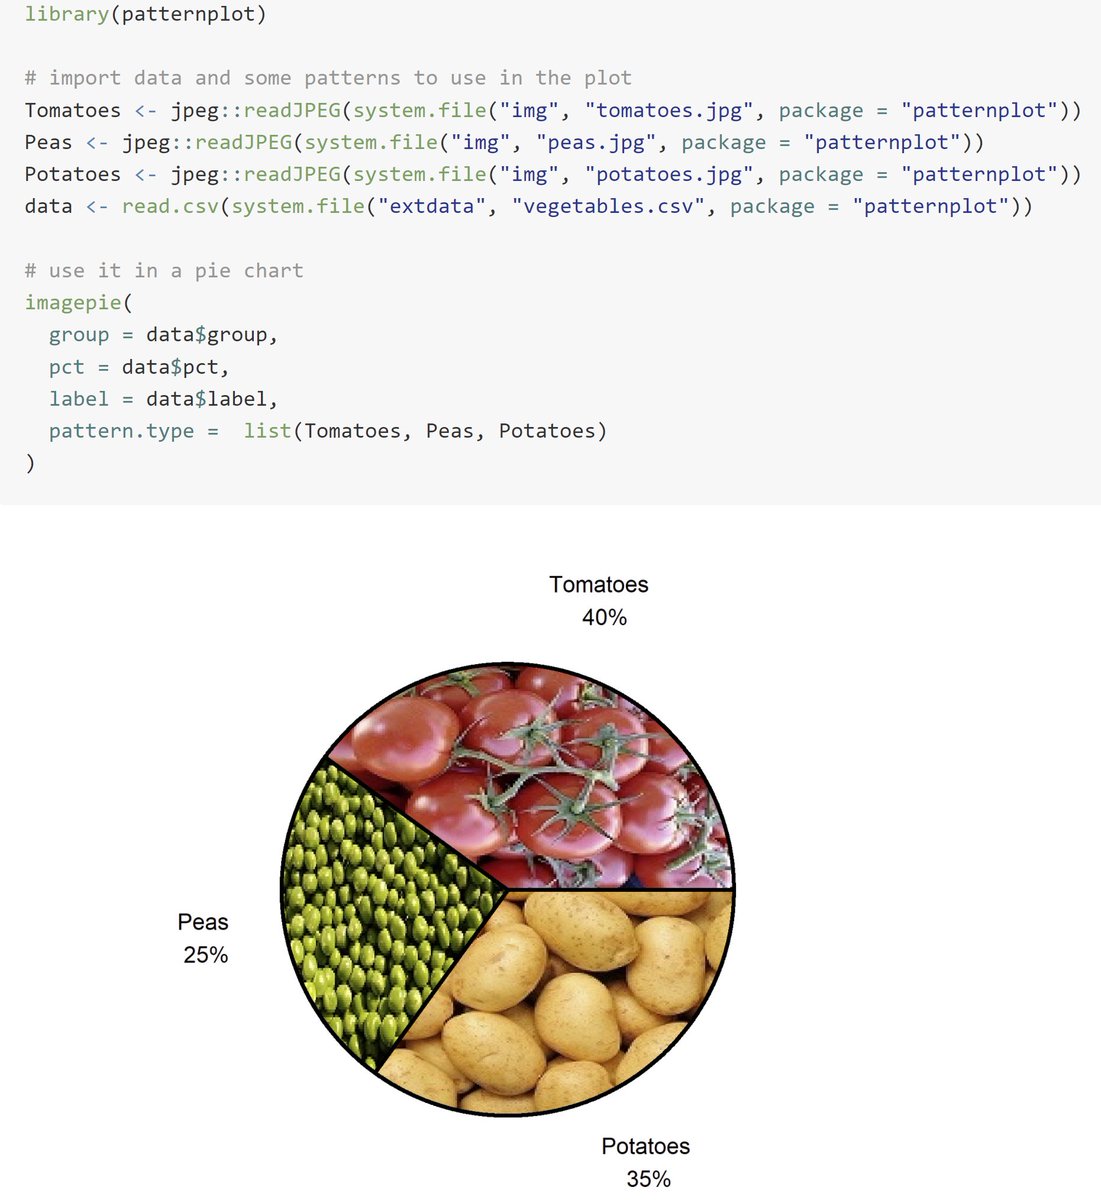
20 Jan 2022
Sometimes you may wish to include some patterns or images in plots for enhanced storytelling.
The {image*} or {pattern*} function family from {patternplot} 📦 provides a way to do so! ⚜️
rdrr.io/cran/patternplot/man…
#rstats #DataScience
34
186
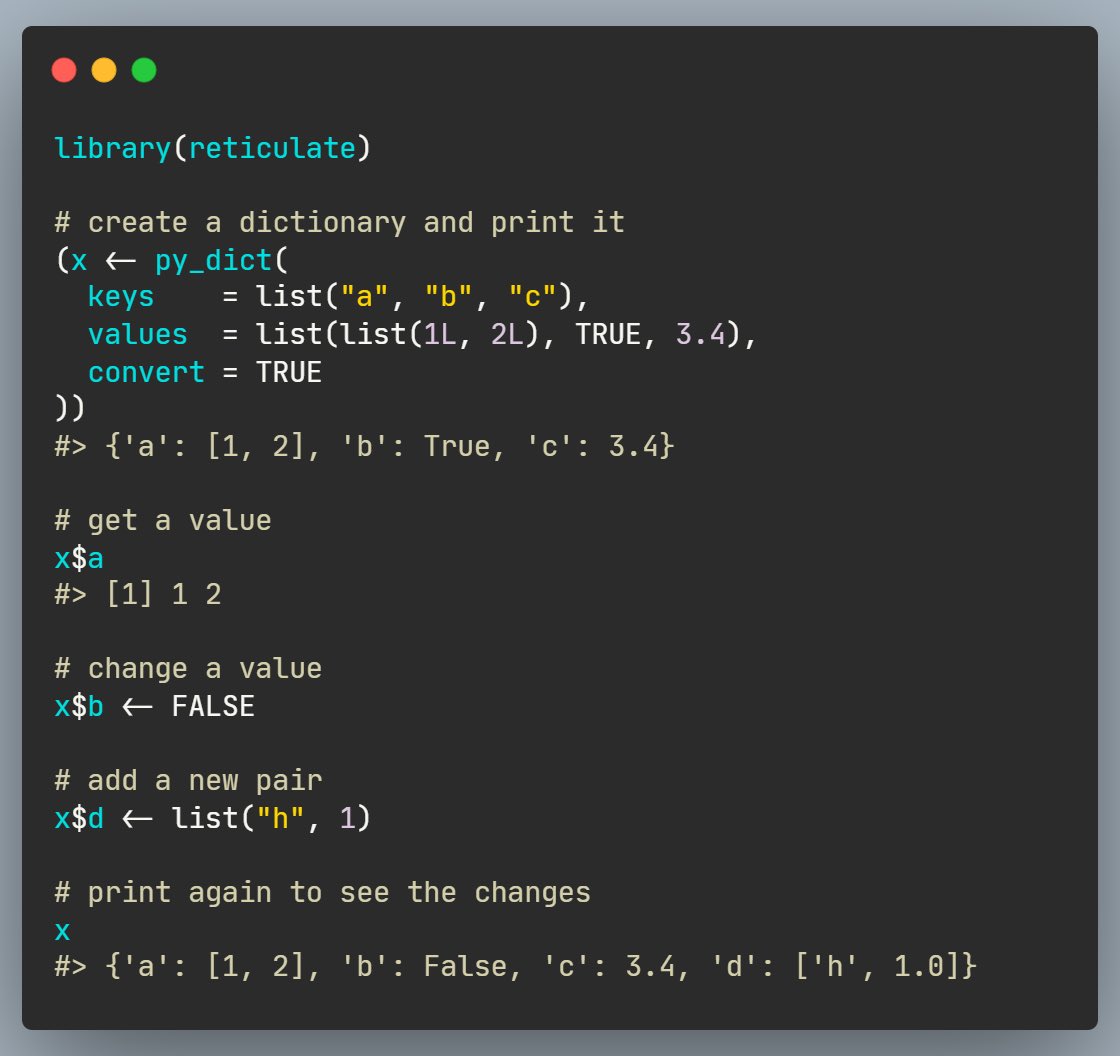
19 Jan 2022
Python dictionary is an unordered data type with key-value pairs that allows accessing values, not by indexing, but via unique keys.
The {py_dict} function from {reticulate} 📦 gives you access to this data type in R! 📖
rstudio.github.io/reticulate…
#rstats #DataScience
2
8
44
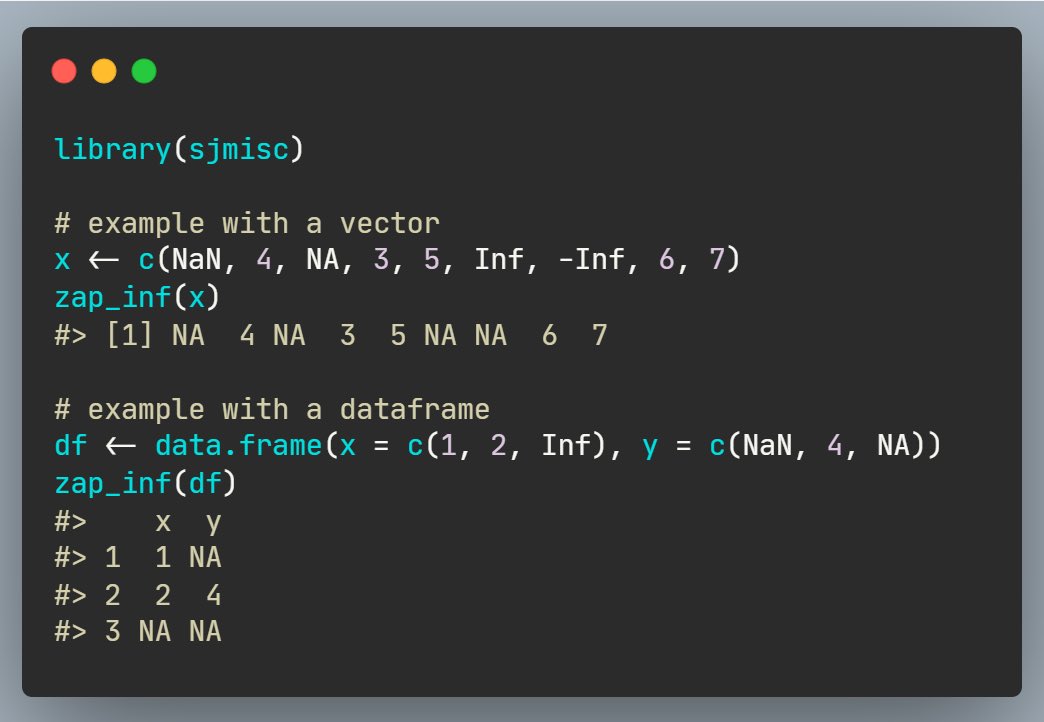
18 Jan 2022
Sometimes, especially in the context of statistical modeling, there might be infinite or NaN's present in outputs that we may wish to replace with NAs.
The {zap_inf} helper function from {sjmisc} 📦 does exactly this! ♾
strengejacke.github.io/sjmis…
#rstats #DataScience
1
9
48
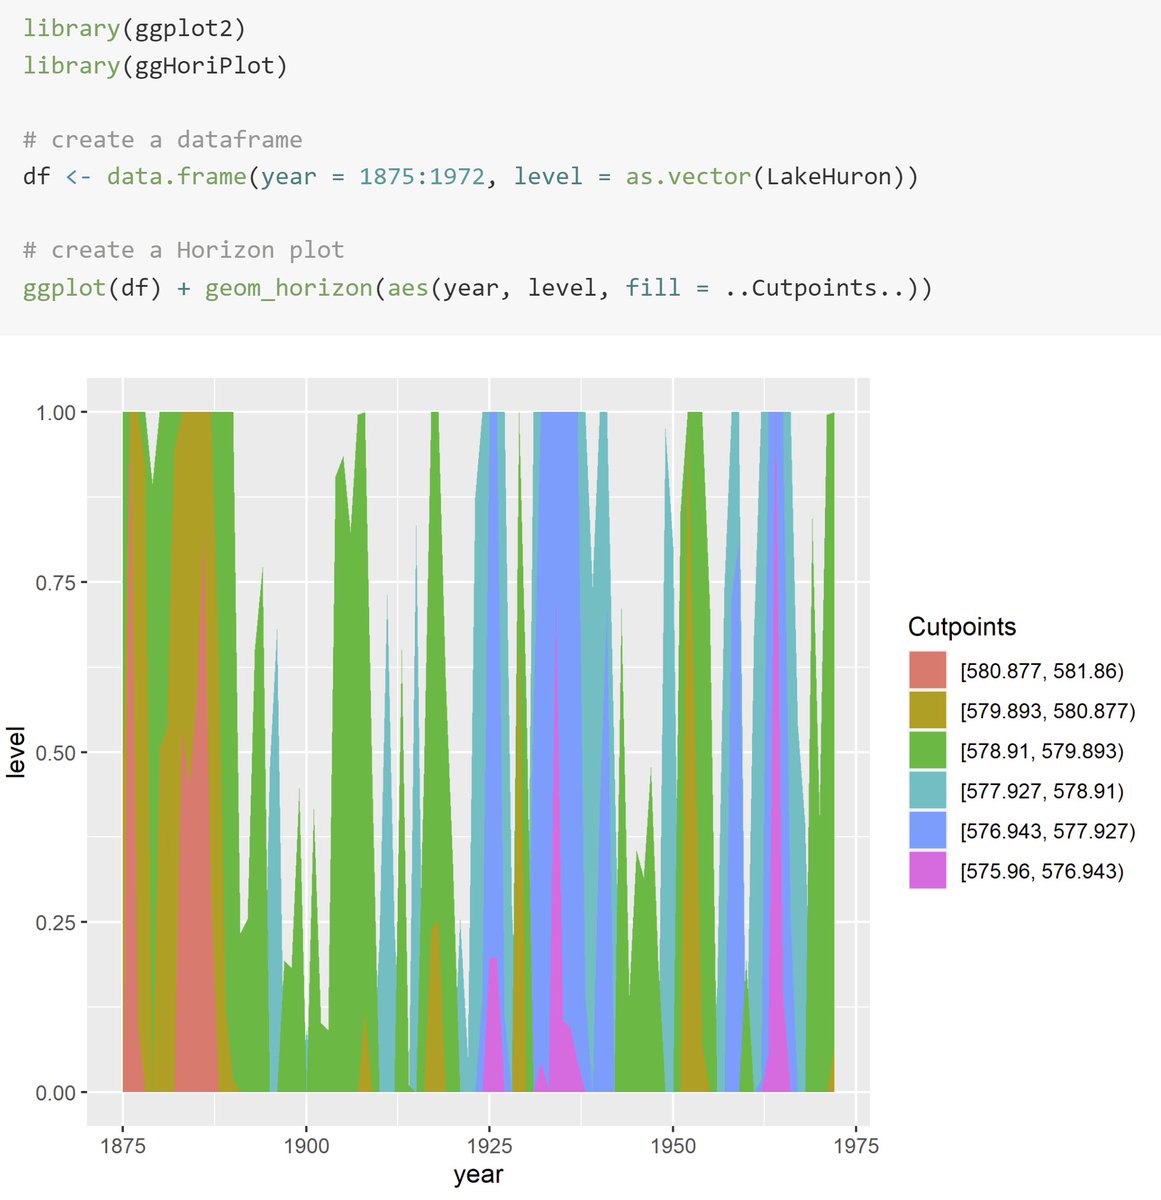
17 Jan 2022
A horizon plot is a compact time-series data visualization to plot and compare different moving values.
The {geom_horizon} function from {ggHoriPlot} 📦 provides just the geometric layer! ⬆️⬇️
rivasiker.github.io/ggHoriPl…
#rstats #DataScience
13
63
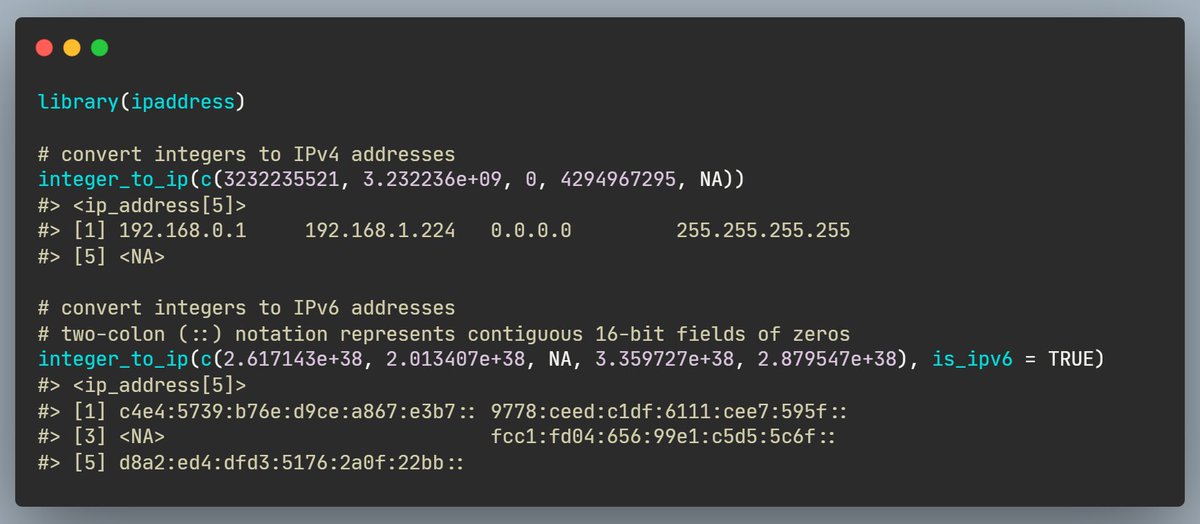
16 Jan 2022
To save space, IP addresses are often stored as integers, and if we receive such data, we may wish to convert them to the familiar human-readable form.
The {integer_to_ip} function from {ipaddress} 📦 makes this conversion easy! 🕸
davidchall.github.io/ipaddre…
#rstats #DataScience
6
40
15 Jan 2022
Although often you can easily read data from a single CSV file, sometimes you have to read a dataset stored in one of the Excel spreadsheets.
The {read_xlsx} function from {readxl} 📦 provides an easy syntax to do so! 📝
readxl.tidyverse.org/referen…
#rstats #DataScience
10
93
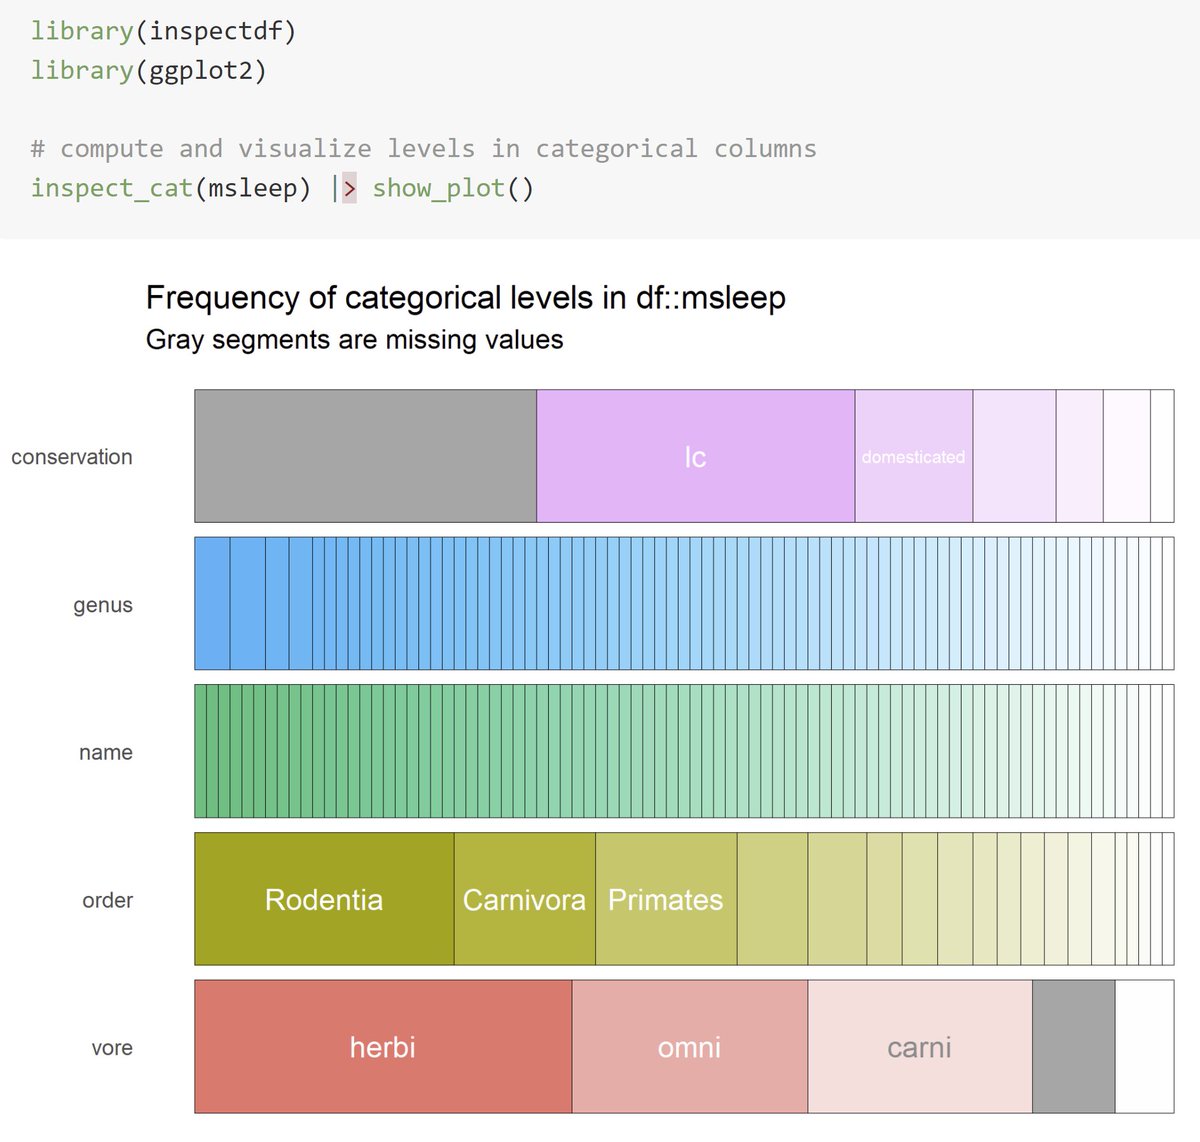
14 Jan 2022
Sometimes you want to quickly compute and visualize frequencies for all categorical variables in the data.
The {inspect_cat} function from {inspectdf} 📦 does so, while labeling most frequent levels and highlighting missing data! 📊
alastairrushworth.github.io/…
#rstats #DataScience
1
54
293
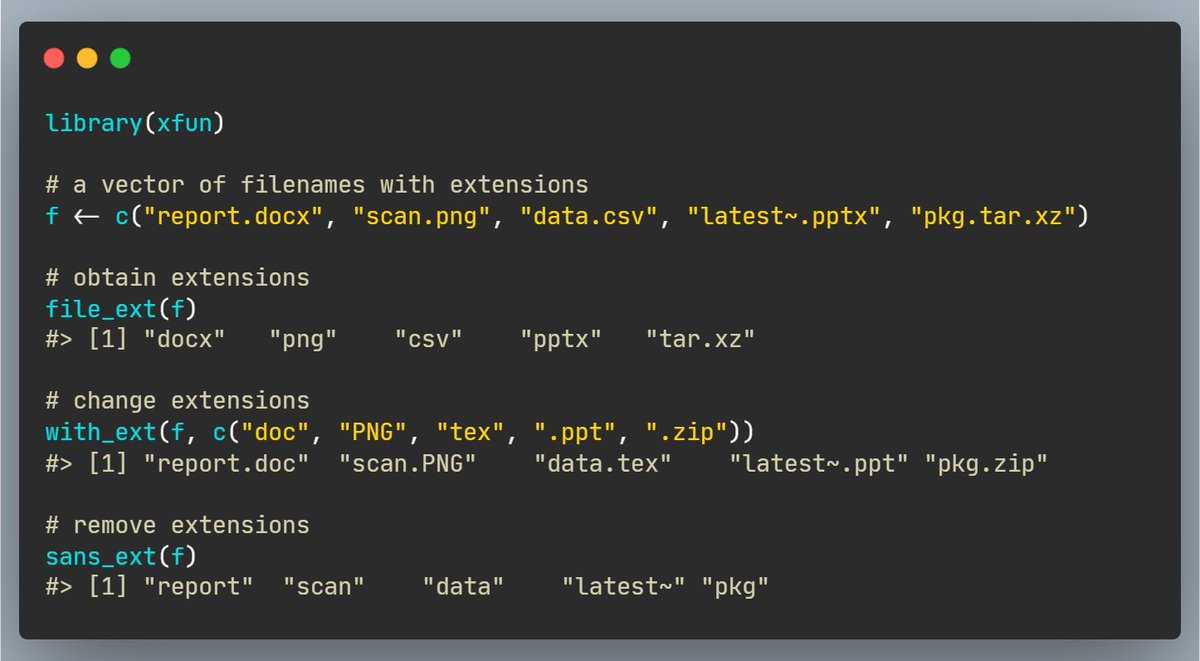
13 Jan 2022
Filename extensions (.py, .csv, .pdf, etc.) decide the characteristics and intended usage of files, and we may wish to work with them further in R.
The {*_ext} function family in {xfun} 📦 provides helpers to do so! 🗂
rdrr.io/cran/xfun/man/file_e…
#rstats #DataScience
1
6
44
12 Jan 2022
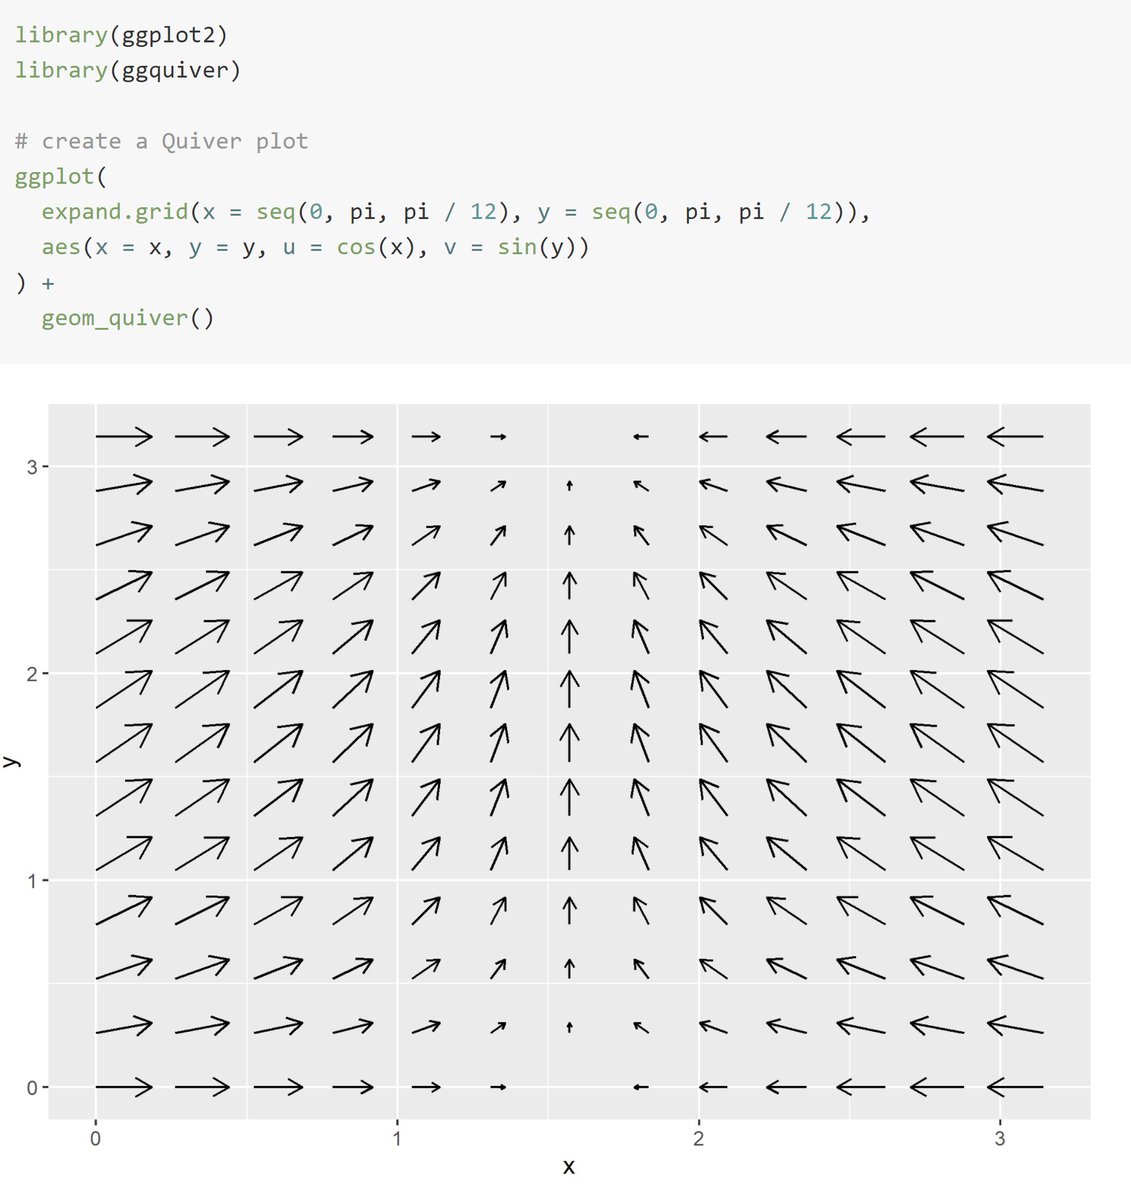
Across disciplines (physics, engineering, etc.), a quiver plot helps visualize vector fields as arrows, and we may need to create such a plot in R.
The {geom_quiver} function from {ggquiver} 📦 offers just the geometric layer! 🌪
pkg.mitchelloharawild.com/gg…
#rstats #DataScience
12
82
11 Jan 2022
A list is a non-atomic vector, and sometimes you may wish to convert (or flatten) it to an atomic one.
The {flatten} function family from {purrr} 📦 provides helpers to do this with type stability! 🗜
purrr.tidyverse.org/referenc…
#rstats #DataScience

12
49
10 Jan 2022
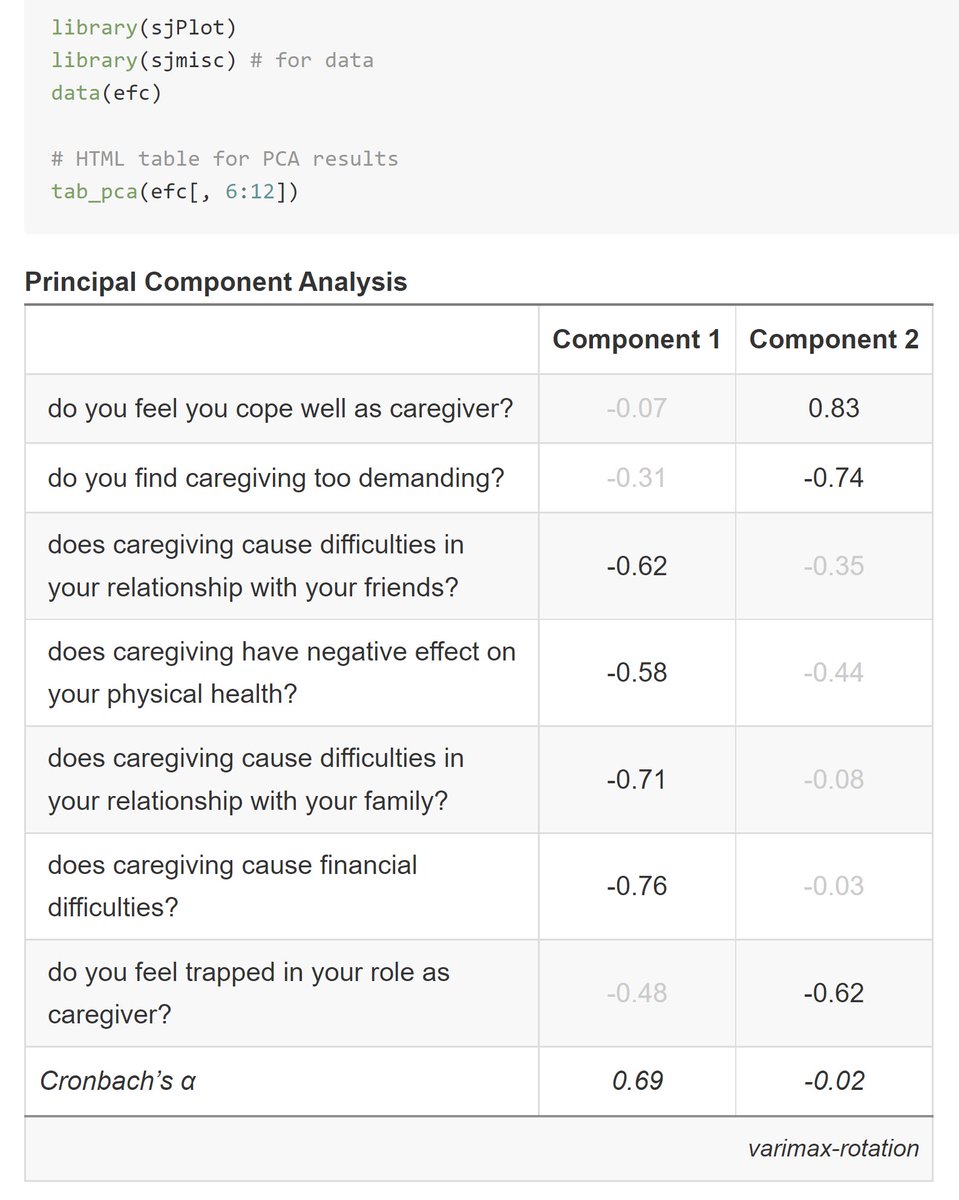
PCA is a popular dimensionality reduction technique and sometimes you may wish to reports its results in a report.
The {tab_pca} function from {sjPlot} 📦 produces publication-ready HTML table for PCA with elegant defaults! 📝
strengejacke.github.io/sjPlo…
#rstats #DataScience
67
329
9 Jan 2022
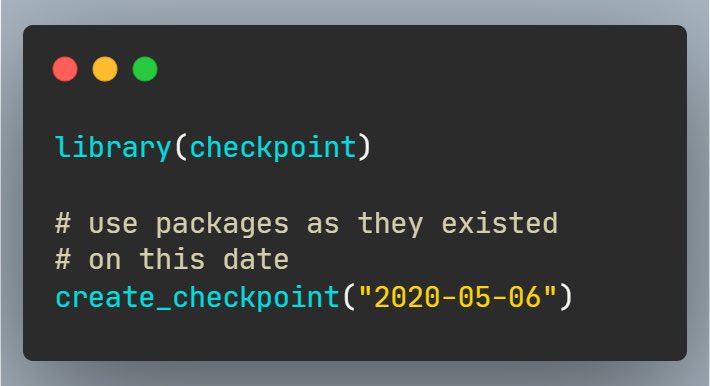
To ensure reproducibility of R script, you may wish it to download needed package versions on a certain date.
The {create_checkpoint} function from {checkpoint} 📦 creates a local library with the needed package versions! 📑
rdrr.io/cran/checkpoint/man/…
#rstats #DataScience
4
99
459