
Teach: @CtrRelPol | Research: @myfaithcounts | Books: The Nones, Great Dechurching, Vanishing Church | Former Pastor: @AmericanBaptist | Graphs about Religion
Joined May 2008
- Tweets 9,946
- Following 178
- Followers 36,400
- Likes 4,359
5,709 Photos and videos


Pinned Tweet

30 Jul 2025
Some personal news.
Starting August 1, I will be joining the Danforth Center on Religion and Politics at WashU (@CtrRelPol) as a Professor of Practice.
I think it's a perfect step for my career as Senator Danforth envisioned the Center to be a place for public engagement around religion and politics.
That's where I see myself headed in the next stage of my career.

68
19
575
102,438
Even among people who never attend religious services, a significant majority still believe in God or a Higher Power (~70% in 2024).
It was ~80% in the 1970s.
23% of never attenders say that they have a certain belief in God.
18% are agnostic
13% are atheist.
1
8
50
2,881
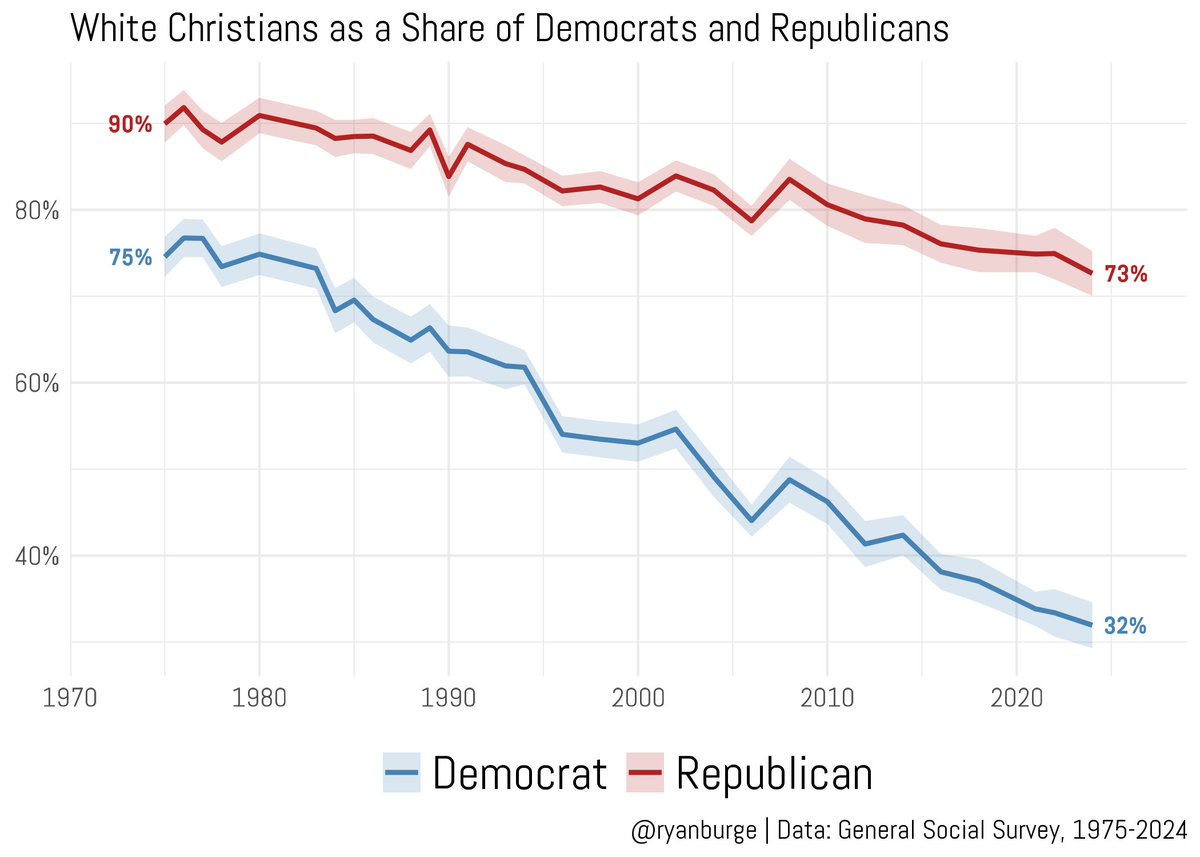
In 1975:
90% of the Republican party were white Christians.
75% of the Democrats were white Christians.
In 2024:
73% of Republicans were white Christians. Down 17 pts.
32% of Democrats were white Christians. Down 42 pts.
10
25
165
9,814
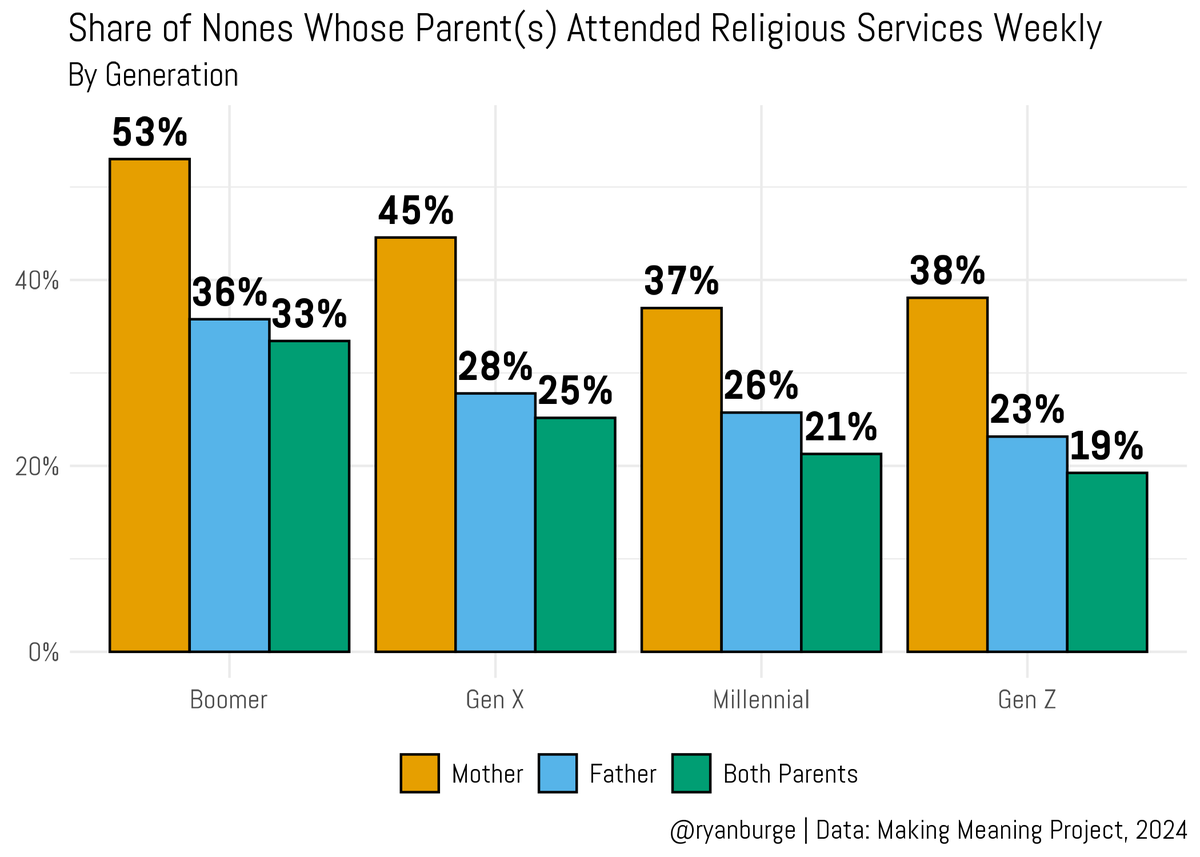
.@jonestony and I asked the "nones" how often their parents went to church when they were kids.
Mothers were much more likely to be weekly attenders compared to fathers (~15 point difference).
But the vast majority of nones didn't grow up in houses where both went often.
2
8
46
4,548
Jun 12
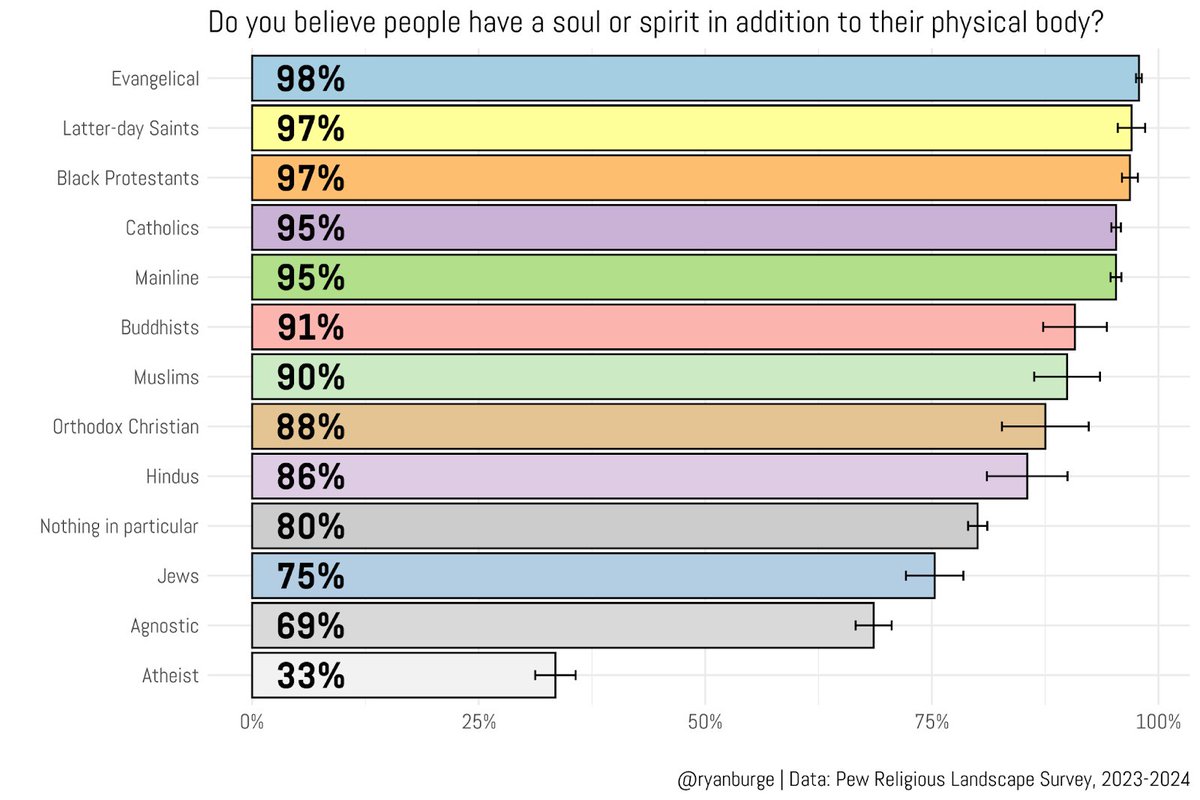
Over 90% of all Americans believe that people have a soul or spirit in addition to their physical bodies.
The groups that buck this trend
Jews: 75%
Agnostics: 69%
Atheists: 33%
13
24
183
58,344
Jun 12
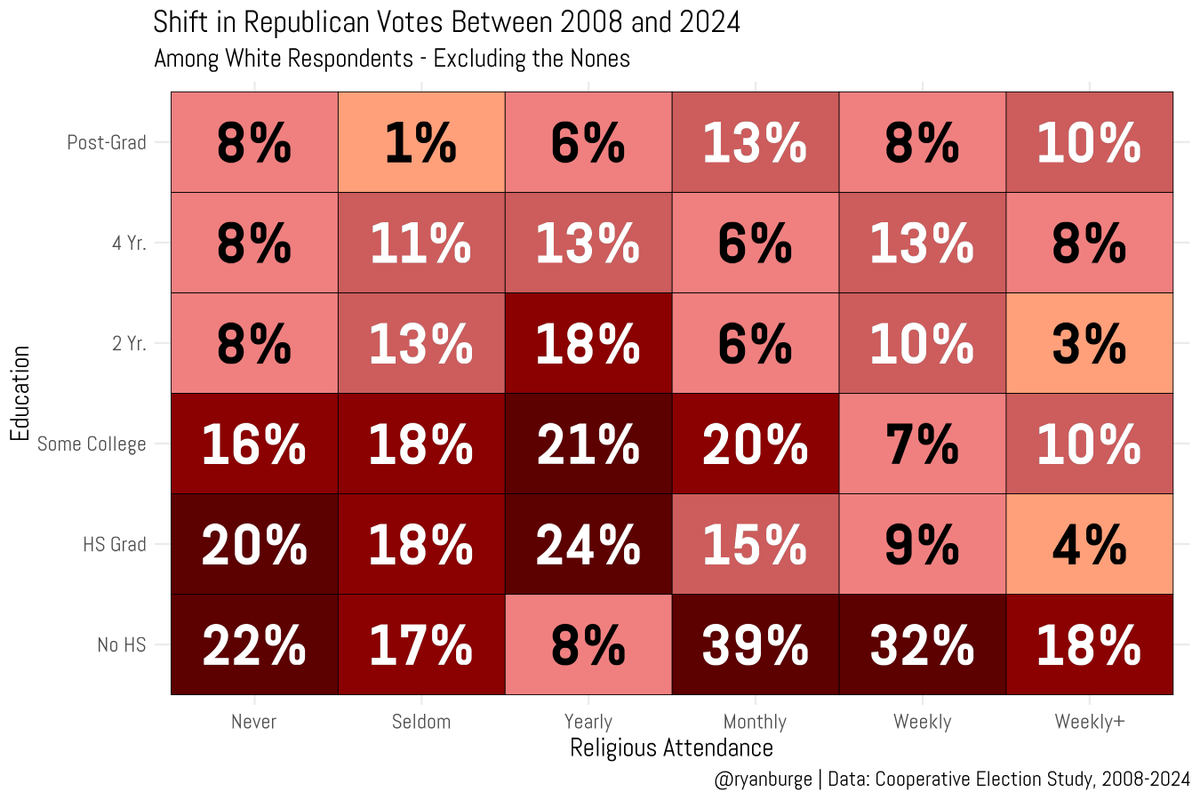
Among white voters from any faith tradition, Trump did better in 2024 compared to McCain in 2008.
There's not a single combination of educational attainment and church attendance where the Democrats have gained ground with white people who are not "nones."
3
5
43
2,803
Jun 11
Does life experience make us less trusting?
Boomer trust was the same from 1972-2010. Then it noticeably dropped.
Gen X is at the same spot now as they were in 2000.
Millennials? Down ~5 points.
But look at Gen Z. The sample size is small, but the line is straight down.
7
13
57
5,784
Jun 11
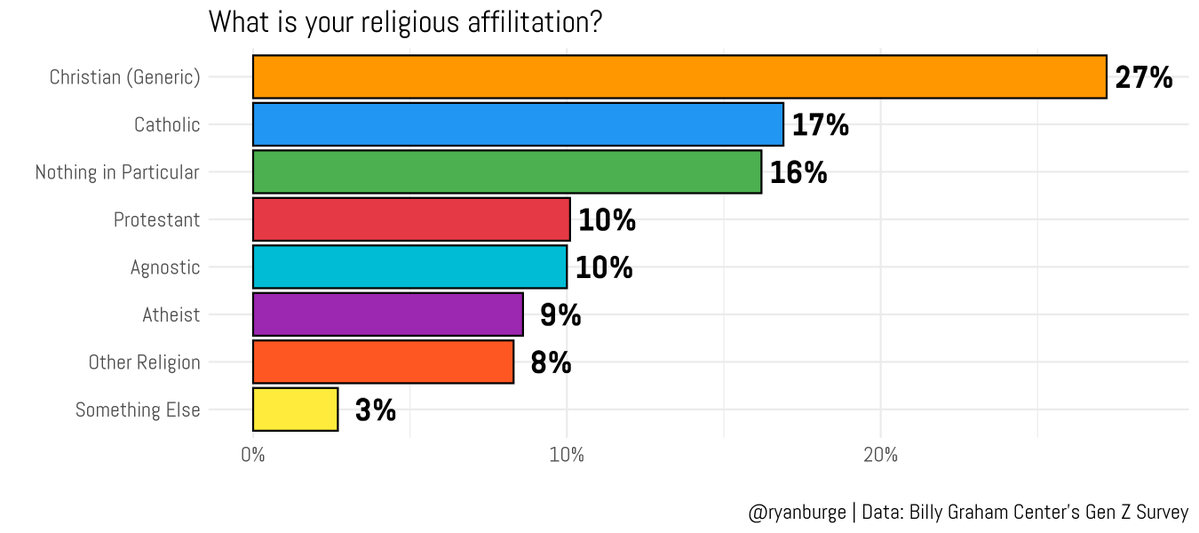
I've been working with the @WheatonBGC on a poll of Gen Z.
And our first article about the data is out in @CTmagazine this morning.
Guess what? Gen Z doesn't know what the word Protestant means.
They are nearly 3x more likely to ID as a generic Christian.
Article below.
17
16
109
11,785
Jun 11
There's a banger of a graph in this one about how Gen Z reports consistent religious attendance through each life stage.
Guess which type of Christian groups the best on this?
It's the Protestants. Not the "Christians"
christianitytoday.com/2026/0…
2
1
21
1,891
Jun 11
Generation Z has the lowest levels of interpersonal trust of any generation we've ever polled.
And although the data is time limited, the velocity of their decline in trust already far exceeds any previous generation.
105
219
1,285
444,969
Jun 11
I ruminate on that in today's free post.
Is it about education? Trust is always linked to educational attainment.
Is it about religion?
I mean, 88% of Gen Z who never go to church say that others can't be trusted....
graphsaboutreligion.com/p/ge…
9
6
57
14,333
Jun 10
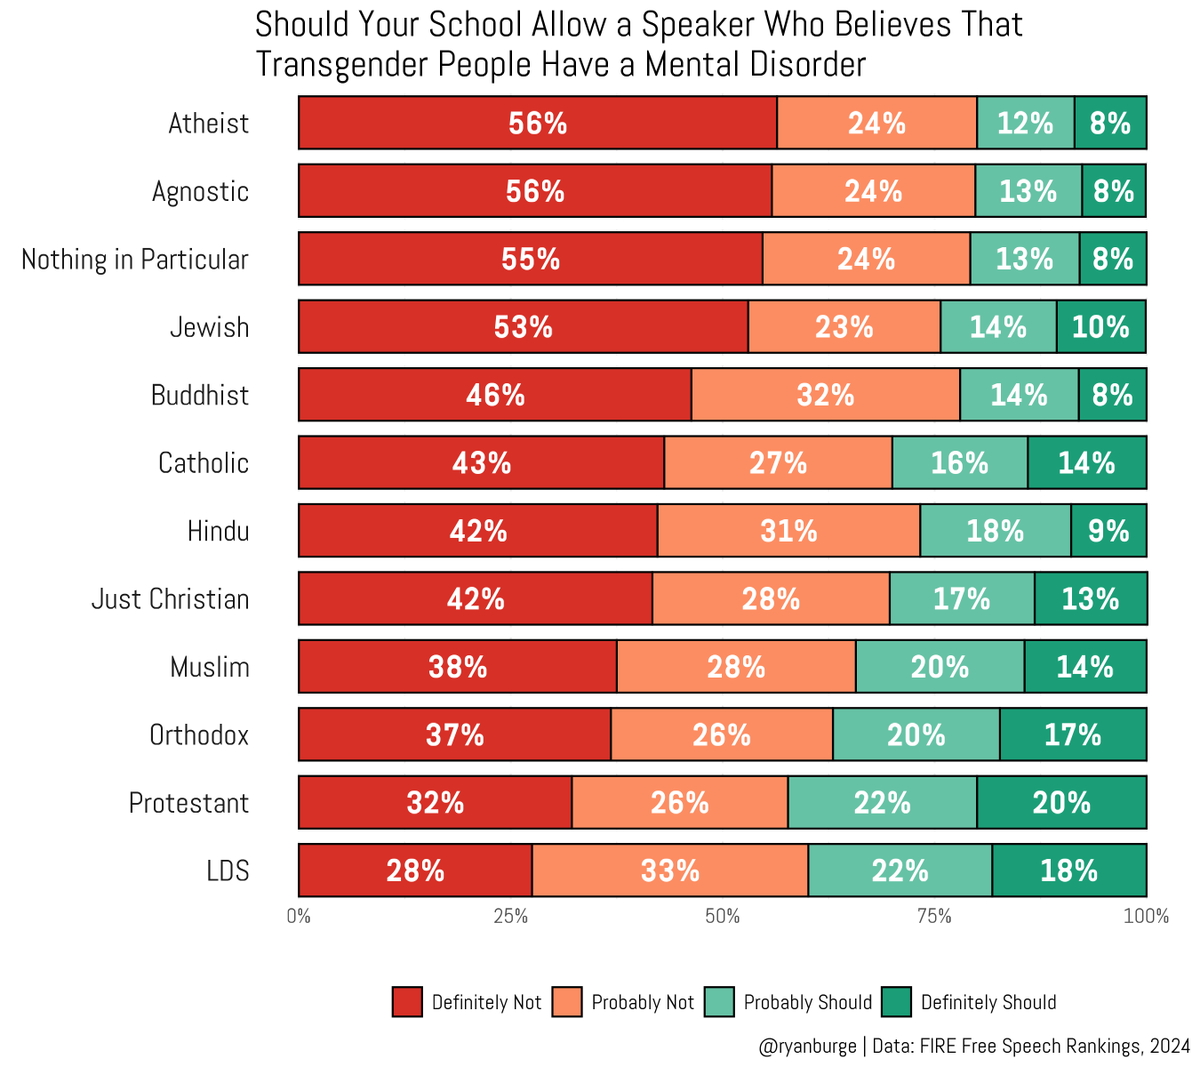
College students were asked:
"Should your school allow a speaker who believes that transgender people have a mental disorder."
The most likely to say "definitely not"?
The non-religious at 55%
The most permissive?
Latter-day Saints and Protestants
6
5
58
24,752
Jun 10
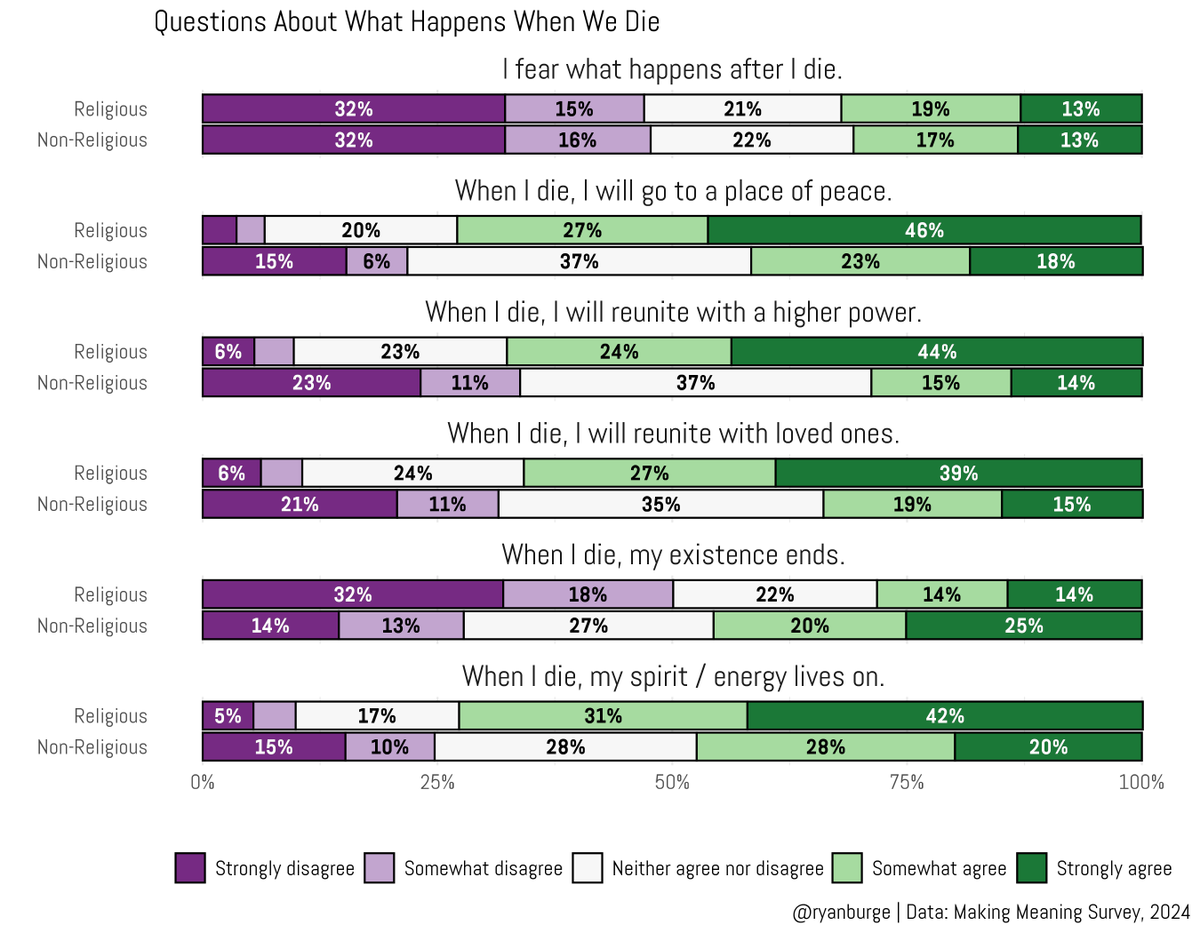
We asked people about happens when they die.
Of course, religious folks were more likely to say things like:
I will go to a place of peace
I will reunite with loved ones.
But on the statement, "I fear what happens after I die"
The responses were exactly the same.
8
17
81
9,312
Jun 10
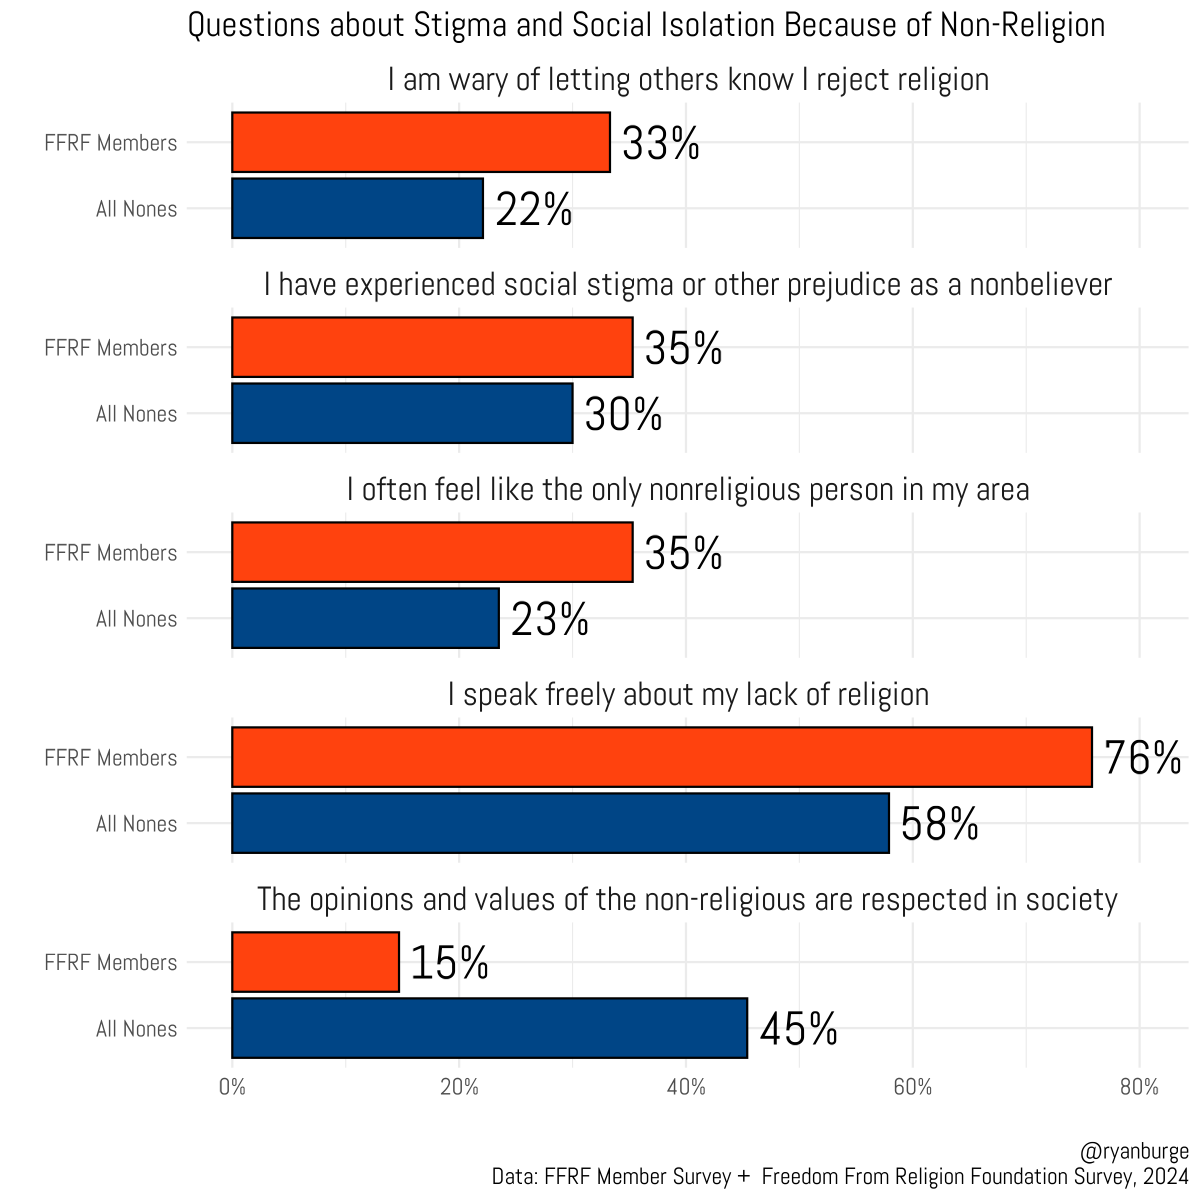
We did a survey of the membership of the Freedom from Religion Foundation.
Then we did a random sample survey of non-religious folks.
The FFRF folks are more likely to feel discriminated against because of their beliefs than the average none.
4
2
32
2,208
Jun 9
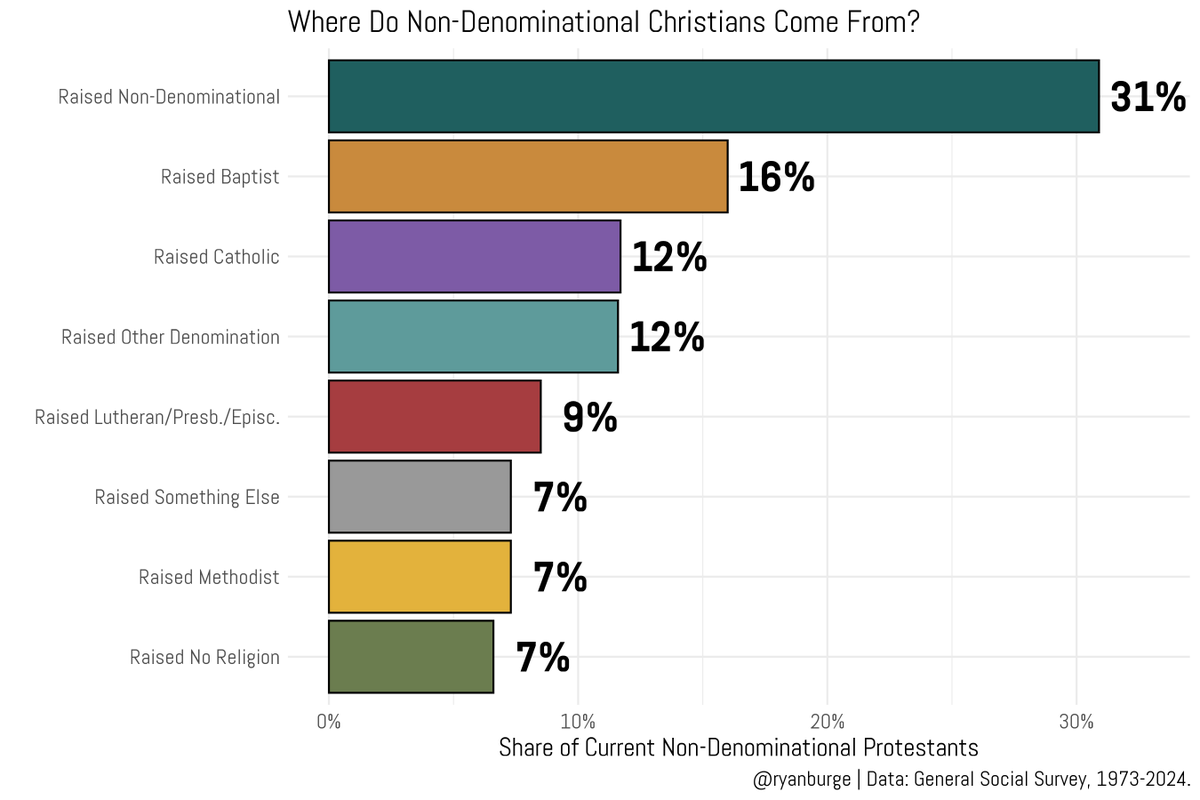
Non-denominational churches are the biggest winners in American religion over the past few decades.
But only 31% of non-denoms today were actually raised non-denom.
The other 69%?
They came from everywhere:
16% raised Baptist
12% raised Catholic
16% from mainline churches
8
16
66
5,185
Jun 9
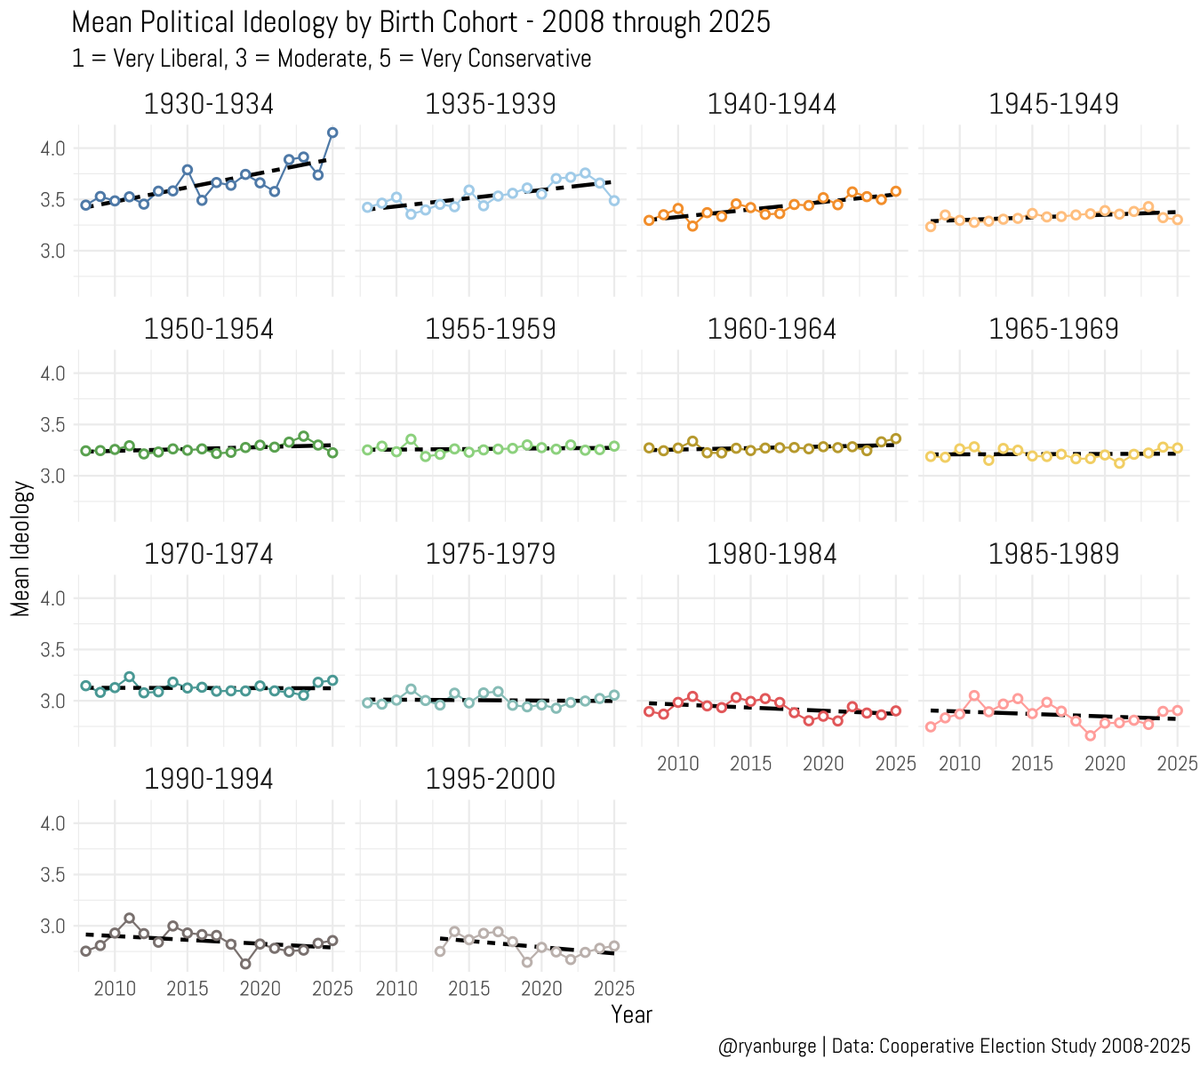
Do we become more conservative as we age?
I tracked birth cohorts as they aged between 2008 and 2025 and the data certainly doesn't point in that direction.
In fact, the typical outcome is that cohorts don't really change their mean ideology much over time.
5
18
56
3,755
Jun 8
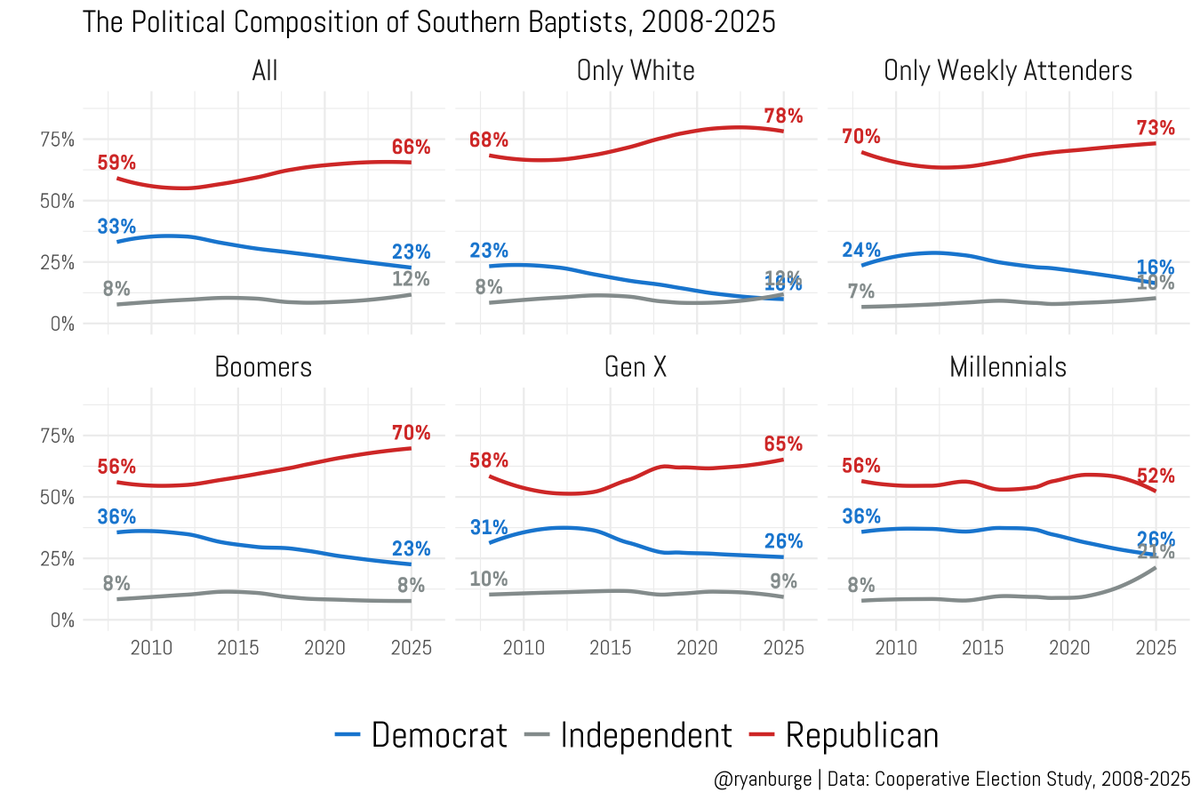
The average Southern Baptist is more likely to identify as a Republican today than they were in 2008.
59% --> 66%
But if we look at only white Southern Baptists it's 68% to 78%.
Boomers are 12 pts more GOP.
Gen X are 8 points more GOP.
Millennials are 4 points less...odd.
8
12
140
18,025
Jun 6
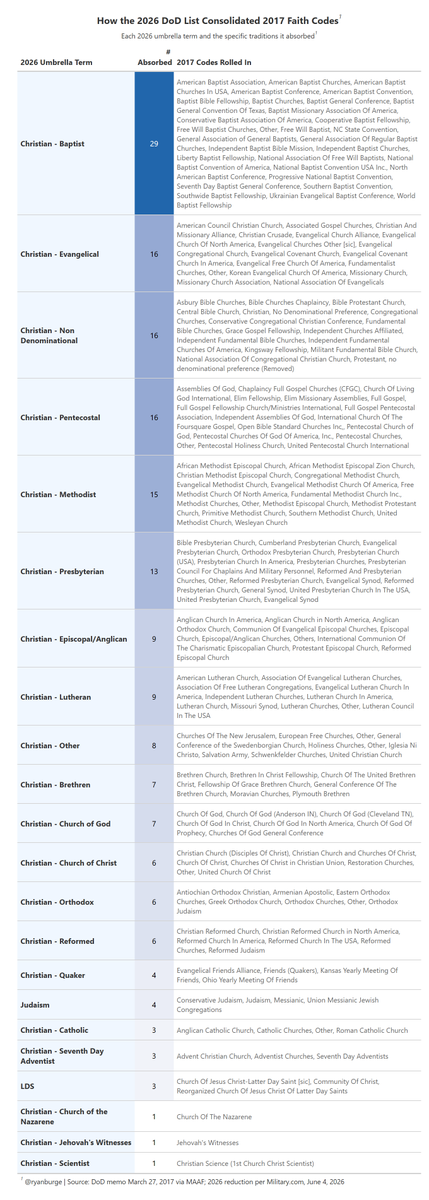
The US Military just made a bunch of changes to their list of Faith Codes.
The gist is that the old list used to include every single type of Baptist in a separate entry. Now, they are all under a single umbrella, "Christian - Baptist"
Another interesting choice is that LDS are not listed as Christians.
53
37
333
340,200
Jun 6
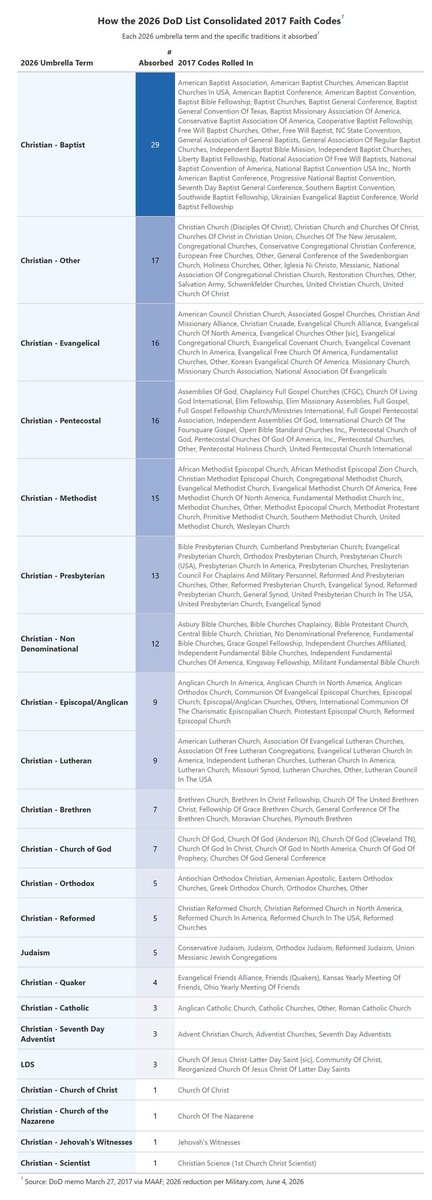
Version 2 is below.
Noticed a few errors in V1.
It's a lot to sort out!
11
7
79
29,677
Jun 8
Just a disclosure on this --
I have absolutely no idea how this is actually going to play out. The DoD has not published their guidelines for how this will all work.
All I did here was look at the old list and the new list and make educated guesses about how those 211 traditions will filter down to 31.
If I were to guess how this plays out, they will make every one choose from the new list of 31 options as opposed to just sorting them on their own.
But, again. I have no idea.
1
8
1,142
Jun 8
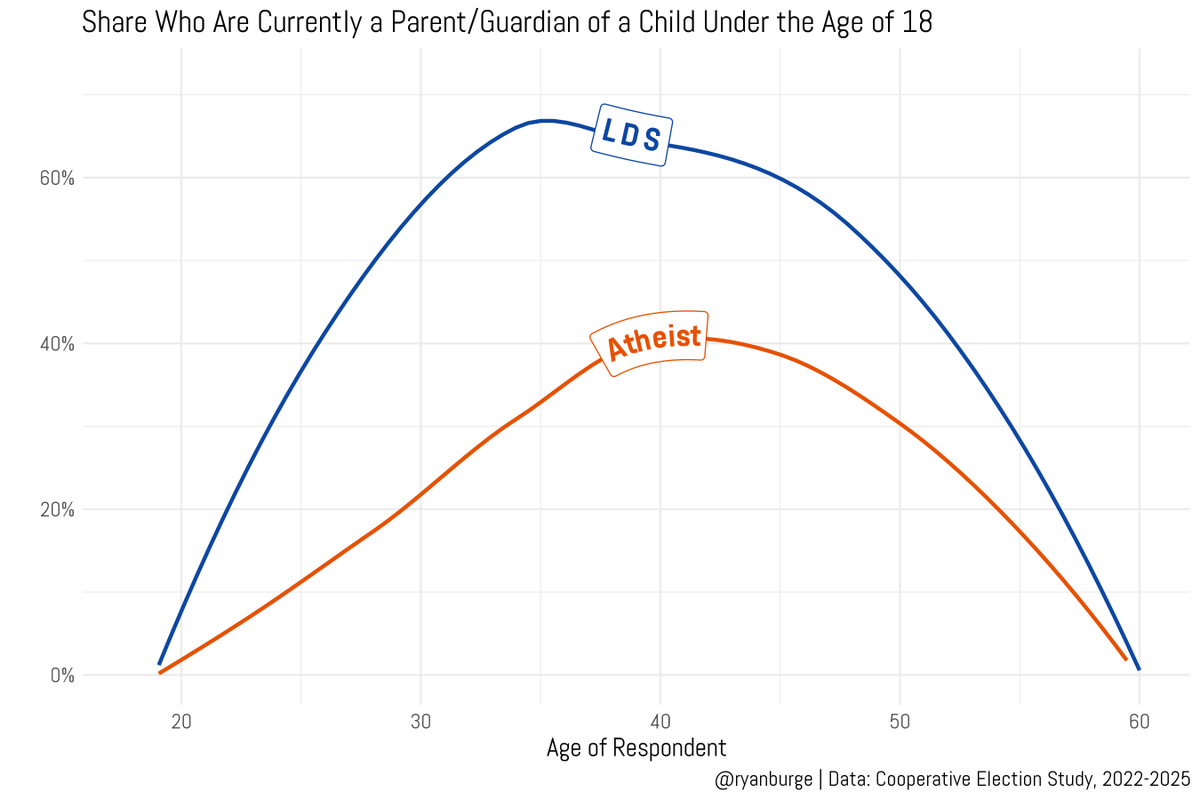
People were asked if they are currently the parent/guardian of a minor child.
Among 35 year old Latter-day Saints, ~65% are parents.
Among 40 year old atheists, it's ~40%.
6
6
50
4,001
Jun 8
It is empirically true -- Americans have never been so pessimistic around their future as they are now.
In 2000, nearly 80% of folks agreed that "people like me have a good chance of improving our standard of living"
Today, it's around 45%.
What's religion got to w/it? 👇

3
13
57
4,602
Jun 8
In today's post, a struggled to find anything that had a measurable impact on feelings of optimism.
Age, education, ideology, even religious tradition yielded nothing.
But religious attendance seems to matter. A lot.
graphsaboutreligion.com/p/ca…
1
2
18
1,482