
Joined February 2013
- Tweets 662
- Following 58
- Followers 377
- Likes 144
137 Photos and videos


May 13
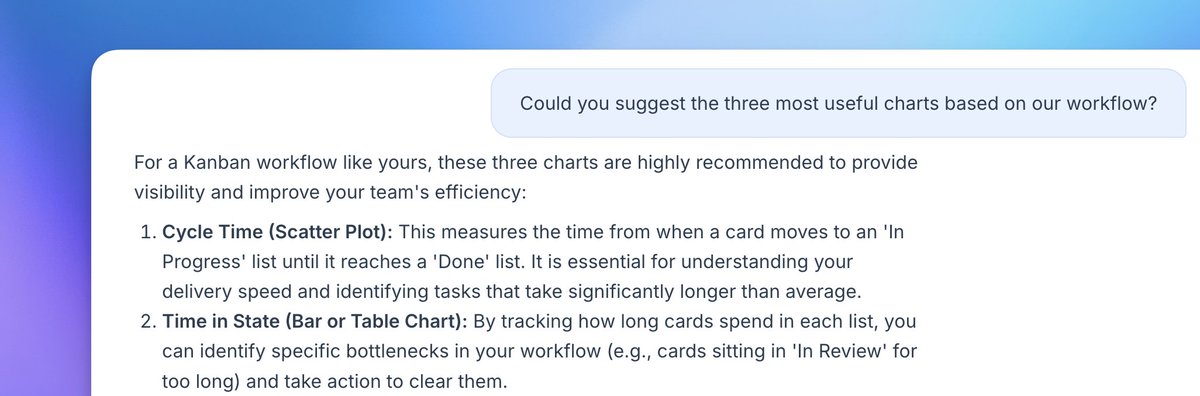
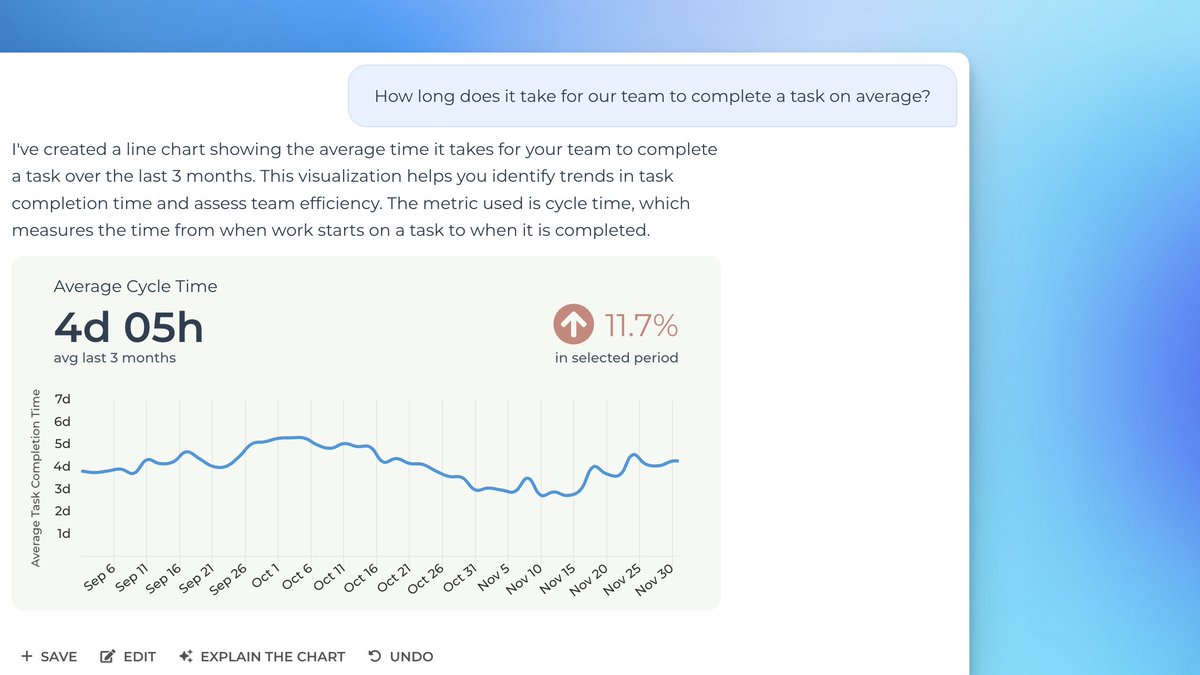
Our AI assistant is now smarter and more capable. Powered by a stronger model with improved context handling, it can create charts, answer questions about your data, and guide you on how to get the most out of Screenful.
Release notes: screenful.com/product-news/a…
12
Apr 16
🚀 New: Screenful now integrates with Teamwork. Turn your Teamwork data into clear, automated reports and insights with the AI assistant.
Release notes: screenful.com/product-news/i…
2
1
65
Feb 6
Our ClickUp integration is live! If you are looking for advanced charting and easy reporting of your ClickUp data, look no further.
screenful.com/blog/introduci…
31
Feb 3
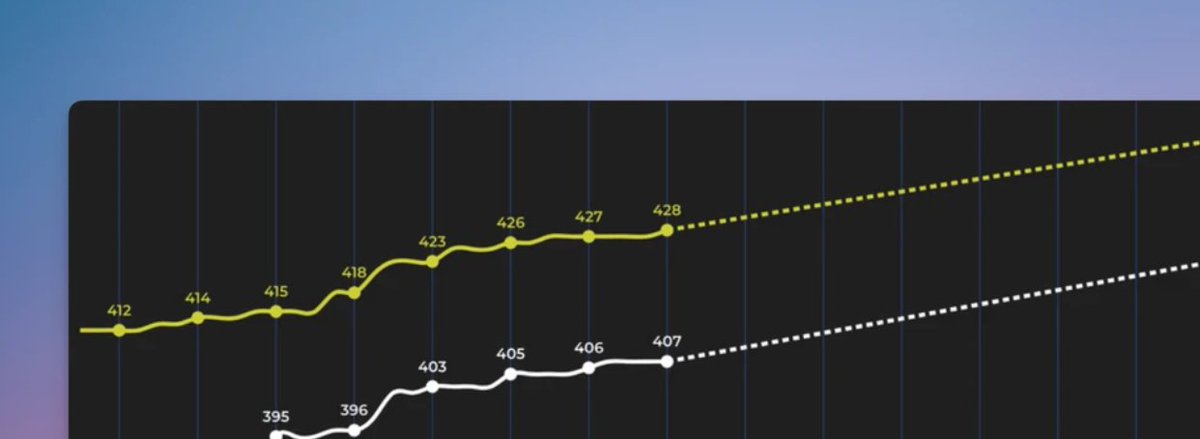
The forecasting chart for Linear shows the progress toward a milestone, such as the completion of a customer project or a new product release. You'll see how much work is done vs remaining, and get data-driven forecasts based on your team's past velocity.
screenful.com/blog/get-data-…
25
Jan 8
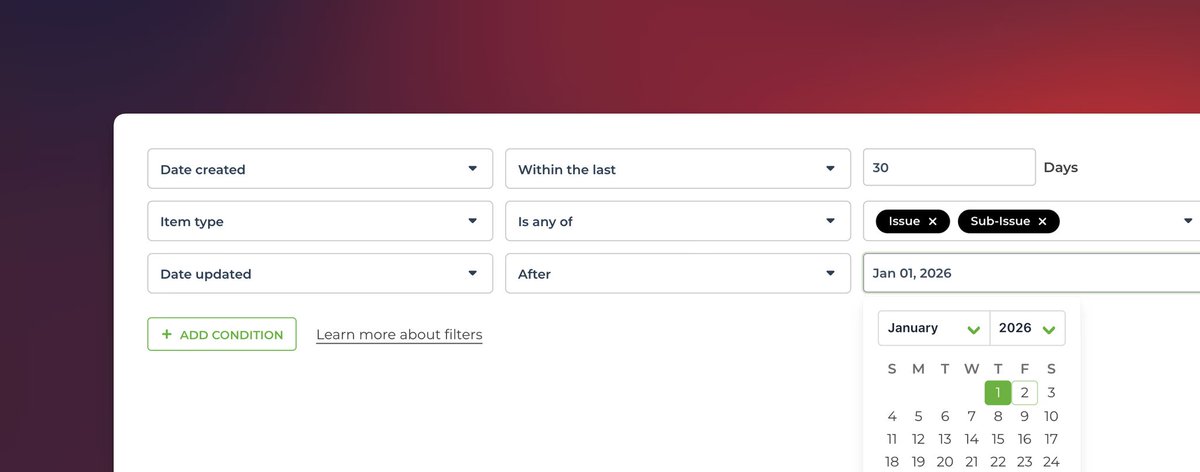
In the latest release, we highlight major improvements to filtering. You can now filter on any number field, date field, or text field. You can also filter by item name using an exact match or a partial match.
Release notes: dub.sh/screenful-2025-12
25
9 Dec 2025
You can now track timing metrics for GitHub Projects! View the lead and cycle times, and how long issues spend in each status.
screenful.com/blog/measuring…
25
2 Dec 2025
We launched the Screenful AI Assistant. You can now create and edit charts with prompts. Ask AI to get insights from your data. Available now for all users!
dub.sh/screenful-2025-11
ALT https://dub.sh/screenful-2025-11
25
3 Oct 2025
We've improved sprints support for Jira and cycles support for Linear. You can now create a sprint or cycle report from a template. It will include KPIs and charts such as burndown, cumulative flow, velocity, and planned vs completed.
dub.sh/screenful-2025-09
1
51
18 Sep 2025
Has your team moved to Linear but is struggling with the lack of reports? We have now introduced our new analytics features for Linear users. Uncover bottlenecks, get automated cycle reports, and more
screenful.com/blog/analytics…
25
7 Jul 2025
We’ve removed the three-unit limit in charts, added the Planned work chart for tracking future events, and introduced a new Knowledge base. Screenful AI is now available in early access.
Release notes: dub.sh/screenful-2025-06
33
10 Jun 2025
We are having an outage with our service provider. You can follow the progress via these status pages:
status.screenful.com
status.heroku.com
44
22 Apr 2025
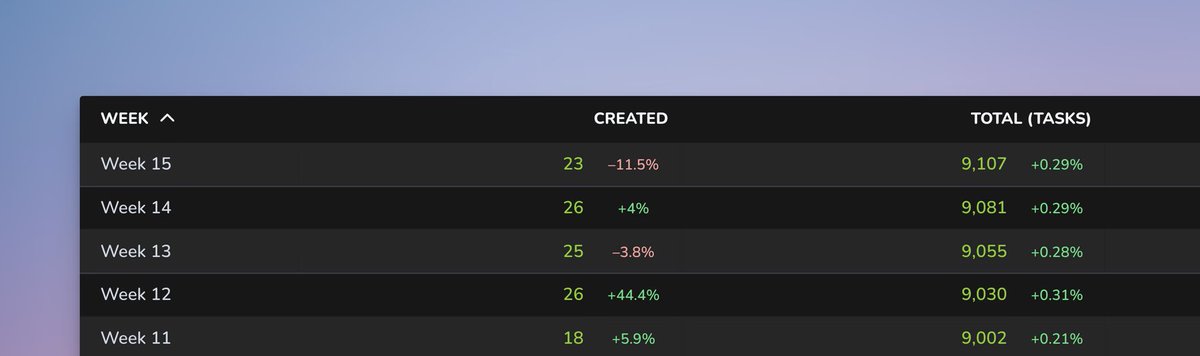
In our first release of 2025, we’re rolling out some powerful new features: improved quick filters, new chart clickthroughs, and percentage change display in Table charts.
dub.sh/screenful-2025-04
1
45
27 Mar 2025
Screenful Analytics 2 now available to all @mondaydotcom users 🚀
screenful.com/blog/analytics…
1
37
10 Mar 2025
Tracking lead and cycle times of @linear issues.
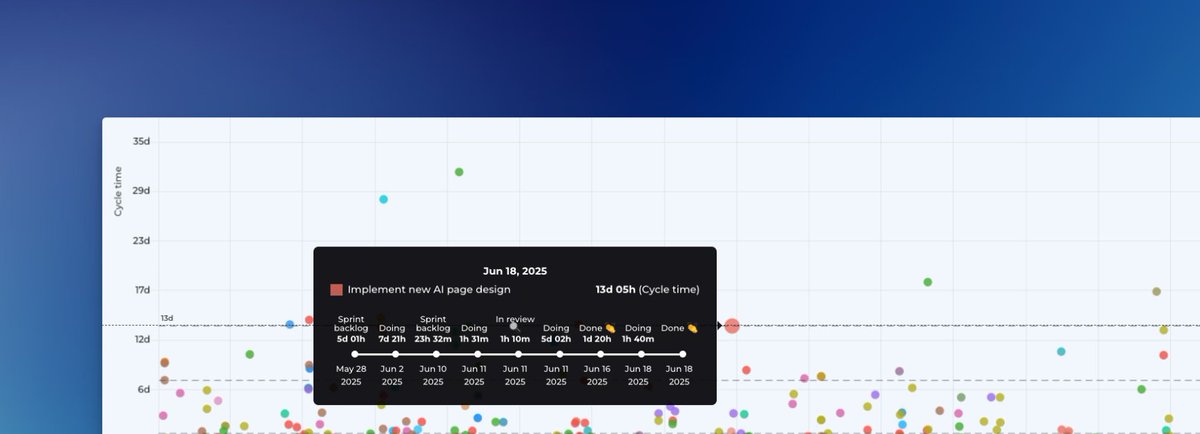
Timing metrics help you to understand how long it takes to complete a task. Cycle time measures the elapsed time when work starts on an issue until it’s ready for delivery.
screenful.com/blog/tracking-…
1
1
52
25 Feb 2025
We're happy to announce that @mondaydotcom formula columns are now supported in all Screenful charts 🥳 📊
screenful.com/blog/creating-…
1
29
14 Feb 2025
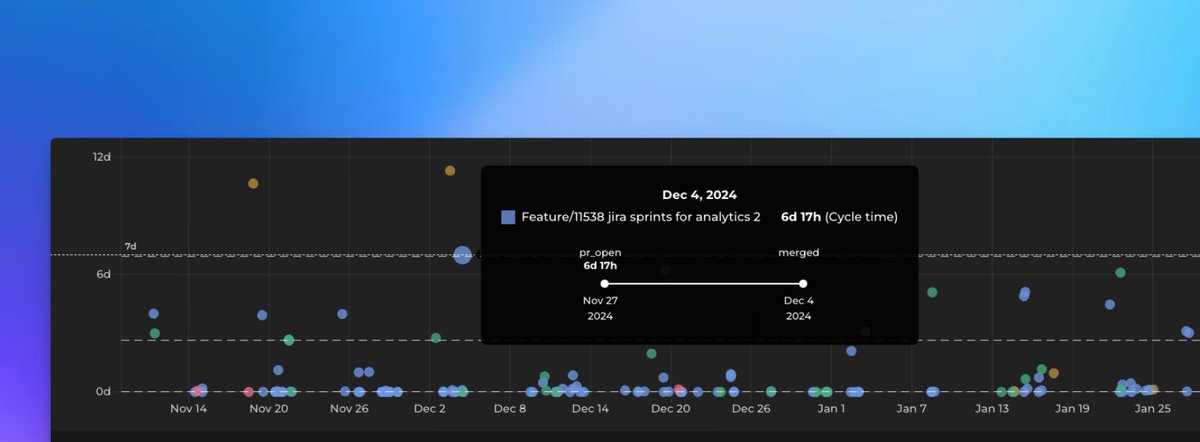
GitHub provides a robust system for handling pull requests, but tracking progress and gaining insights into team performance can be challenging. Learn how to get automated insights from your GitHub pull requests.
screenful.com/blog/tracking-…
#github #analytics
18
26 Jan 2025
Learn how to create bar charts, number charts, line charts, scatter plot charts, table charts, and more, using data in your Trello custom fields.
screenful.com/blog/create-ad…
1
31
24 Jan 2025
You can now create worklog reports using Jira's native time tracking field
screenful.com/blog/creating-…
27
20 Jan 2025
Screenful’s integration with @linear is now live on @ProductHunt! We’d love to hear your feedback – leave a comment, or share your experience. Your support means the world to us! dub.sh/screenful-linear
3
53
8 Jan 2025
We're thrilled to introduce our new analytics engine! More charts now offer clickthroughs and daily grouping. We’ve added a search box to multiple modals, making it easier to find charts and report templates. dub.sh/screenful-2024-12
25