
Joined December 2013
- Tweets 274
- Following 265
- Followers 272
- Likes 363
81 Photos and videos


Pinned Tweet

4 Oct 2025
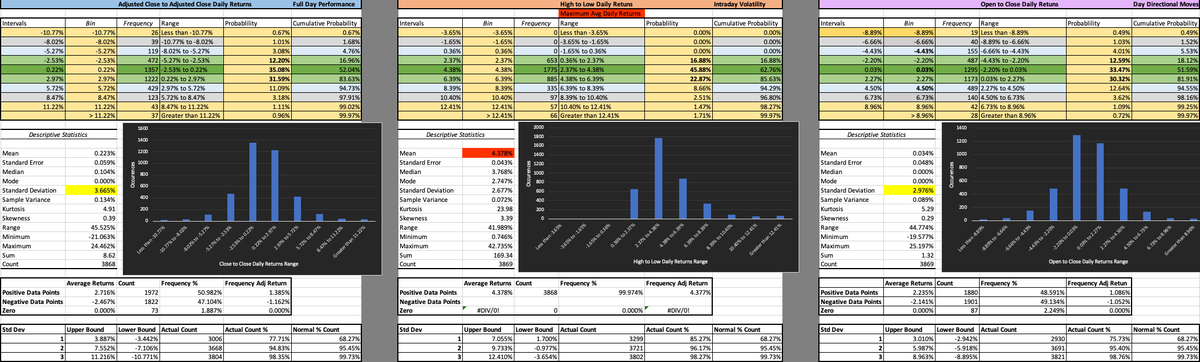
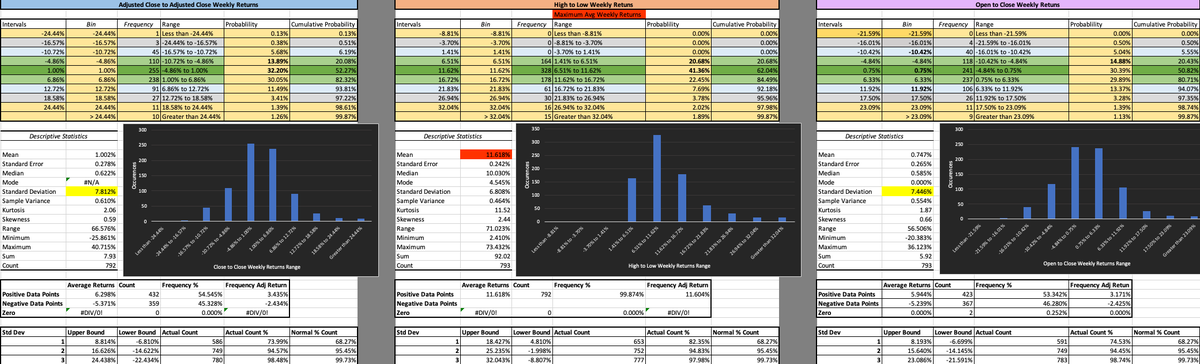
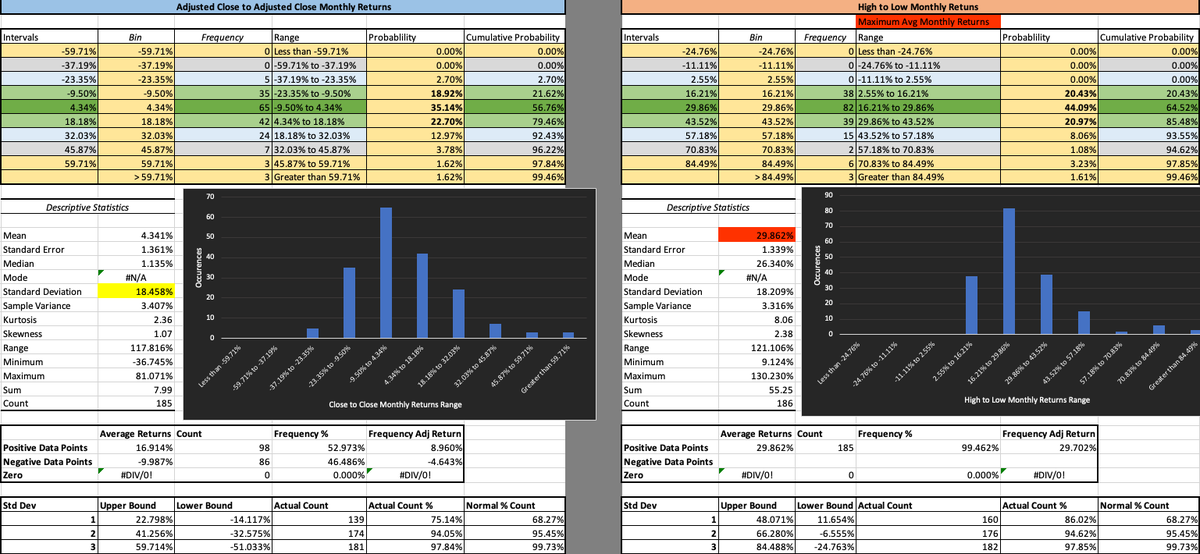
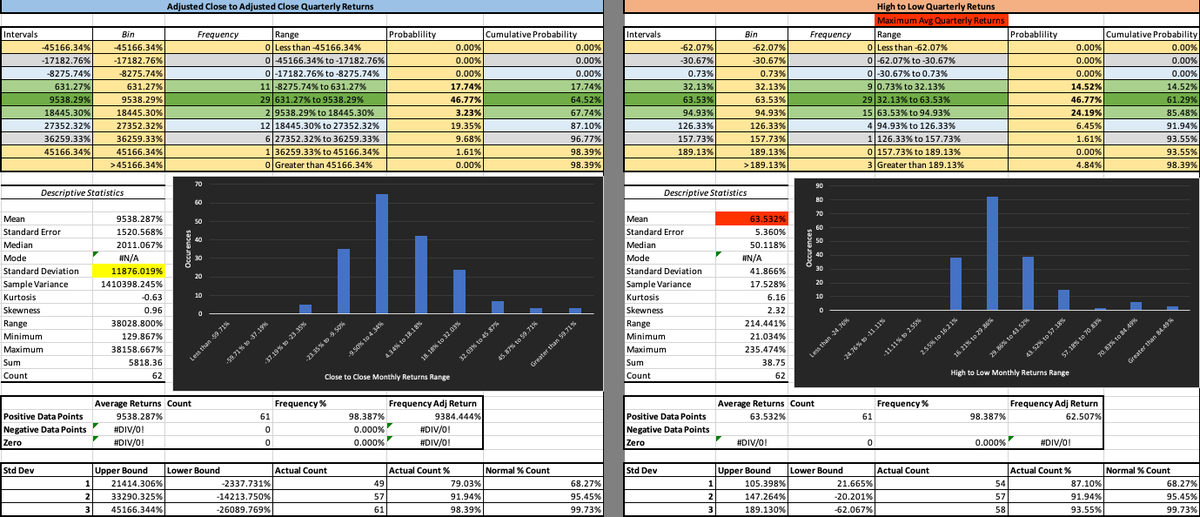
🧵 Let's dive into the distribution of returns for a stock—specifically Close-to-Close (C2C), Open-to-Close (O2C), and High-to-Low (H2L), what these are and what they tell us
These metrics help us understand price movements, volatility, and risk, e.g the characteristics of how a stock trades
These distributions are then analyzed to produce further insights we call descriptive statistics.
I'll use simple simulated data for a made-up stock (like a random walk with a slight upward trend and wiggles) to show examples. Real stocks differ, but this teaches the basics.
2
4
693

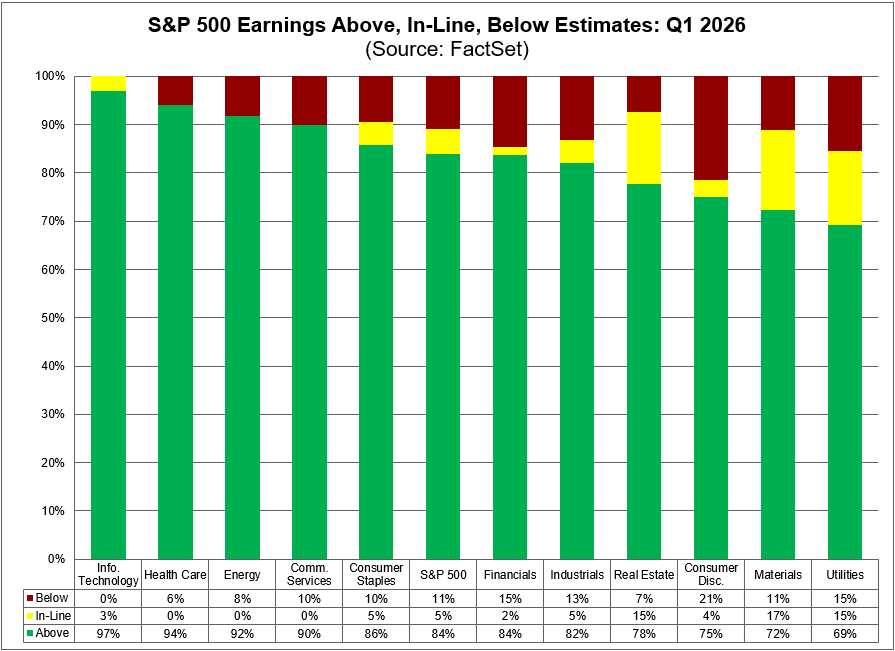
84% of $SPX companies have beaten EPS estimates to date for Q1, which is the highest percentage since Q2 2021 (87%). #earnings, #earningsinsight, bit.ly/4t7s5G8
13
55
5,067
Apr 20
5 distinct categories.
Crisis cripple markets, differently.
What they are, and how to adjust-
Crisis Portfolio Protection Guide
1. LIQUIDITY (-1.38 avg z-score) The deadliest category. Margin calls, credit freezes, forced selling. When liquidity disappears, correlations go to one and everything sells together. COVID liquidation, Lehman, GFC capitulation, LTCM. Average SPY loss: -14.8%.
Rotation Adjustment- Cash and short-term treasuries. Nothing else works in liquidity events because correlations spike to one. Gold sometimes holds but is unreliable during forced margin selling. The only reliable defense is being underexposed before it starts. Average forward 10-day return is -4.35% — the bleeding continues after the initial shock.
- - -
2. TARIFF (-1.17 avg z-score) The newest category and already the most statistically violent. Policy-driven shocks that hit without warning into calm markets. Liberation Day alone produced a worse z-score than any liquidity event except COVID. Six events since 2018, all tied to one strong country.
Rotation Adjustment- Domestic services and treasuries. Tariffs hit importers and manufacturers first. Rotate away from global supply chain exposure toward domestic revenue companies and bonds. The damage is fast but policy-reversible, so don't panic sell. Average forward 10-day return is -2.09% — worse than exogenous but recoverable.
- - -
3. EXOGENOUS (-0.85 avg z-score) The most common category. Wars, terrorism, pandemics, political shocks. Markets hate uncertainty but usually find a floor fast. September 11, Brexit, Asian crisis, Russia-Ukraine. The initial shock is severe but recoveries tend to be swift once the uncertainty resolves.
Rotation Adjustment: Classic flight to quality. Treasuries, gold, defense stocks, the US dollar. These events are fast, violent, and mean-reverting. Average forward 10-day return is only -0.53% — the initial shock is the worst of it. Hold your positions if you can stomach the volatility.
- - -
4. RATE SHOCK (-0.80 avg z-score) Central banks breaking things. Tightening cycles, vol regime shifts, yield curve dislocations. Volmageddon, the 2022 hiking cycle, taper tantrum. Slower burns than liquidity crises but they reset the entire rate structure underneath every asset.
Rotation Adjustment: Short duration everything. Cut long-dated bonds, cut rate-sensitive growth stocks, move to floating rate and cash equivalents. Energy and commodities often outperform because rate hikes usually coincide with inflation. Average forward 10-day return is -1.32% — the pain is gradual but persistent.
- - -
5. SECTOR BURST (-0.68 avg z-score) Bubbles popping in one sector that bleed outward. Dotcom, oil crash, FTX, Enron. The lowest average z-score because the damage is concentrated before it spreads. But when it does spread — like the dotcom bust into a two-year bear — the cumulative losses rival anything. Average SPY loss: -11.3%.
Rotation Adjustment: Move into the sectors that weren't in the bubble. Sector bursts reward diversification — the non-bubble sectors often finish the year flat or positive while the burst sector loses 40-60%. Value and defensive sectors historically outperform during tech bursts. Average forward 10-day return is actually 1.85% — the market tends to rotate rather than collapse.
There are many keywords for each crisis.
Read them, so when they are heard across the media, you can predict two moves ahead.
66
Apr 20
Trump's Liberation Day tariffs hit markets harder than 9/11 and the GFC and COVID— crisis by their z-score
We scored every major crisis since 1997 by statistical impact — how abnormal the move was relative to the market's own volatility at the time.
A tariff announcement ranks number one.
-4.27 Tariffs (Liberation Day 2025)
-3.51 Pandemic (COVID liquidation 2020)
-3.01 Terrorism (September 11, 2001)
-2.41 Vol regime (Volmageddon 2018)
-2.35 Currency Crisis (Asian crisis 1997)
-1.68 Banking (GFC capitulation 2009)
The GFC destroyed more total wealth. But it happened slowly, into a market already braced for pain. Liberation Day hit a calm market like a freight train — the statistical shock was unprecedented.
27 years of data. 35 crisis, many global events.
One press conference at the top.
38
Sharpe Minds retweeted
18 Nov 2025
Big Picture investing from the Top-Down - A (very) Short Summary ⏬️
⒈ Long-term real GDP growth = Labor force growth Productivity growth in the US and most developed economies (1920–2025 average):
Component Approximate annual contribution
Population/Labor force growth
0.8% to 1.0%
Productivity growth (output per worker)
1.2% to 1.8%
Total real GDP growth ≈ 2.0% – 2.5%
The 2% figure is basically the speed at which technology, education, and capital deepening allow a mature economy to compound without major inflation or resource exhaustion.
Emerging markets can grow 4–7% because they are catching up (moving farmers to factories, adopting existing tech, etc.). The US and Europe have already done that, so we are stuck at ~2%.
⒉ Every year, the economy produces about 2% more real goods and services.
Corporations keep a large part of that as profits → they reinvest some and pay out some.
- Corporate retained earnings & buybacks~50–60%
- Household savings → 401(k)s, pensions, mutual funds~25–30%
- Foreign capital inflows (trade deficit financed by foreigners buying US assets)~10–15%
- Venture capital, private equity, IPOs~5%
Net result: Every year, roughly 6–8% of the entire stock market’s value in new capital is reinvested back into equities (a mix of buybacks new savings). That alone creates a strong upward drift even if valuations stayed perfectly constant.
If valuations (P/E) stay constant, the market compounds at roughly 6–8% real 2–3% inflation = 8–11% nominal per year.
The S&P500 returned an average of 8.42% inflation-adjusted over the past 20 years.
⒊ So overtime it appears stocks 'only go up'.
‼️This is excluding the crucial and under-appreciated point: Every year a few hundred companies disappear from the stock market indexes. ‼️
Mergers & acquisitions remove 150-250 per year.
Bankruptcy / delisting remove 30 - 80 per year.
Spun off or no longer qualify removes 50-100 per year.
Number of IPOs additions in a normal year: 150-250
➡️Net addition only ~0-100 per year.
Ratio 'companies removed' to 'new IPO/additions: 1.5:1
In other words, for every company that enters the major indexes, 1.5-2.5 companies are quietly removed.
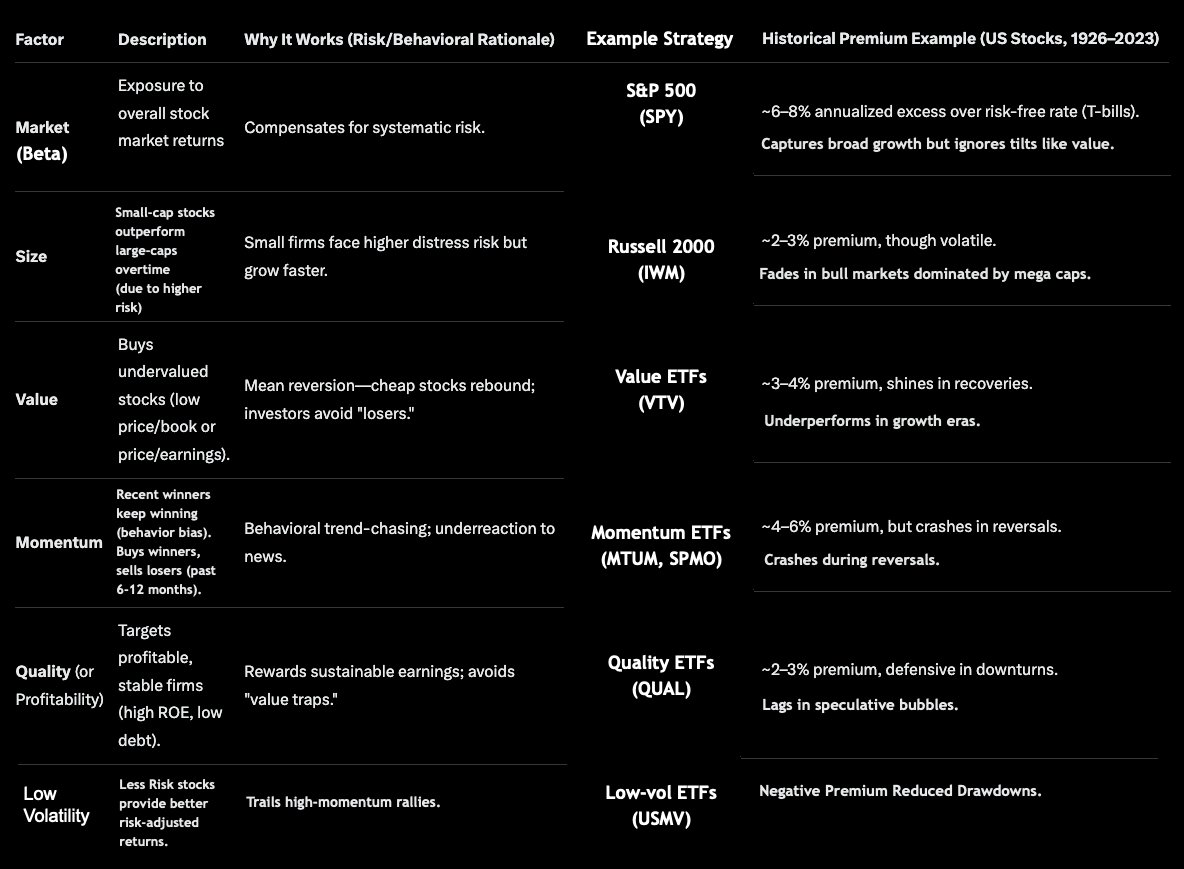
⒋ What do investors seek then? Colloquially, excess returns. Then ask, what factor best correlates to excess returns? Think about this for a minute.
Technical indicators are just mathematical equations.
Which technical indicator has the highest correlation to returns?
ℹ️The market mechanics and their hierarchy of importance and the indicators that help define them:
DIRECTION / TREND
(SMA/EMA 5/12, 34/50, 50/55, 200)
TTM_Trend
MOMENTUM =Closecurrent−Closeprevious(n) - How fast and forcefully the market is moving in a direction.
RSI
SRSI
ROC
TTM_Squeeze
MACD
OBV
STRENGTH
Strength is simply defined by when a stock reacts less than implied by beta. Shows how sustainable the momentum and direction are.
ADX
DMI
VOLUME
Confirms or invalidates price moves. The fuel behind strength and momentum. Derivatives are the fuel.
RVOL
VMA
VPT
VOLATILITY - Volatility is the environment - Affects risk, position sizing, and strategy choice
BOLLINGER BANDS / KELTNER CHANNELS
ATR
VIX
SENTIMENT
BPI
Put/Call Ratio
PE Multiples Market Breadth Social Data / AI
❓So which of these best predicts excess returns❓
Momentum.
Expected excess returnᵢ ≈ β_MOM × Momentumᵢ β_VOL × IdioVolᵢ … ≈ λ × Momentumᵢ
Traders seeking volatility are actually seeking momentum. Volatility, namely, is how we measure our risk in the market. To seek risk for risks sake does not equal excess returns.
Wrapping up, in the image below is a list of factors that can be sought.
Great source for a breakdown of some well known mathematical concepts: blog.quantinsti.com/standard…
1
191
Feb 22
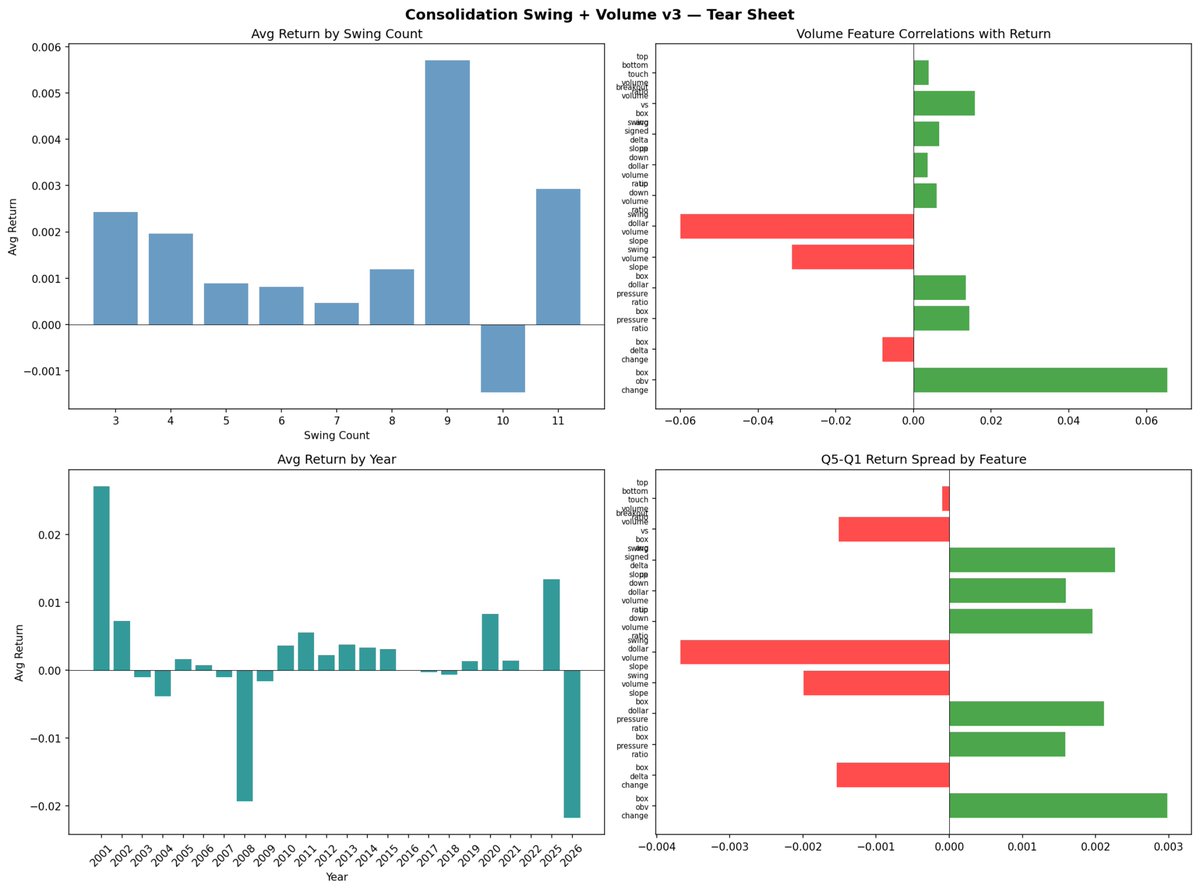
We replicated Du Plessis' "Signals" study — 17 technical indicators backtested across 223 stocks over 20 years, 17.34M simulated trades. His thesis: simple threshold-based signals with proper allocation beat complexity.
We ran our own 20-year backtest (2006-2026) across ~5,000 stocks to verify. Here's what we found 🧵
1
86
Feb 22
🔑 The big takeaway: None of the Top 5 indicators beat our ML models on Sharpe ratio as standalone signals.
Yet, these verified signals now become features feeding into our models. A validated ADX or ULT threshold crossing isn't a trade — it's a predictive factor with 20 years of confirmed edge. Stacking proven technical signals as inputs to ML is where the real compounding happens.
Independent replication matters. The manual got the rankings right and the allocation insight right — that's genuinely valuable.
1
1
57
Feb 22
Want to know more?
I will be guiding followers through algorithmic trading for free.
If you are serious about setting up your own algo platform, let's set up a call.
53
Feb 22
Algorithmic Trading Study
Regime Change Identifier
Goal: Discover improvements to a raw strategy, attempting to identify shifts between bear/bull markets to shift portfolio allocation between strategies (Momentum, Value, Quality, Mean Reversion)
Work began on 4 levels -
1
1
113
Feb 22
Want to know more?
I will be guiding followers through algorithmic trading for free.
If you are serious about setting up your own algo platform, let's set up a call.
52
Feb 21
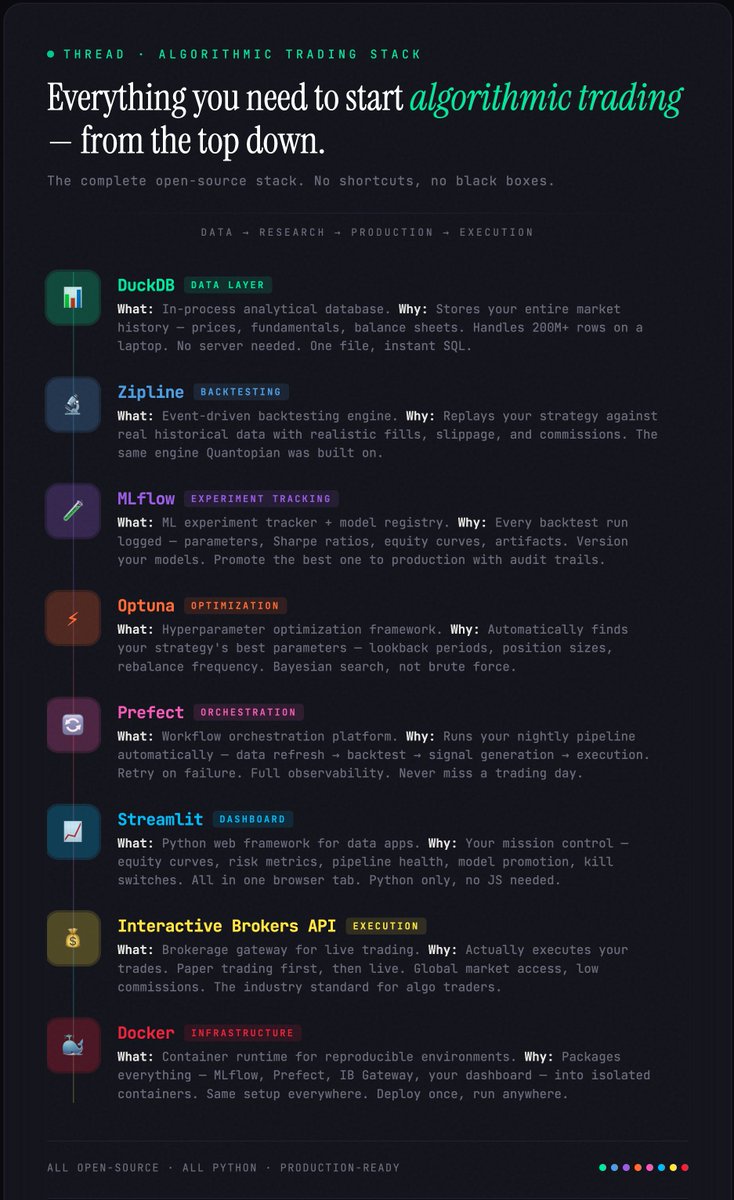
Want to know the full stack of tools you need to algorithmically trade for free?
2
63
Sharpe Minds retweeted

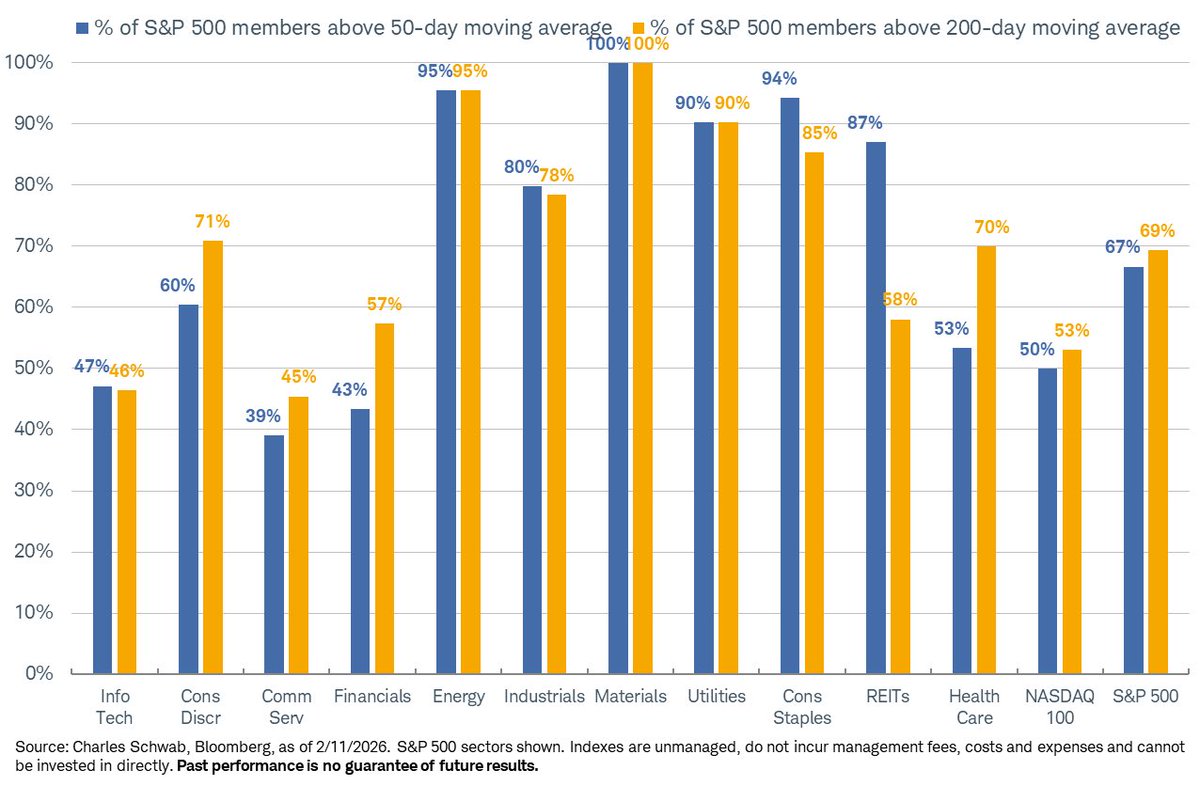
Feb 12
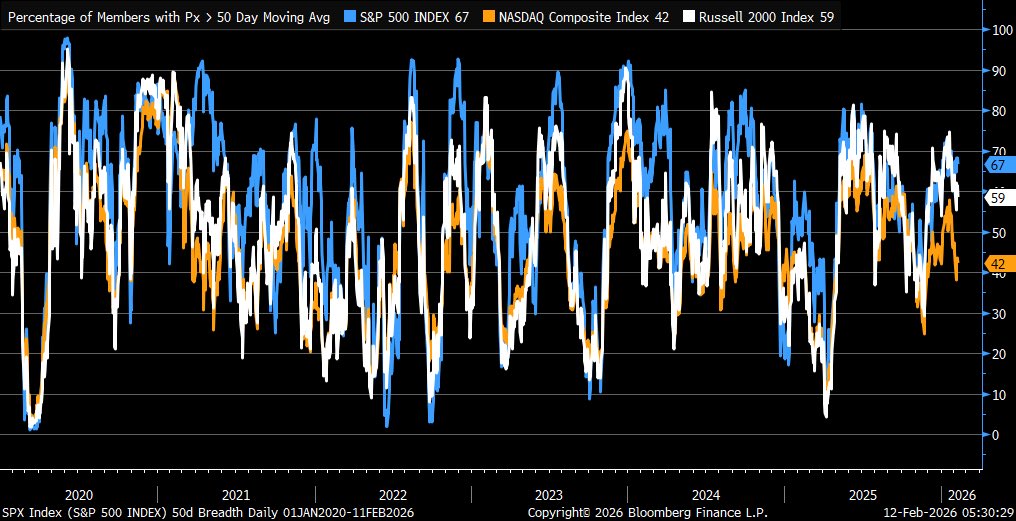
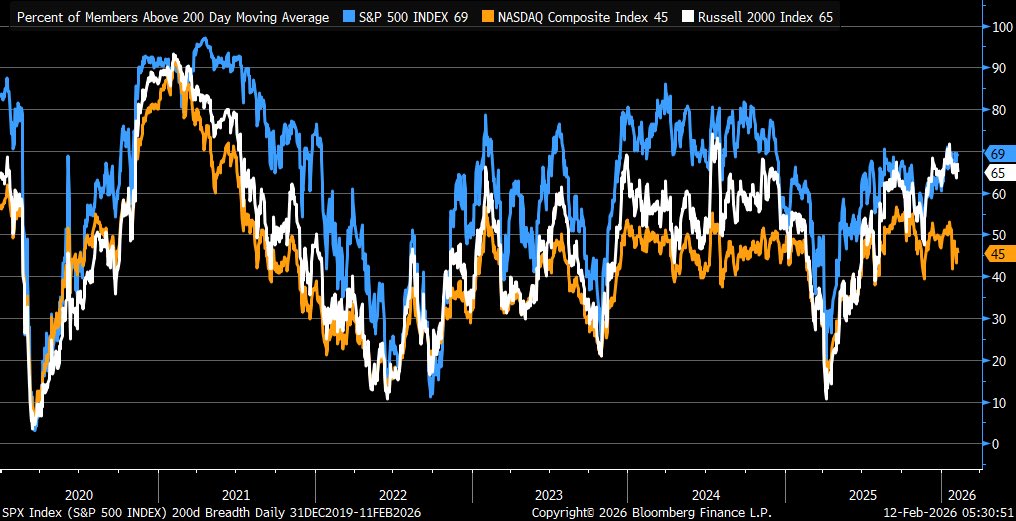
MA breadth charts updated thru yesterday’s close
1
8
24
7,872
Feb 1
Grok Prompt for practicing your Spanish (or any language).
Just replace ‘hacer’ with the verb you want to practice in the grok app on voice mode, and it will list all the tenses, numbers, aspect and person(s), and grok will use the correct dialect while drilling.
Try it!
You’re my drill-sergeant Spanish tutor for the verb “hacer”.
Everything you say in English stays English; every Spanish word you utter sounds native—roll those r’s, soft ch, full vowels. No English slang, no shortcuts.
First, spit out this exact list:
• Past perfect, first: había hecho
• Past perfect, third: había hecho
• Past simple, first: hice
• Past simple, third: hizo
• Present simple, first: hago
• Present simple, third: hace
• Present perfect, first: he hecho
• Present perfect, third: ha hecho
• Future simple, first: haré
• Future simple, third: hará
• Future perfect, first: habré hecho
• Future perfect, third: habrá hecho
Then we do endless sentences. For each:
1. Read the English aloud.
2. Tell me the tense person (e.g. “past simple, first”).
3. I try Spanish.
4. If I flop, correct me in English, give the native Spanish, make me repeat it.
5. When I nail it, jump to the next.
Keep it rolling—no breaks—until I say “stop” or change verb. Use only “hacer” unless I say otherwise. Go
1
55
Jan 28
$ORCL Swing Setup 1.28.26
Price just shot from $171.5 to $177 in a 2-minute candle. Target $220 = 25%
Algos buying support level, conviction held.
Fundamentals CEG .82 and 25% upside next 90 days
Weekly and Daily are attached with gaps and fibs shown in the Daily

1
1,325
4 Jun 2025
Ever wonder if leveraged ETFs like $MSTX (2x $MSTR) always give you 2x the gains of the stock they track?
Find out here why they don't:
Breaking down two hidden effects of
Volatility Drag & Path Dependency.
Spoiler: These make & break fortunes & careers🫥
🔥 Volatility Drag & Path Dependency: Why Leveraged ETFs Like SMCX Can Rip You Up!
Leveraged ETFs (like $MSTX, tied to MicroStrategy $MSTR) aim to give you 2x (or 3x) the daily moves of the stock. $MSTR up 1%? MSTX should be up 2%. But over weeks or months, things get tricky. Here’s why:
🔍 Volatility Drag: The Obvious Killer
Leveraged ETFs reset their leverage daily, so they compound returns. When the stock swings a lot (high volatility), losses hurt more than gains help.
Example 1
Day 1: $MSTR at $100 drops 10% to $90. MSTX drops 2x = 20%, from $100 to $80.
Day 2: $MSTR bounces 10% to $99 (10% of $90 = $9). MSTX gains 2x = 20%, but on $80, so it’s $96.
Result: $MSTR is down 1%, but MSTX is down 4%! The daily compounding amplifies losses more than gains when prices swing.
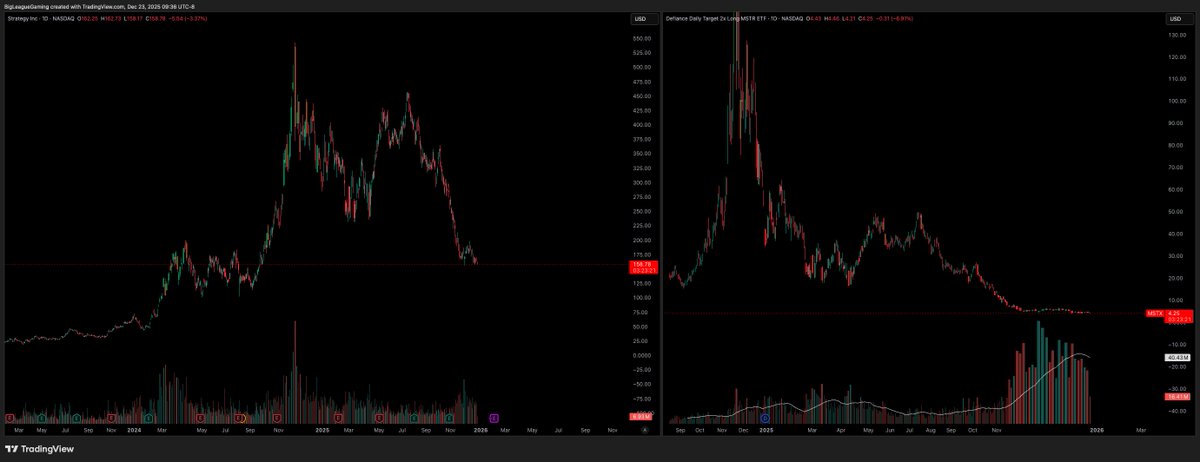
We can see this at play with the differences in price levels, with the same dates and pivots marked out in this comparison.
Big swings (like $MSTR’s $450 → $260 → $396.57 this year) can crush MSTX, even if $MSTR ends up okay. From Jan 21 to May 23, $MSTR dropped 3.8%, but $MSTX tanked 38.99% as seen above.
🔄 Path Dependency: The Journey Matters
Path dependency means that a leveraged ETF’s returns depend not just on the underlying stock’s start and end price but also on the path its price takes. Daily rebalancing to maintain constant leverage (2x for SMCX) causes returns to diverge from simply doubling SMCI’s return over time, especially in choppy markets.
So, in choppy markets Volatility Drag will eat your lunch.
In upward, but choppy markets, our losses can compound more than our gains.
Example 2
Day 1: SMCI drops 10% ($100→$90). SMCX? Down 20% ($100→$80).
Day 2: SMCI climbs 11.11% (back to $100). SMCX rises 22.22% ($80→$97.78).
SMCI: 0% return. SMCX: -2.22%. Ouch—volatility drag at work
So It Can Work in Our Favor? 💰
Yes, If $MSTR trends up steadily (low volatility), $MSTX can outperform 2x. A smooth 10% rise in $MSTR will mean 20.5% for MSTX due to compounding gains.
Leveraged ETFs want a smooth ride up. Otherwise, be very, very careful.

1
1
1
208
23 Dec 2025
TLDR; Volatility Drag Illustrated In One Picture
MSTR | MSTX
85
18 Nov 2025
$TSLA Distribution of Returns
-Daily
-Weekly
-Monthly
-Quarterly
For a breakdown on what these are and how to trade them, see the prior post here:
x.com/BigLeagueGaming/status…
4 Oct 2025

🧵 Let's dive into the distribution of returns for a stock—specifically Close-to-Close (C2C), Open-to-Close (O2C), and High-to-Low (H2L), what these are and what they tell us
These metrics help us understand price movements, volatility, and risk, e.g the characteristics of how a stock trades
These distributions are then analyzed to produce further insights we call descriptive statistics.
I'll use simple simulated data for a made-up stock (like a random walk with a slight upward trend and wiggles) to show examples. Real stocks differ, but this teaches the basics.
1
140