
SpecializedCharts is building the next-gen charting stack for crypto professionals. Real-time. Custom. Insightful.
Joined July 2025
- Tweets 13
- Following 71
- Followers 26
- Likes 4
5 Photos and videos


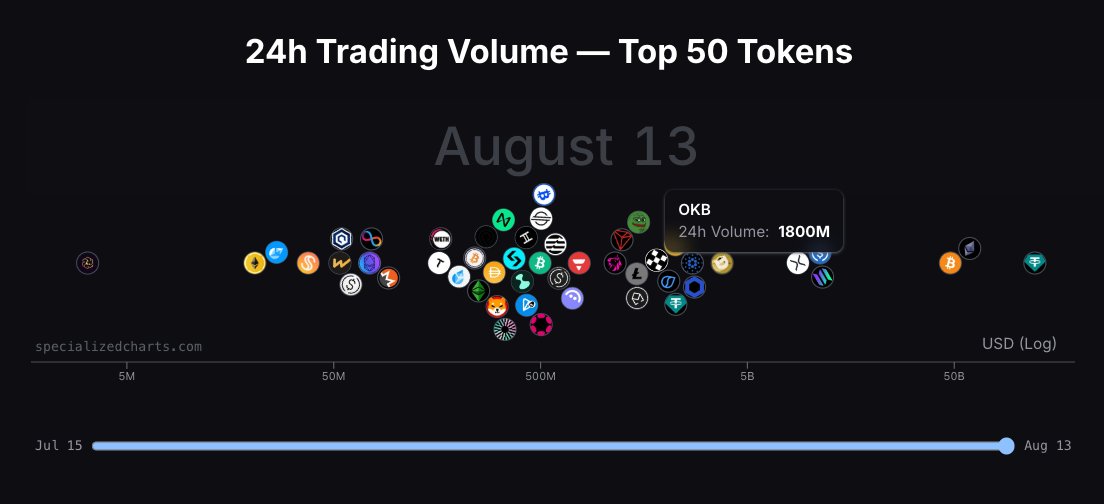


13 Aug 2025
This lollipop chart compares current 24h trading volume vs the same metric 30 days ago (log scale).
Green = growth, Red = decline, labels show the × change.
Lets you spot where trading activity and attention has shifted in the market.
36
13 Aug 2025
📊 Been animating a 30-day view of the Top 50 tokens by 24h volume.
OKB had the biggest move — up 21× from $80M to $1.8B. BTC & ETH showing strong upward momentum too.
1
95
13 Aug 2025
🚀 Top 50 Tokens by 24h Trading Volume (30-day animation)
OKB jumped 21× from $80M to $1.8B, climbing to #13 by daily volume.
BTC & ETH are trending up again 📈
📊 See the interactive chart:
specializedcharts.com/24h-vo…
#crypto #trading #dataviz #charts #cryptocurrency
1
59
19 Jul 2025
💥 The entire crypto market is shifting.
Watch 24h volume surge across the top 50 tokens. Not in a table, but in motion.
Here’s an animation showing how the top 50 tokens moved over 7 days, based on their 24h trading volume.
Each token drifts right as trading heats up.
Each position is scaled by log(volume).
2
1
5
124
16 Jul 2025
Liquidity. Pressure. Movement.
Here’s what a market really looks like time-compressed. Built with custom tooling. More soon.
#Crypto #DepthChart #TradingTools
1
2
3
123
16 Jul 2025
This is a live depth chart with ~10 min of history.
You’re seeing:
• Real-time CVD (Cumulative Volume Delta)
• Buy/sell volume imbalance
• Evolving liquidity depth
40