
Dan Price | Broker, Team Price Real Estate (Austin) 21 years in real estate. Data-driven analyst focused on market cycles, pricing logic, and housing economics
Joined January 2009
- Tweets 7,738
- Following 207
- Followers 561
- Likes 275
1,020 Photos and videos


Austin residential market activity through June 17: new listings are down 3.2% YoY, while pending contracts are up 4.7% YoY. The pending-to-new ratio has improved from 0.79 to 0.85, an 8.2% increase year over year. Despite nearly 1,000 fewer new listings, buyer demand has generated 1,147 more pending contracts than at this point last year. The data continues to show stronger absorption in 2026, with buyers capturing a larger share of available inventory and keeping overall market conditions firmer than they were in June 2025.
12
Austin residential market activity through June 15: new listings are down 3.5% YoY, pending contracts are up 4.7% YoY, and the pending-to-new ratio has improved to 0.85. Buyer demand continues to strengthen relative to supply, with more than 1,100 additional pending contracts despite fewer homes coming to market. The result is a stronger absorption trend and a healthier supply-demand balance than we saw at this point in 2025, indicating buyers are capturing a larger share of available inventory.
1
73
Austin residential market activity through June 14: new listings are down 3.9% YoY, pending contracts are up 4.1% YoY, and the pending-to-new ratio has improved to 0.85. Buyer demand continues to outpace the flow of new inventory compared to last year, with nearly 1,000 more pending contracts despite fewer homes coming to market. This sustained improvement in absorption suggests the Austin housing market remains healthier and more competitive than it was at this point in 2025.
1
117
Austin housing weekly update, June 11: the median sold price held at exactly $430,000 for a full year (0.0% YoY). Supply is balanced at 5.93 months. Price per sq ft is still down ~20% from the 2022 peak, so buyers get more home per dollar. Full report: dan.teamprice.com/market-upd…
75
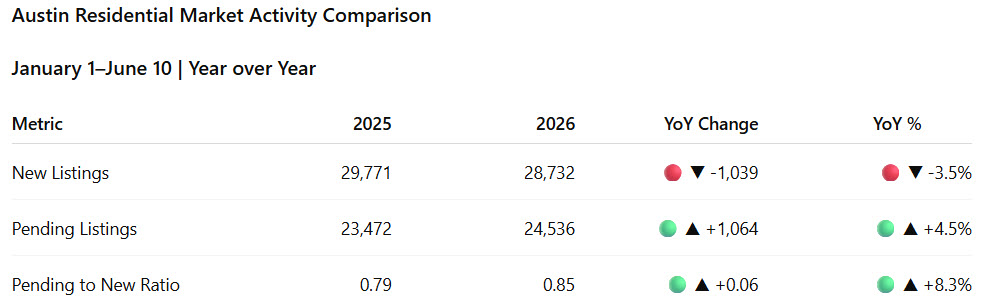
Austin residential market activity through June 10: new listings are down 3.5% YoY, pending contracts are up 4.5% YoY, and the pending-to-new ratio has improved to 0.85. Buyer demand continues to outpace the flow of new inventory compared to last year, with more than 1,000 additional pending contracts despite fewer homes coming to market. This stronger absorption trend suggests the Austin housing market remains more competitive than it was at this time in 2025.
1
48
Buyer or seller market in Austin right now? Balanced, leaning buyer. 52% of active listings have cut price, yet closed deals still land at 97.7% of list. The trick: negotiate hard early. June 2026 breakdown here:
teamprice.com/austin-daily-r…
#AustinRealEstate #ATX
1
140
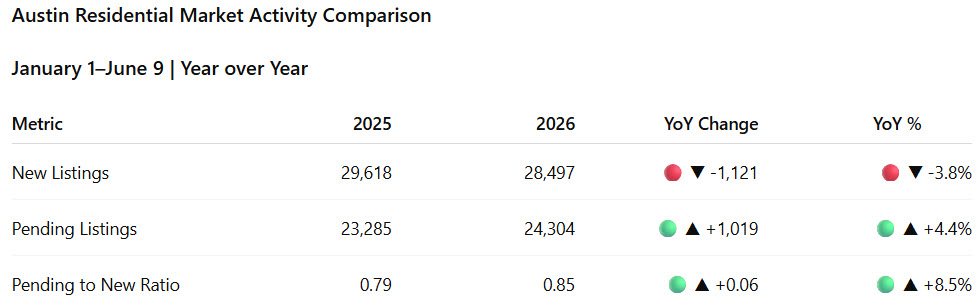
Austin residential market activity through June 9: new listings are down 3.8% YoY, pending contracts are up 4.4% YoY, and the pending-to-new ratio has improved to 0.85. Buyer demand continues to absorb inventory at a stronger pace than last year, with more than 1,000 additional pending contracts despite fewer new listings entering the market. This sustained improvement in absorption points to a healthier supply-demand balance and stronger underlying market activity than we saw at this point in 2025.
45
Austin residential market activity through June 8: new listings are down 3.8% YoY, pending contracts are up 4.6% YoY, and the pending-to-new ratio has improved to 0.85. Buyer demand continues to outpace the flow of new inventory compared to last year, with pending activity increasing by more than 1,000 transactions year over year. The result is a stronger absorption trend and a healthier supply-demand balance than we saw at this point in 2025.
44
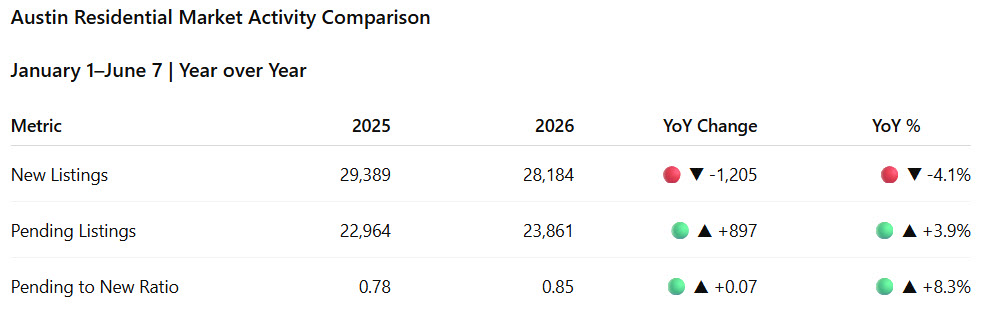
Austin residential market activity through June 7: new listings are down 4.1% YoY, pending contracts are up 3.9% YoY, and the pending-to-new ratio has improved to 0.85. Buyer demand continues to absorb inventory at a stronger pace than last year, with pending activity growing despite fewer new listings entering the market. This sustained improvement in absorption suggests a healthier supply-demand balance than we saw at this point in 2025.
53
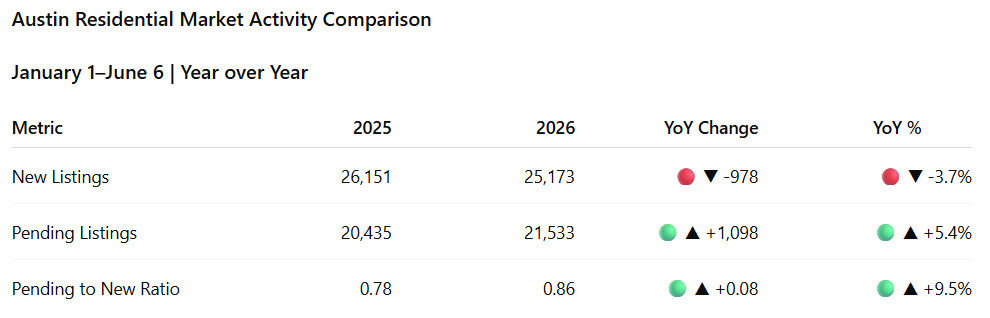
Austin residential market activity through June 6: new listings are down 3.7% YoY, pending contracts are up 5.4% YoY, and the pending-to-new ratio has improved to 0.86. Buyer demand continues to outpace the flow of new inventory compared to last year, with pending activity posting one of its strongest year-over-year gains of 2026. The result is a meaningfully stronger absorption trend and a healthier supply-demand balance than we saw at this point in 2025.
1
50
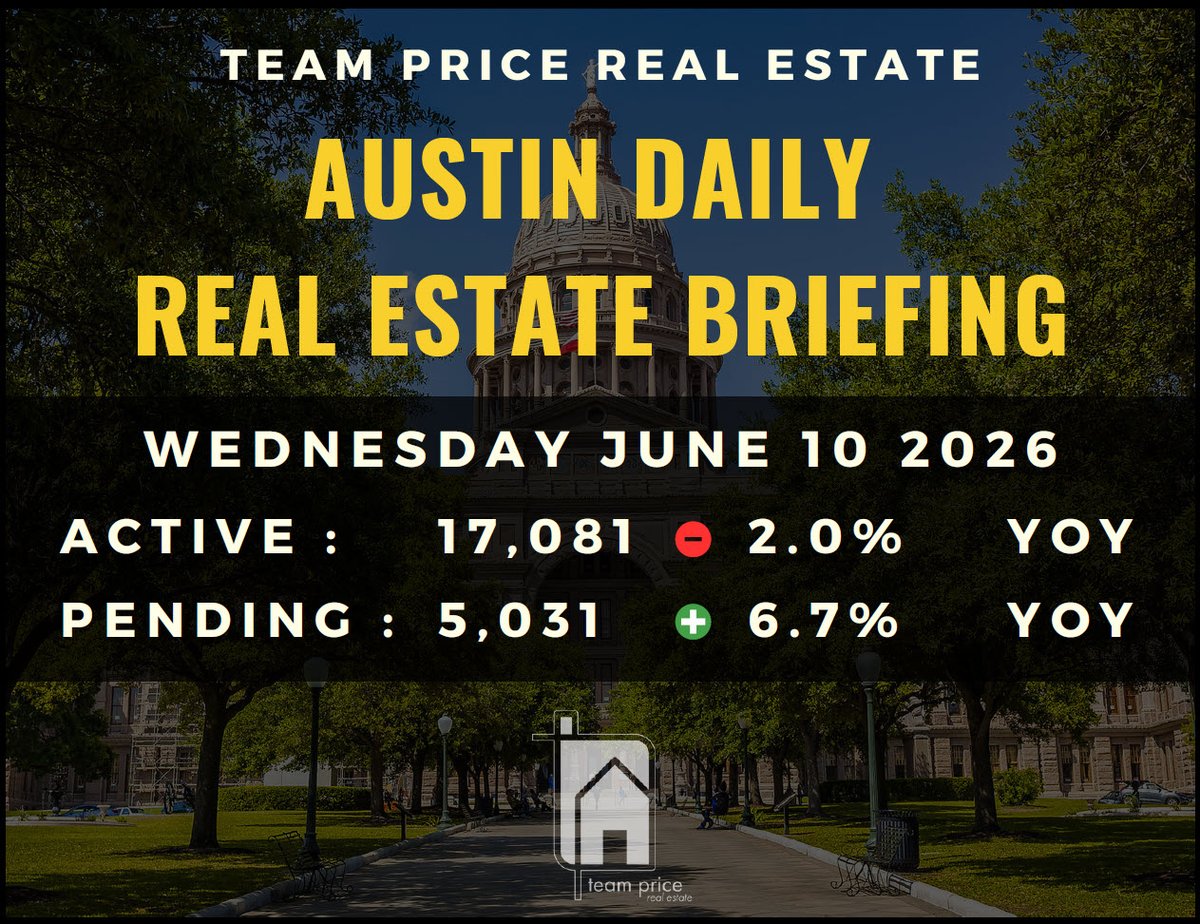
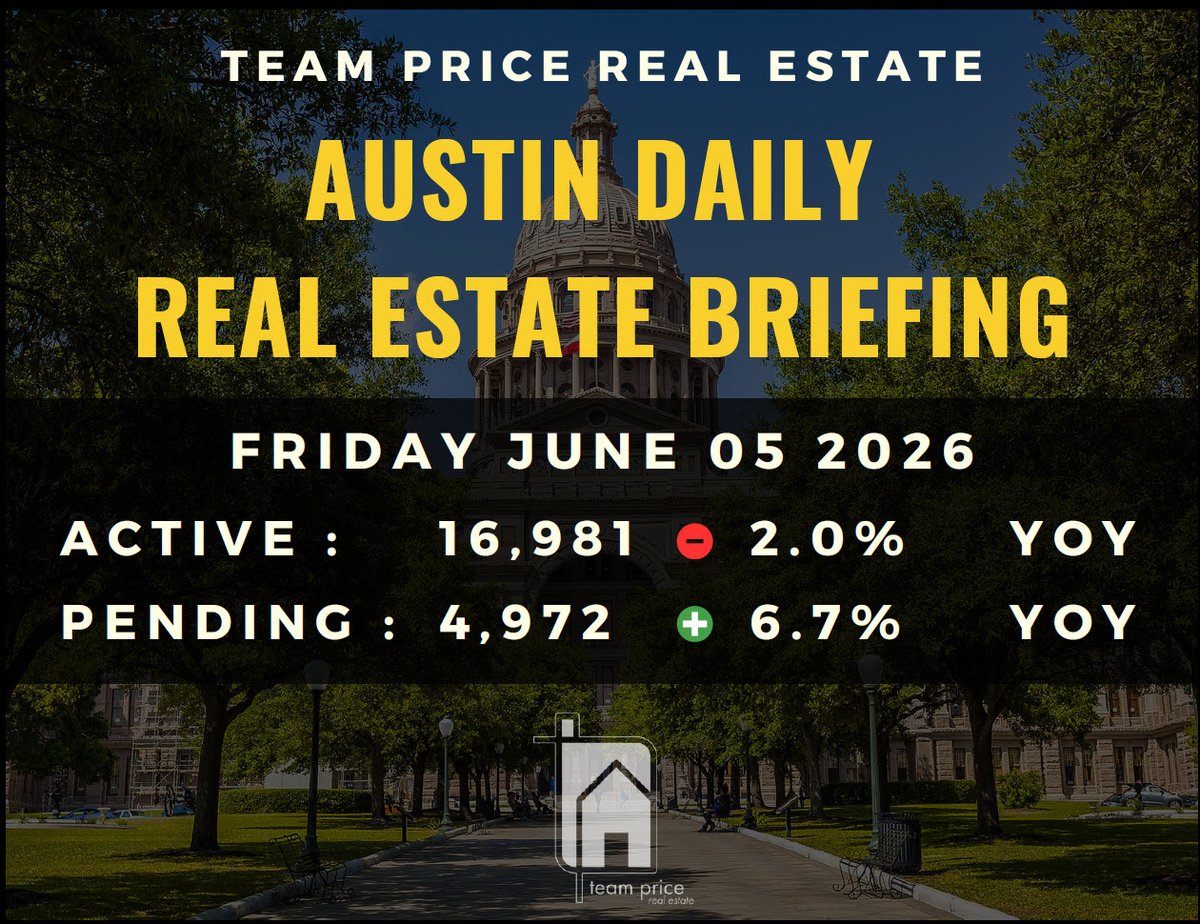
Austin housing, week in review (June 5):
Pending sales: 4,972, up 6.7% YoY
Active listings: 16,981, down 2.0% YoY
Activity Index: 22.6%, up from 21.2%
Months of Inventory: 5.89, down from 6.15
Supply is pulling back while demand firms.
2026 Austin Market is in recovery.
teamprice.com/austin-daily-r…
#AustinRealEstate #ATX
1
45
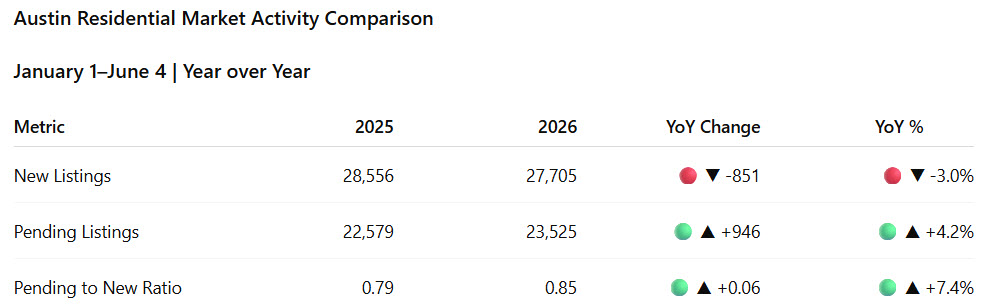
Austin residential market activity through June 4: new listings are down 3.0% YoY, pending contracts are up 4.2% YoY, and the pending-to-new ratio has improved to 0.85. Buyer demand continues to outpace the flow of new inventory compared to last year, with pending sales growing faster than supply. The result is a stronger absorption trend and a healthier supply-demand balance than we saw at this point in 2025.
1
45
Austin Weekly Housing Update June 04 2026. More buyers are paying over asking even as prices sit flat. 15.66% of homes sold above list this month, up from 14.39% last month and 12.11% a year ago. Full report: teamprice.com/market-update/…

33
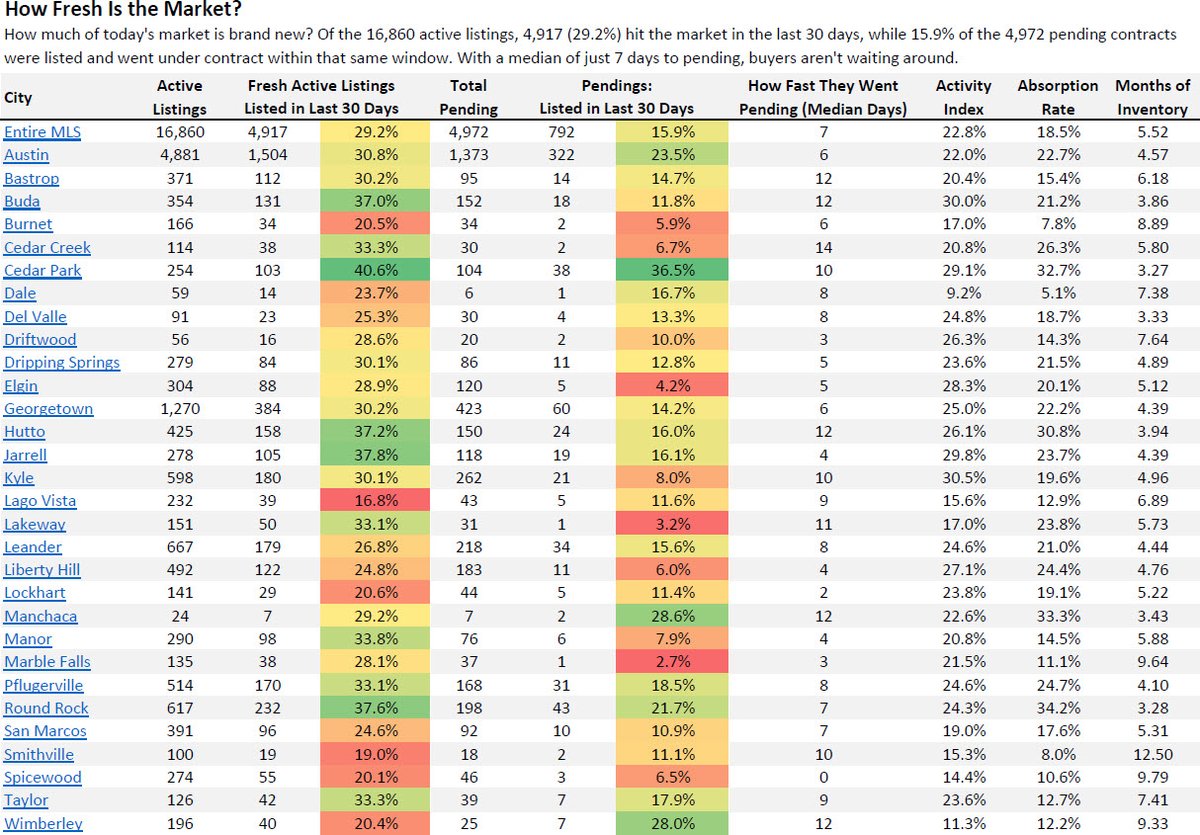
How long does it take to sell a home in Austin right now?
Speed depends heavily on price and location, and the honest answer is that it varies widely from home to home. You may see a figure showing a median of just 7 days to pending, but that number only applies to the fast moving slice of homes that were listed and went under contract within the same 30 day window, which is about 16 percent of current pendings.
It is not a market wide timeline, and it leaves out every listing that took longer than a month to find a buyer. A more complete read comes from months of inventory at 5.86 and the fact that 51.6 percent of active listings have already taken at least one price cut, both of which tell you a large share of homes are sitting for a while.
The pattern in the Austin market today is that correctly priced homes in strong suburbs like Cedar Park and Round Rock can move fast, while overpriced homes or those in slower areas can take months.
1
63
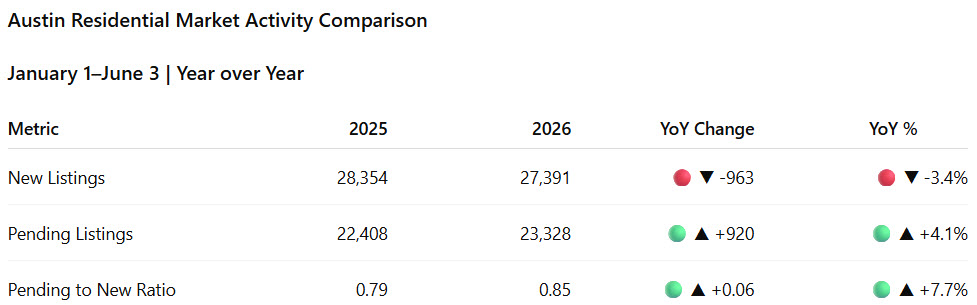
Austin residential market activity through June 3: new listings are down 3.4% YoY, pending contracts are up 4.1% YoY, and the pending-to-new ratio has improved to 0.85. Buyer demand continues to outpace the flow of new inventory compared to last year, with pending activity rising even as new listing volume remains lower. This stronger absorption trend points to a healthier supply-demand balance than we saw at this time in 2025.
54
The Market Flow Score is the one I am watching most. It has now improved year over year for four straight months, February through May. That is a developing story worth following, because efficiency and demand are leading indicators that tend to move before prices do.

1
40
Austin residential market activity through June 2: new listings are down 3.7% YoY, pending contracts are up 4.1% YoY, and the pending-to-new ratio has improved to 0.85. Buyer demand continues to absorb inventory at a stronger pace than last year, with pending activity growing faster than new supply. The result is a healthier absorption trend and stronger market balance compared to this time a year ago.

39
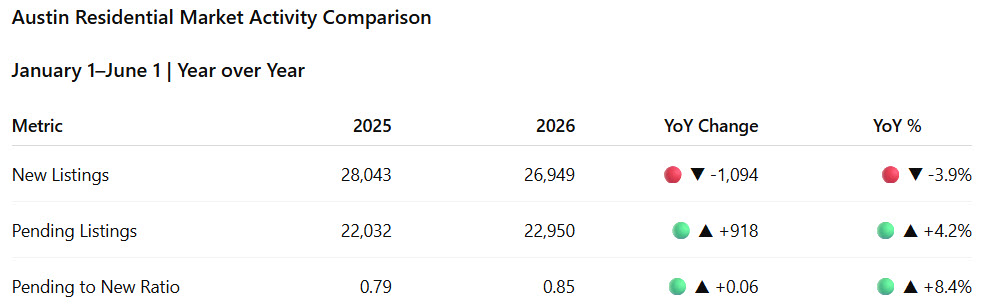
Austin residential market activity through June 1: new listings are down 3.9% YoY, pending contracts are up 4.2% YoY, and the pending-to-new ratio has improved to 0.85. Buyer demand continues to outpace the flow of new inventory compared to last year, with pending activity showing its strongest year-over-year gain in recent weeks. The result is a healthier absorption trend and a more balanced supply-demand relationship than we saw at this time last year.
57
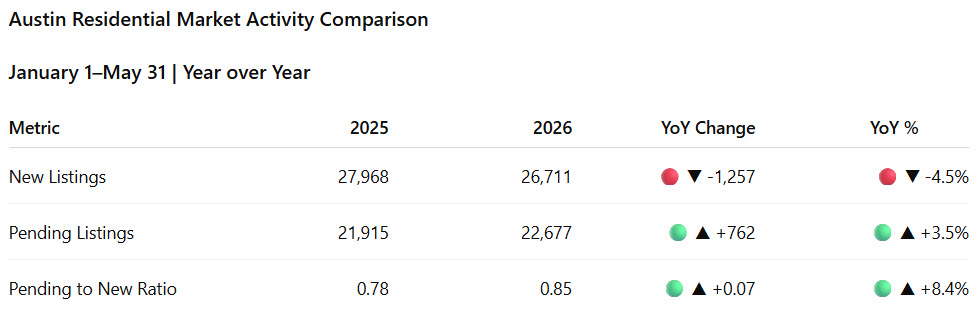
Austin residential market activity through May 31: new listings are down 4.5% YoY, pending contracts are up 3.5% YoY, and the pending-to-new ratio has improved to 0.85. Buyer demand continues to absorb inventory at a stronger pace than last year, with pending activity growing despite fewer new listings entering the market. This stronger absorption trend points to a healthier balance between supply and demand than we saw a year ago.
52
We have 16,991 active listings right now, down 2.2% from a year ago and 1,155 below the June 2025 peak of 18,146. So supply is still high, but it has stopped climbing.
More than half of all active listings, 51.3%, have already cut their price at least once.
And the pace of actual closings remains slow by historical standards, with an absorption rate of just 17.06% against a long run average of 31.35%. Inventory is easing, but it is not tight.
teamprice.com/austin-daily-r…
#austinrealestate #austinrealtor

44