
Joined December 2009
- Tweets 16,747
- Following 499
- Followers 1,781
- Likes 9,358
279 Photos and videos


Francesco Carbone retweeted

"Diamo l'università in mano allo Stato, che potrà mai andare storto?"

Studiare non serve più a un cazzo
1
2
4
346
Perché la voglia di rubare i soldi degli altri è inesauribile

Communism has a 100% failure rate.
If it were a product, it would’ve been recalled decades ago.
Yet people still keep trying to sell it.
Why? 🤔
1
1
10
284
La UE
Jun 8

Tutto era vietato,
tranne il lavoro e il sonno.
Non era permesso muoversi,
parlare o pensare
se non era per servire il Partito.
Nulla era tuo, all’infuori
dei pochi centimetri
cubi dentro il tuo cranio
#GeorgeOrwell, 1984
1
9
326
Francesco Carbone retweeted

Scienza.
Nel 1991 con il crollo dell'URSS è stato dimostrato scientificamente che il socialismo non funziona come teorizzati da Mises nel 1920.
Nonostante questa evidenza scientifica, siamo immersi ancora nel pieno socialismo solo che è mutato, la chiamano socialdemocrazia, non è più autoritario ma democratico, non è più anticapitalista ma di capitalismo di relazione, non ha più la proprietà dei mezzi di produzione ma il completo controllo.
Un socialista purtroppo è per sempre, non si crea, non si distrugge, si trasforma.

2
9
28
697
Il collettivista ovviamente non capisce e mai capirà
Jun 7

Pensare di aiutare i poveri alzando il salario minimo è la classica “buona intenzione” che produce pessimi risultati.
La California nel 2023 ha imposto 20 dollari l’ora nei fast food con almeno 60 sedi. Risultato? Secondo uno studio del NBER di Jeffrey Clemens, Jonathan Meer e Olivia Edwards, l’occupazione nel settore è crollata del 2,64%, mentre nel resto degli USA cresceva. Si stima che siano andati persi 18.000 posti di lavoro solo per questa legge parziale.
La revisione della letteratura di Neumark e Shirley (2022) è chiara: la stragrande maggioranza degli studi mostra effetti negativi sull’occupazione. Perché?
Economia elementare: quando imponi un salario più alto di quello di mercato, aumenti il numero di chi vuole lavorare ma riduci il numero di chi le imprese possono permettersi. Chi produce meno di 20 dollari l’ora semplicemente non viene più assunto. Risultato: disoccupazione, automazione (casse automatiche) e meno ore lavorate.I politici continuano a spingere queste leggi perché suonano compassionevoli. “Aiutiamo i poveri!”.
Ma la realtà è brutale: danneggiano proprio le persone che dicono di voler aiutare. Come ricordava Ludwig von Mises, l’economista è sempre il portatore di cattive notizie per i potenti e i demagoghi.
Il salario minimo non è compassione. È proibizionismo sul prezzo del lavoro. E come ogni proibizione, crea più danni di quelli che pretende di risolvere.
1
1
14
561
Francesco Carbone retweeted
Comunque la madre di tutte le battaglie è quella contro l'ignoranza economica (economia = Azione umana. Non econometria quella che si studia all'università), non si va da nessuna parte se si continua a leggere in giro che la colpa è del liberismo o del troppo liberismo o del neoliberalismo o del turboliberalismo. L'ignoranza economica è la distinzione del socialista e dello statalista.
2
4
18
550
Francesco Carbone retweeted
"Se vuoi rubare senza essere arrestato fatti assumere dallo stato."
Giovanni Birindelli
Aggiungo: anche se vuoi torturare, ricattare, uccidere, compiere stragi e genocidi.
8
16
250
Francesco Carbone retweeted

Jun 6
The best time to acquire bitcoin is when normies are convinced that it's 'dead', crypto bros are crying all over the timeline, and nocoiners are gloating, dunking on it, and talking about how it will never hit another all time high.
Do with this what you will.
198
170
2,547
78,070
Francesco Carbone retweeted
"Il governo è bravo in una cosa. Sa come spezzarti le gambe, e poi passarti una stampella e dire: 'Vedi se non fosse per il governo, non saresti in grado di camminare'." - Harry Browne
1
2
21
328
Francesco Carbone retweeted
I vari Marattin e altri cialtroni politici parassiti si chiedono come mai l'itaGLia non cresce,6 non è competitiva, bisogna aumentare gli stipendi...
La realtà che non vogliono vedere è che per un dipendente che incassa netti: € 26.000 all'anno.
L'azienda spende in totale: circa € 54.300 all'anno.
Fare impresa in itaGLia è da masochisti, lo sstato ladro criminale è il problema assieme ai burocrati e politici che NON vogliono vedere il problema perché il loro stipendio arriva dall'estorsione fiscale.
1
7
30
515
Francesco Carbone retweeted
"Lo stato è, ed è sempre stato, il grande nemico unico della razza umana, della sua libertà, felicità e progresso." -Murray Rothbard
12
27
436
Francesco Carbone retweeted

🚨 Yesterday I wrote that all four historic market risks – inflation, liquidity, tech, credit – are simultaneously present for the first time in 50 years.
Today let's zoom out further. Way out.
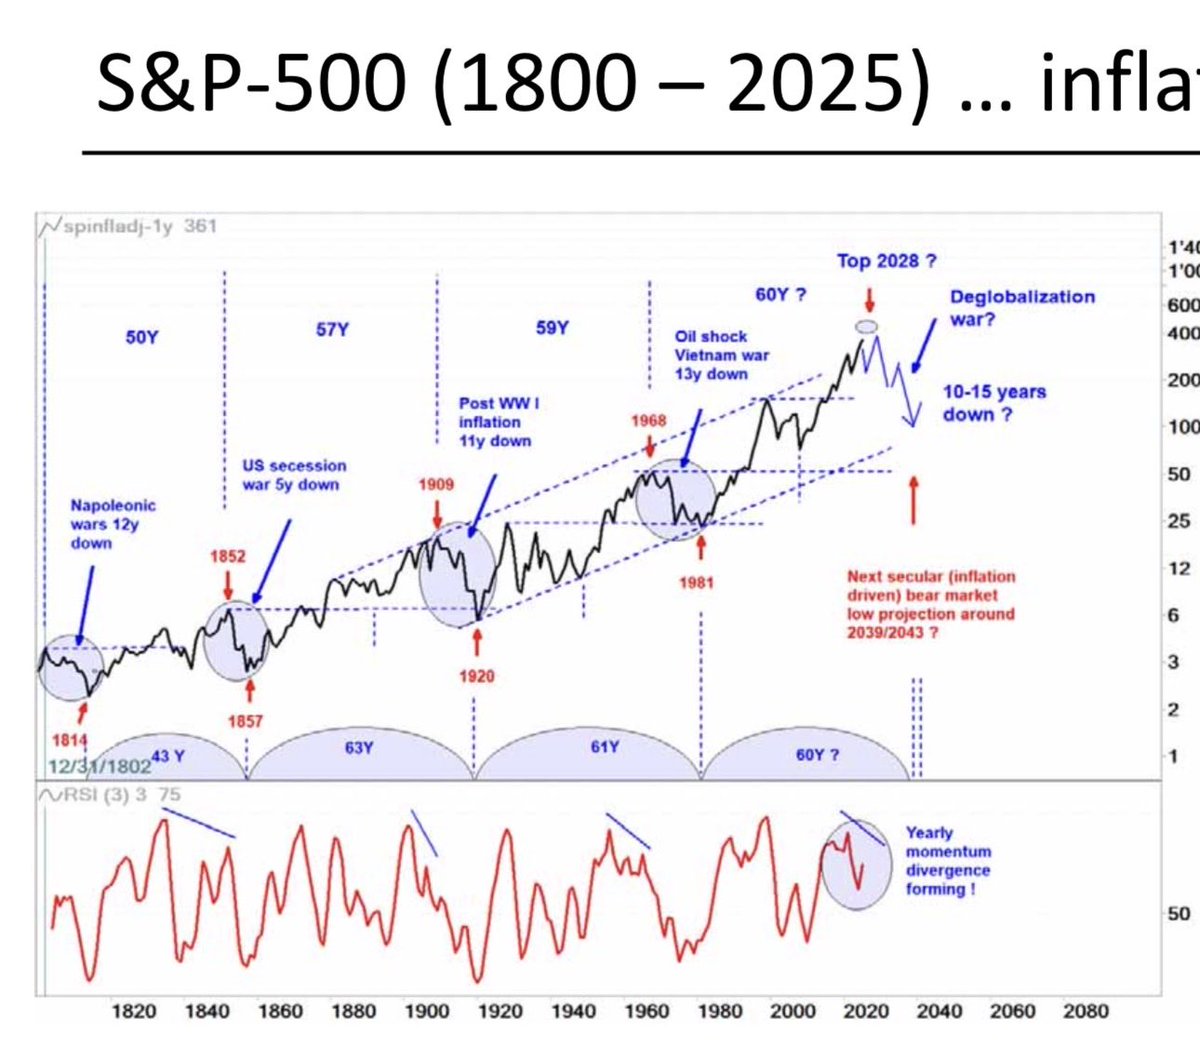
This chart shows 225 years of US stock prices, inflation-adjusted. It reveals something most modern investors have never seen, because the data simply isn't long enough in our living memory.
Roughly every 60 years, the market completes a full secular cycle:
– 1802 → 1857: 50-year rise, ended with US secession war and 5 years down
– 1857 → 1920: 63-year cycle, ended with WWI, post-war inflation and 11 years down
– 1920 → 1981: 61-year cycle, ended with oil shocks, Vietnam, stagflation and 13 years down
– 1981 → ?: the current cycle
If the pattern holds, the next secular top arrives around 2028. Followed by a 10-15 year inflation-driven drawdown that bottoms somewhere between 2039 and 2043.
The recipe is always the same
Each secular ending has three ingredients:
1. Persistent inflation
2. Geopolitical conflict (war, deglobalization, empire transition)
3. A speculative melt-up in the dominant sector of the era
The 1850s had railroads.
The 1910s had electrification and trusts.
The 1970s had the Nifty Fifty.
The 2020s have AI.
We're already two of three in 2026. Inflation has returned. Deglobalization is accelerating. The AI melt-up is the missing piece, and it's underway.
Why this matters
The playbook that worked from 1981 to today was defined by one regime: falling rates, globalization, passive flows, US tech dominance.
That regime ends with every 60-year cycle. Historically, the next decade rewards a completely different set of assets.
What worked in the cycle just ending:
– Long-duration growth
– Passive index investing
– US large-cap concentration
– Tech
What has worked through every secular transition since 1800:
– Cash-flowing businesses with pricing power
– Real assets and infrastructure
– Defensive, durable, boring
– Active stock selection
The uncomfortable part
Every cycle felt unique to the people living through it.
The 1920s investor was certain the new technologies of his age were different from the railroads of 1857.
The 1968 investor was certain stagflation couldn't happen in the modern economy.
They were all wrong in the same way.
If we're somewhere near the top of cycle four, the quality stocks being mocked today aren't dead money.
They're early.

🚨 We may be looking at the rarest market setup in 50 years.
The S&P 500's four historic drawdowns since 1972:
– 1973 Inflation: -43%
– 1987 Liquidity: -30%
– 2000 Tech: -47%
– 2008 Credit: -55%
Each one was driven by ONE dominant risk.
Right now, all four are present at the same time.
1. INFLATION
A commodity supercycle. Energy, metals, agriculture all in multi-year base breakouts. The Fed's preferred inflation gauge has been above 2% for 18 of the last 24 months.
2. LIQUIDITY
The largest equity supply shock since 2000. SpaceX, OpenAI, Anthropic raising ~$275B combined. Google flipping from $60B/year buybacks to $80B net issuance. Over $1 trillion of IPO and lockup supply hitting the Russell 3000 in 2026.
3. TECH
Semiconductors trading 73% above their 200-day moving average – the largest stretch since March 2000. Climax run signals across the AI complex. Micron, Palantir, SMCI, the SOX index, all showing the textbook O'Neil sell pattern.
4. CREDIT
Apollo, KKR, BlackRock, Blue Owl, Cliffwater, Partners Group – all gating redemptions on their evergreen funds in the last 90 days. The private credit machine is freezing in real time.
Never in 50 years have all four risks been simultaneously present.
But here's the part nobody talks about
While the AI Big 10 has gone vertical, quality stocks have been left for dead.
– Berkshire Hathaway: trailing the S&P 500 by hundreds of basis points
– Coca-Cola, Procter & Gamble, Pepsi: trading at multi-year relative lows
– HEICO, Union Pacific, MSCI: making boring new highs while everyone watches Nvidia
– Healthcare vs. S&P 500: 25-year relative low
The last time this happened?
December 1999. Barron's ran a cover titled "What's Wrong, Warren?" – mocking Buffett for being a dinosaur, for missing the internet, for refusing to pay for growth at any price.
Berkshire was down 19% in 1999 while the Nasdaq was up 85%.
What followed:
– Berkshire 29% over the next 24 months
– Nasdaq -78% over the next 30 months
The setup today
Four historic risks stacked simultaneously, while the boring, durable, cash-flowing businesses that always survive these regimes have been treated like dead money for years.
The math doesn't get more asymmetric than this.
Quality stocks aren't out of style.
They're being orphaned.
That's when generational positions are built.
The boring stuff hasn't worked for a long time.
History suggests that's exactly the moment it starts to.

23
76
267
41,542
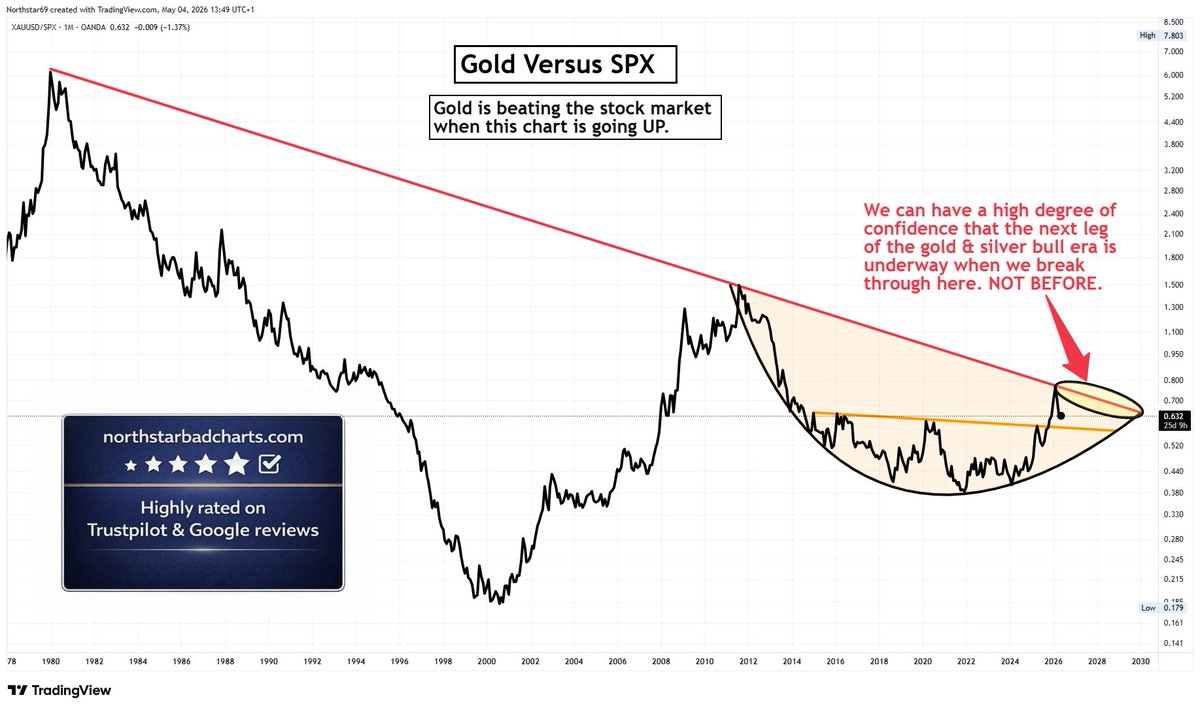
Possiamo dire a distanza di 4 mesi che attaccando l'Iran Trump ha salvato (per ora) il mondo fiat. Incredibile.
5
25
2,787
Francesco Carbone retweeted

La sovranità popolare era una barzelletta fin dall'inizio.
La costituzione è un testo molto interessante e inquietante. Una truffa semantica bene architettata.
La maggior parte degli articoli dedicati ai principi generali è strutturata in modo da dire qualcosa ed il suo contrario. L'art. 1 è un esempio: la sovranità appartiene al popolo, si dice, cioè, che chi decide sono i cittadini ma ... questa fantomatica sovranità può essere esercitata solo nei limiti e nelle forme della costituzione, cioè per quanto è permesso dalla casta politica.
La decantata sovranità si riduce quindi al diritto di andare a disegnare una bella X, come il crocesegno che era la firma degli analfabeti, su un simbolo colorato stampato su un cartoncino, ogni cinque anni, a volte meno.
I simboli colorati rappresentano varie compagnie di attori professionisti che fingono di essere in disaccordo sui temi più vari, sostenuti nella sceneggiata da una folta schiera di giullari di corte che fanno finta di dividersi sui temi della rappresentazione scenica, chiamati giornalisti.
Appena poggiate le terga sulle varie poltrone messe in palio nelle diverse competizioni elettorali, i "rappresentanti del popolo sovrano" si dedicano a riempire le tasche proprie e degli amici e ad eseguire gli ordini dei veri sovrani, quelli che li hanno installati nelle poltrone e che non perdono tempo a partecipare allo spettacolo apprestato per il popolo bue.
Oggi si festeggiano gli ottant'anni dall'inizio di questa buffonata. I sovrani possono rendere omaggio ai pagliacci che credono di aver scelto democraticamente.
I padroni se la ridono di aver trovato un popolo di fessi.

Repubblica Democratica. Fondata sul Lavoro. Sovranità appartiene al Popolo.
Che fine ha fatto tutto ciò?

46
233
524
10,931
Francesco Carbone retweeted

If your boss cut your pay 7% every year, you’d quit on the spot. But when the central bank cuts your savings 7% every year, you call it normal and thank the bank for holding your money. Same robbery. Better marketing.
33
199
1,020
15,876

May 31
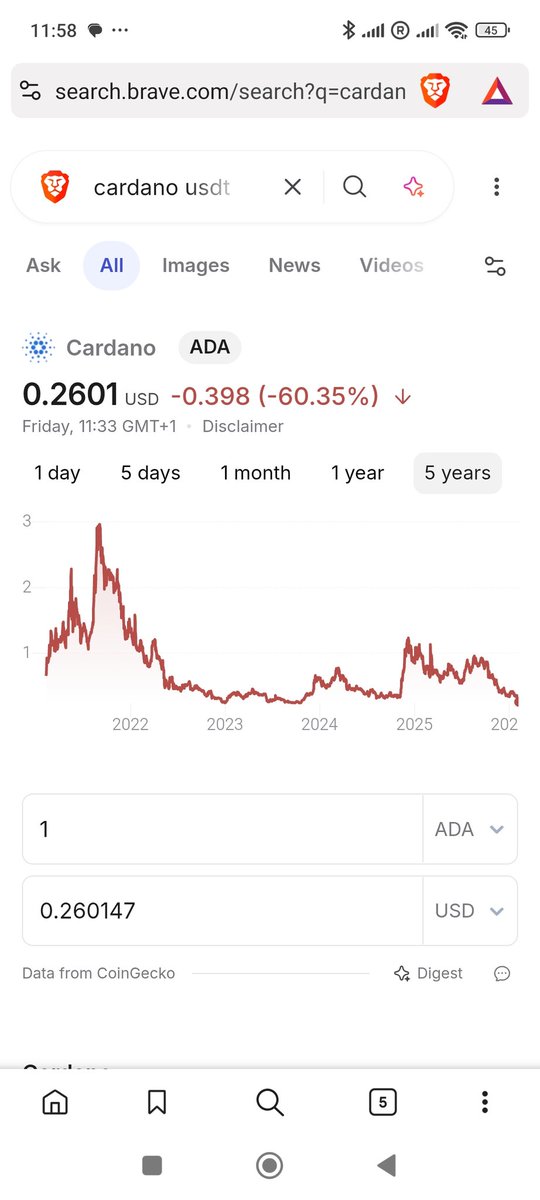
E i deficienti fiat ancora a sognare la lita
1
183


Francesco Carbone retweeted

May 29
They don't want you to own (or use) Bitcoin.
They want you to buy stocks, ETFs, etc. - ANYTHING but Bitcoin!
Don't you see that???
Wake The F Up!!!
21
70
309
22,766
Francesco Carbone retweeted

May 30
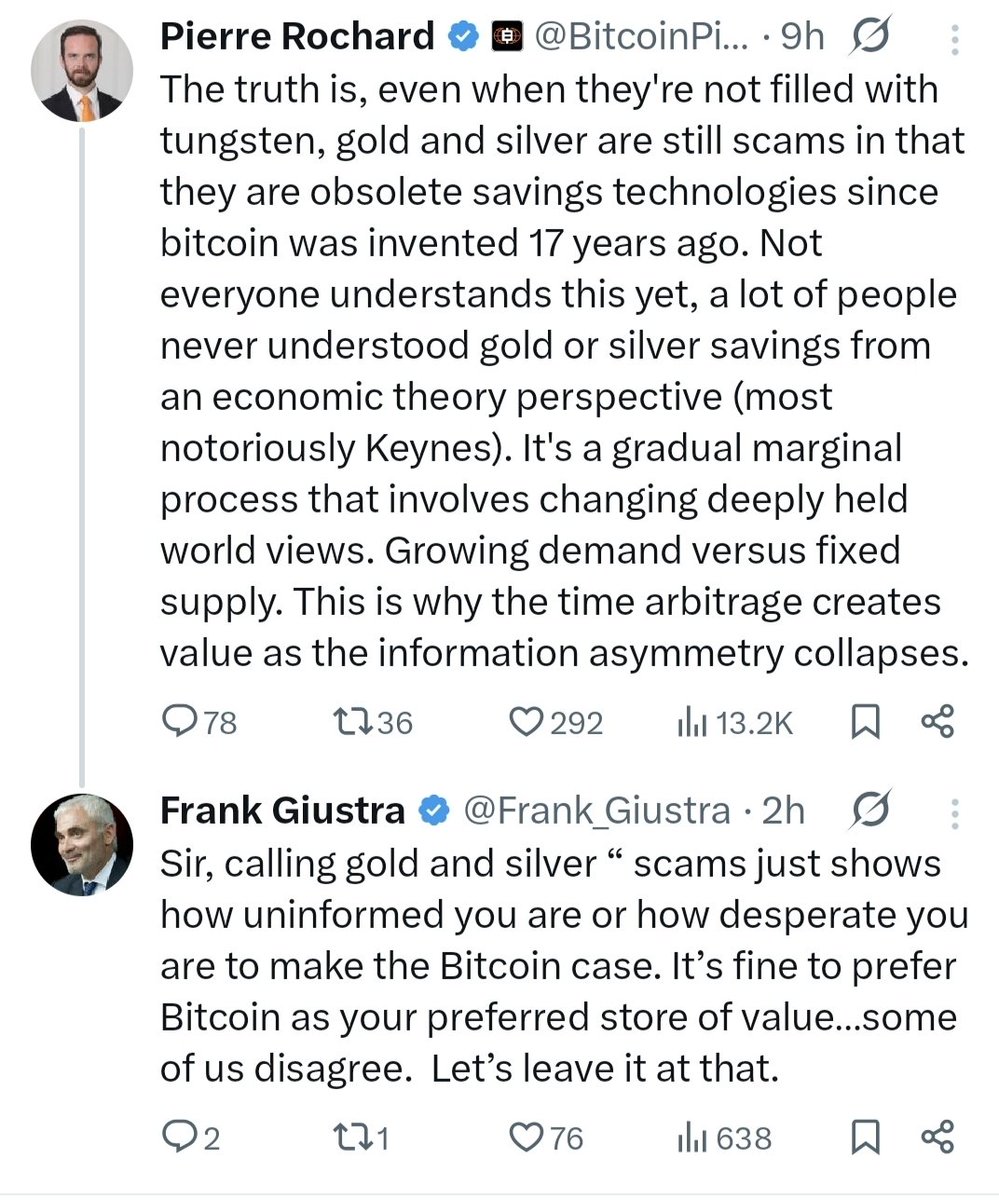
“All prices relative to Bitcoin are actually going down and will forever.” - Jeff Booth

16
17
86
2,873
Francesco Carbone retweeted
They didn’t rob you with a gun. They robbed you with a printer. And called it monetary policy.
6
48
265
4,739