


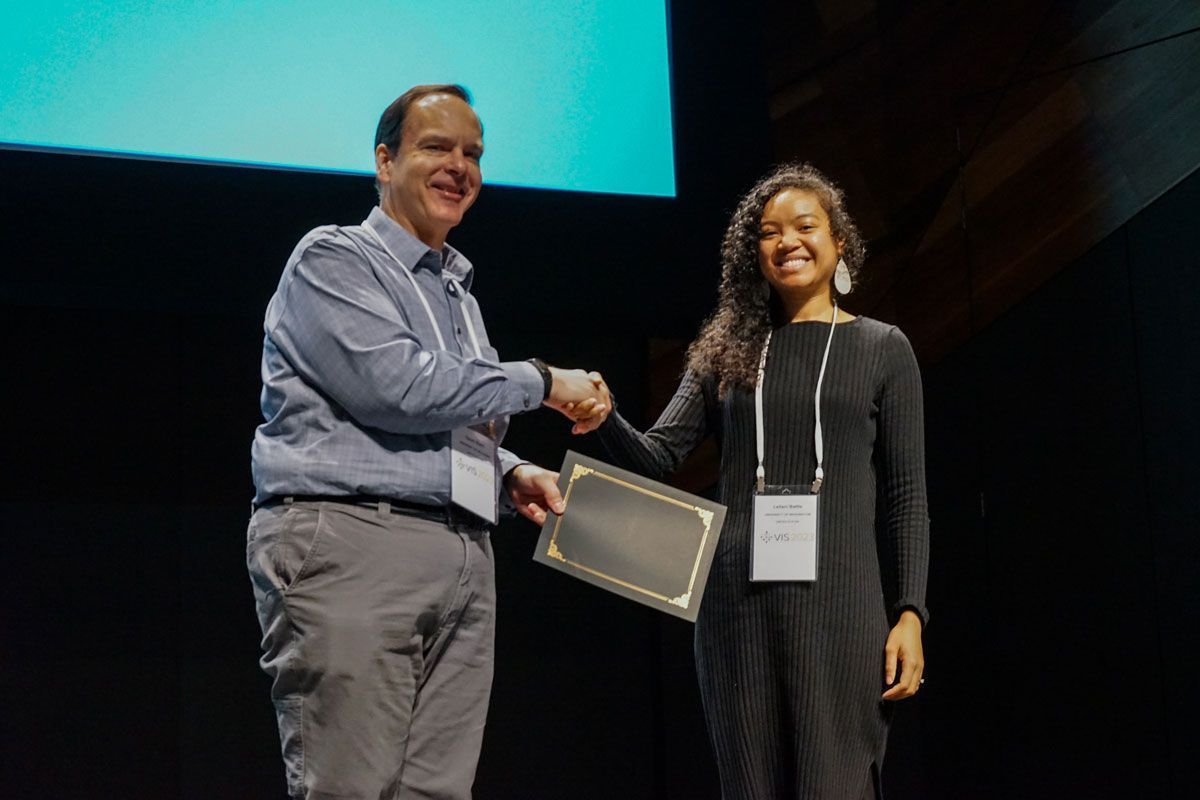


ALT A screenshot of the homepage of mit.edu that features a two column layout: a sidebar on the left hand side (with a search box and links to top resources), and then the main feature on the right hand side. This feature includes an image of a bar chart (where each bar is labeled with one letter from the word "caption"). Underneath the image is text that reads "Researchers have developed a dataset for teaching an AI to write better chart captions, improving accessibility for blind and low-vision individuals. A model trained with this dataset could translate “‘chart language’ to English,” Angie Boggust explains."


ALT A montage of various different bar, line, and area charts across a mix of visual styles to illustrate the diversity of the VisText dataset.

ALT Charts of visualization rendering performance, comparing different tools (Vega, VegaFusion, Observable Plot, and Mosaic) and chart types (average bars, linear regression, 2d histograms, area charts, density contours, and hexbins). Mosaic provides superior performance, often by one or more orders of magnitude.