
out of twitter
Joined June 2022
- Tweets 48
- Following 246
- Followers 103
- Likes 187
35 Photos and videos


Flore retweeted

25 Jul 2024
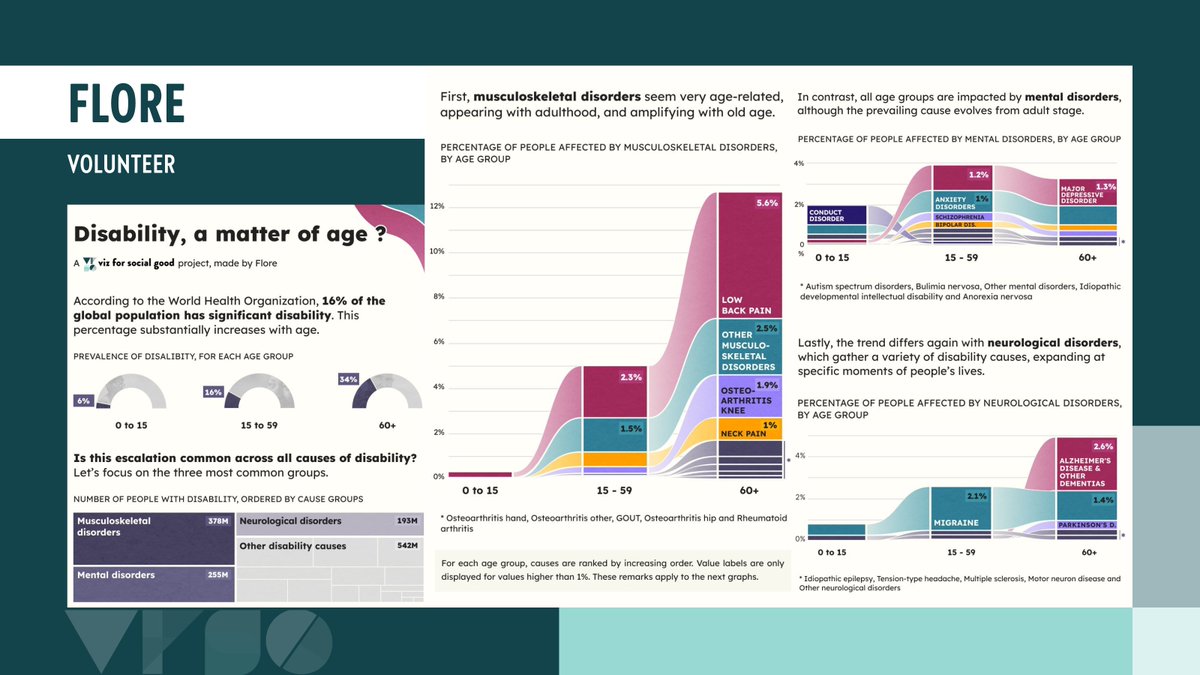
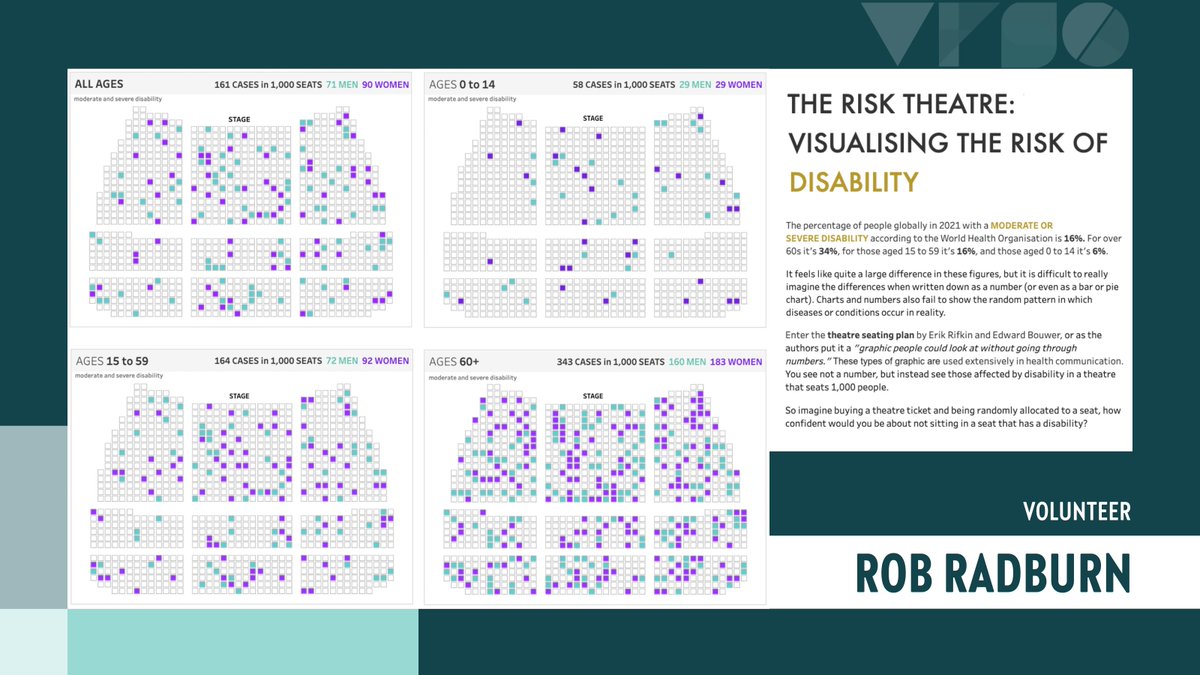
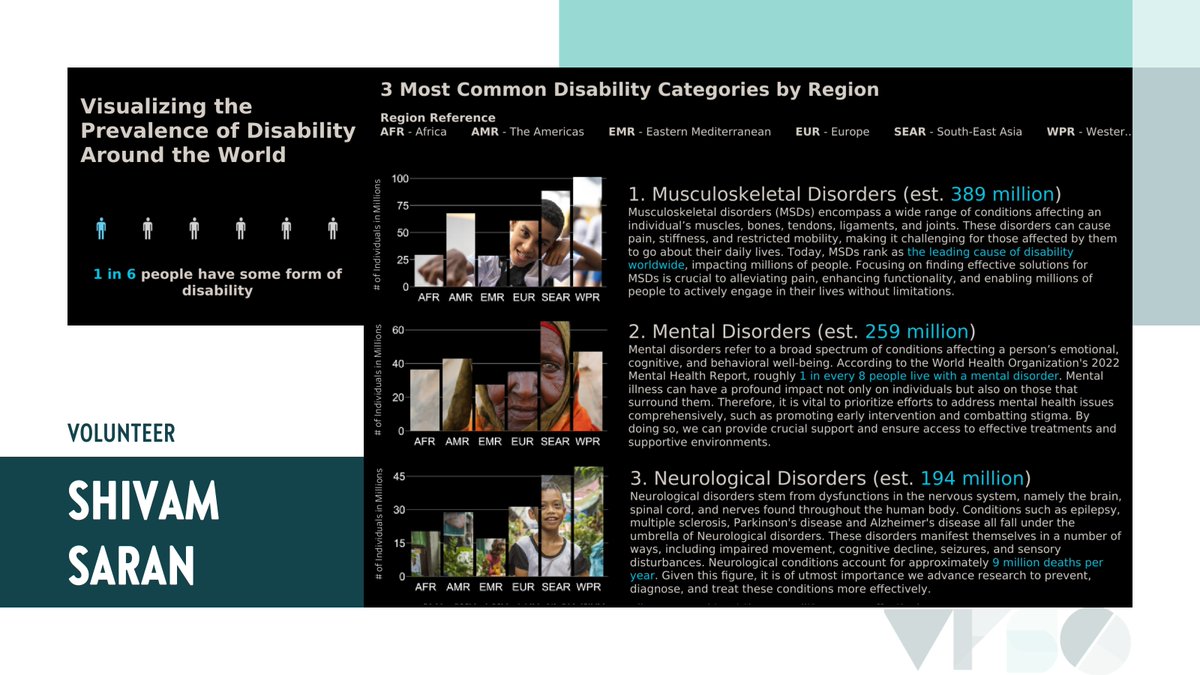
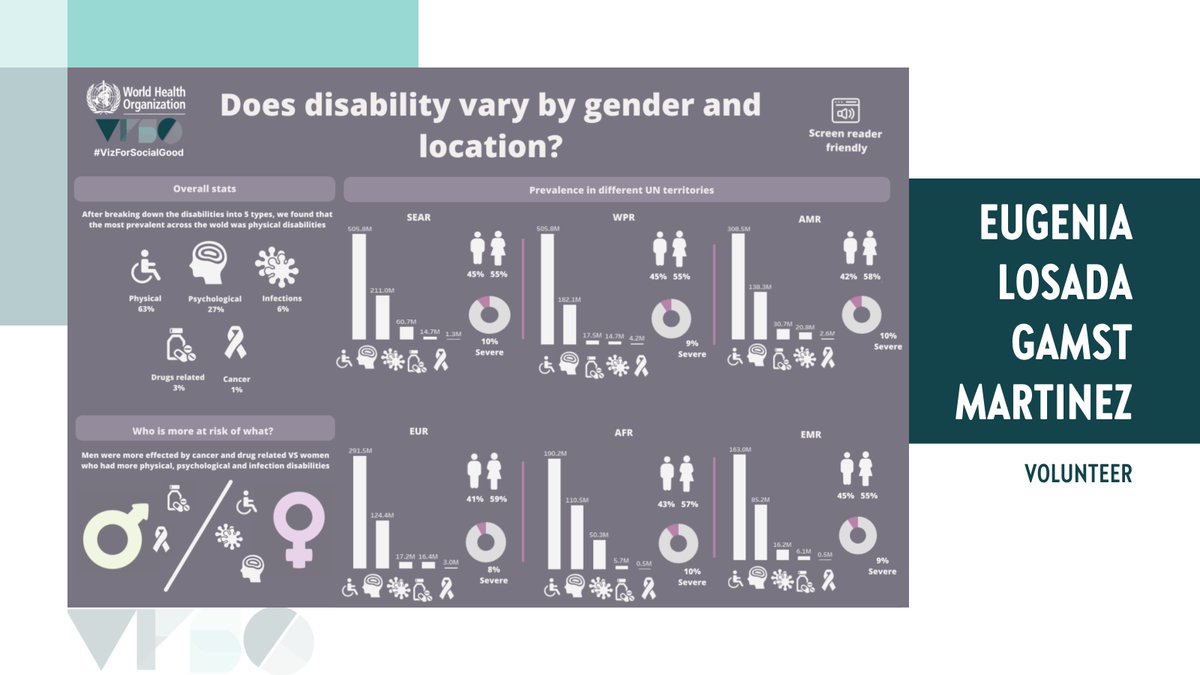
July is #DisabilityPrideMonth! 💜 Check out these #DataViz from our project with @WHO, which illustrate how people with #Disabilities make up diverse communities worldwide and contribute to the vibrance of our societies.
#VizForSocialGood #VFSG #Disability #DisabilityPride
1
5
17
734

21 Jul 2024
That's it, the #TdF2024 edition came to an end today! Replay the race for the Yellow Jersey and #Pogacar's win in this interactive data visualisation
wildvariables.github.io/tour…
1
1
10
381
21 Jul 2024
I've been working on a new interactive data visualisation for the past week. Hopefully, I'll be able to release it tomorrow 👀 #TDF2024
2
153
29 Apr 2024
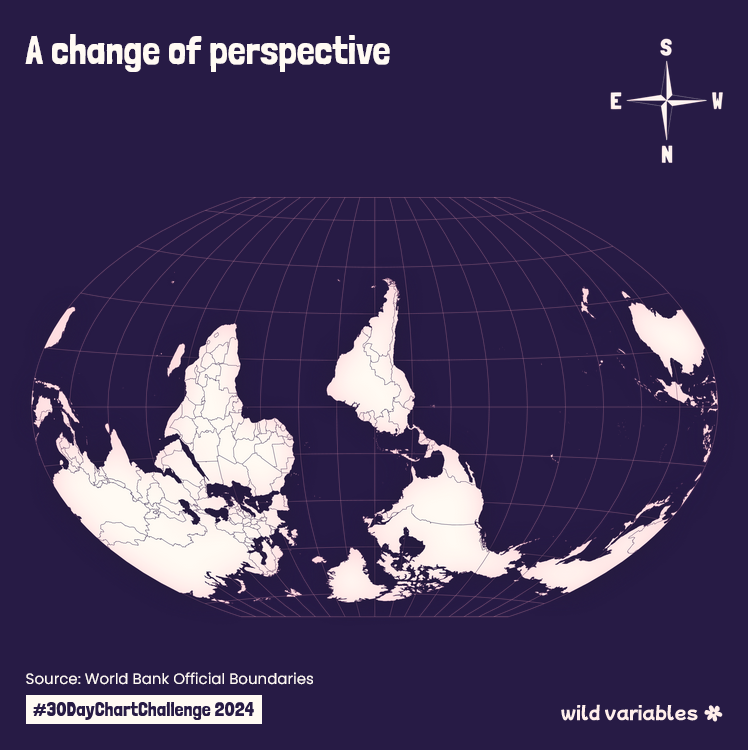
#30DayChartChallenge | Day 25 - Global Change
For this prompt, I'm asking you to make a global change... of perspective and projection. Several works (mentioned below) inspired this very simple map, challenging the usual world map projections🌎
Made with Flourish and Figma
1
13
465
29 Apr 2024
✨ Finally, in a great Youtube video (in Portuguese), @manualdomundo explains the relevance AND the limits of these types of unusual projections youtu.be/aruMivO0uFY?si=2XnW…
1
75
29 Apr 2024
I hope these resources helped you raise some reflections about how we usually represent our world! Do you have other ideas of projection to test out?
52
28 Apr 2024
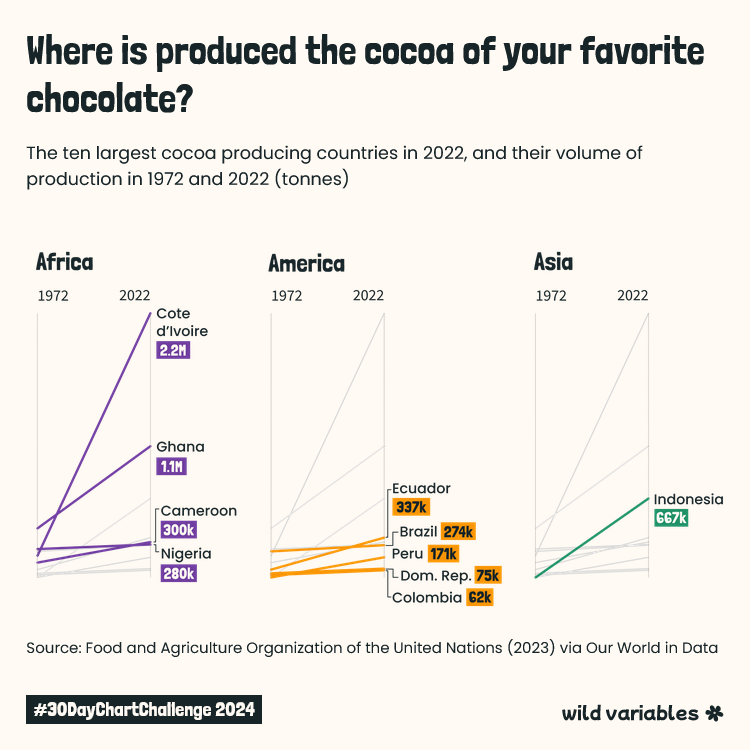
#30DayChartChallenge | Day 24 - ILO Region for Africa
I ran out of time and didn't manage to find a dataset from ILO. Instead I tried to highlight one of the things some countries of Africa and South America (including Brazil) have in common 🍫
Made with Flourish & Figma
1
15
768
27 Apr 2024
#30DayChartChallenge | Day 23 - Tiles
Second viz of the day, turning tiles into turtles 🐢
Made with Figma
3
1
43
1,901
27 Apr 2024
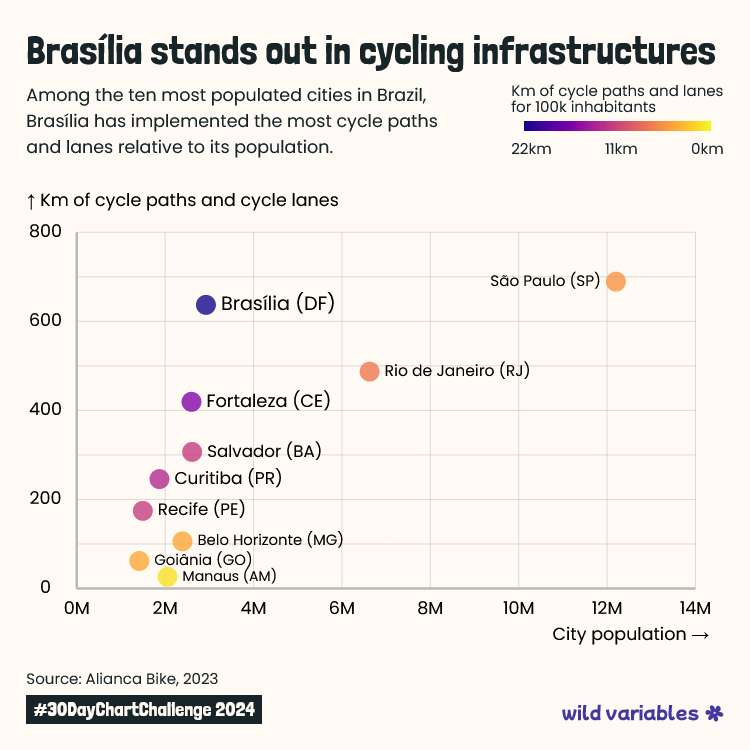
#30DayChartChallenge | Day 22 - Mobility
Cycle paths and cycle lanes in the ten
most populated brazilian cities 🚲
Made with Svelte and D3js
13
539
26 Apr 2024
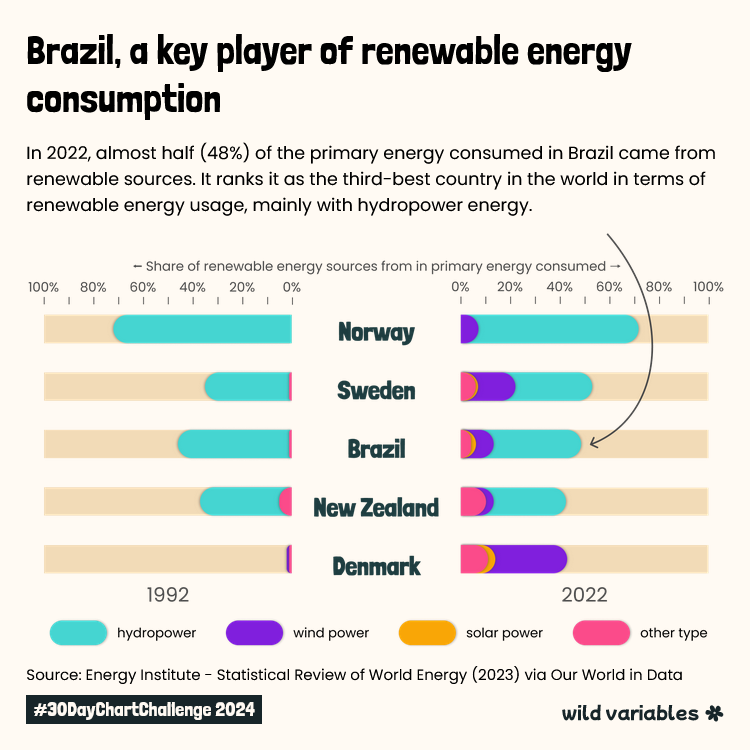
#30DayChartChallenge | Day 21 - Green energy
Top 5 Countries in Renewable Energy Consumption (2022)
Made with RawGraphs and Figma
2
16
586
24 Apr 2024
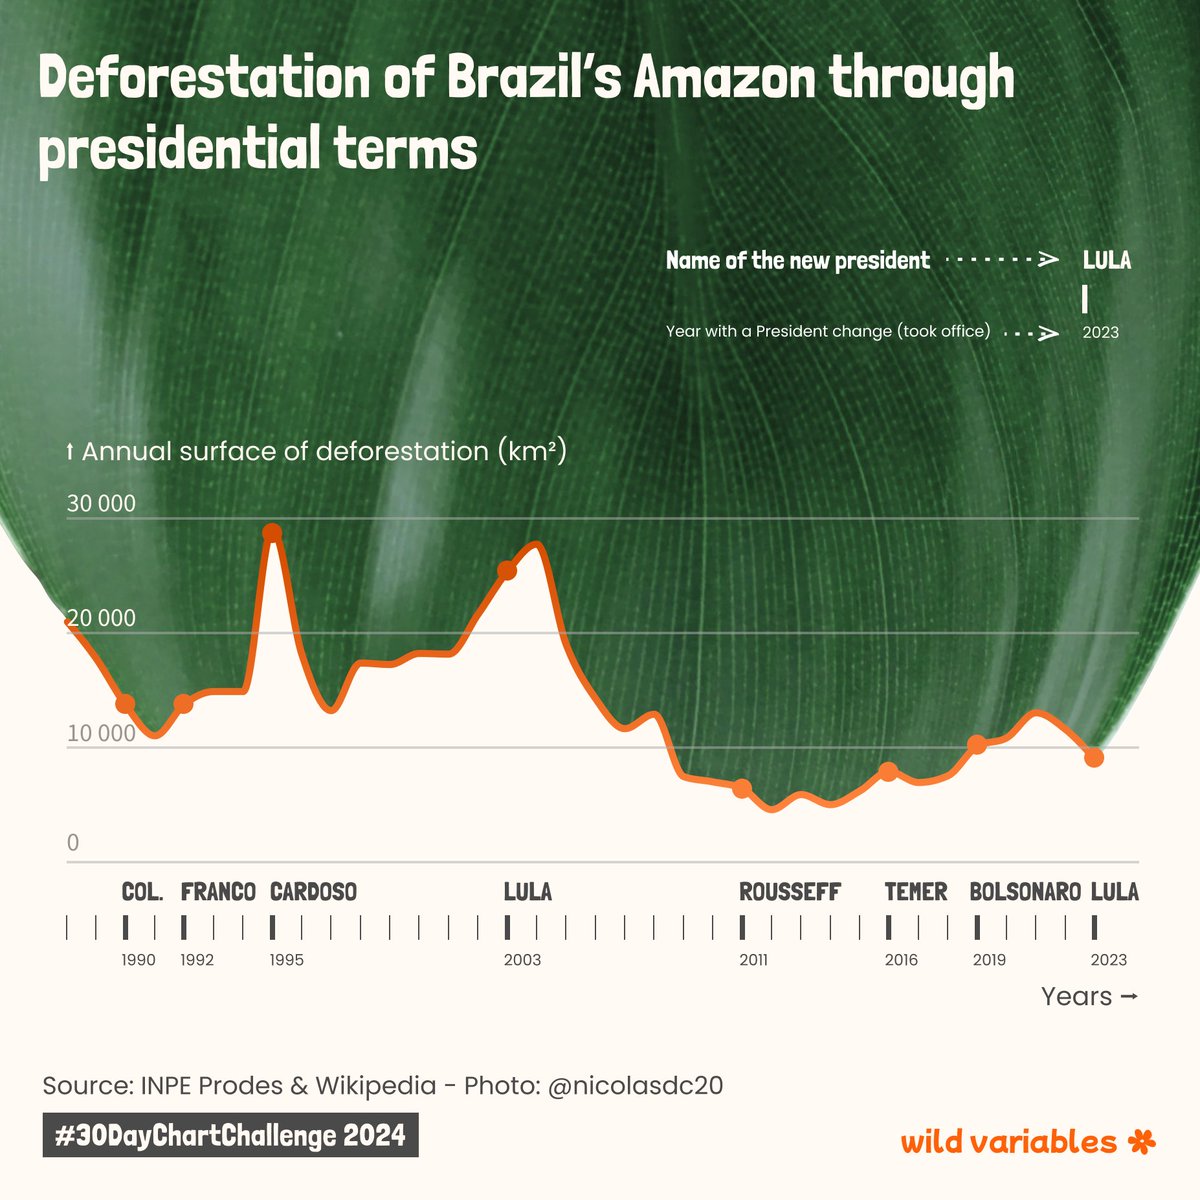
#30DayChartChallenge | Day 20 - Correlation
Few years ago, I created the first version of this visualization related to the deforestation of Brazil's #Amazon. I never published it so it seems a good time to update it🌿
Made with Flourish and Figma
1
4
51
1,971
24 Apr 2024
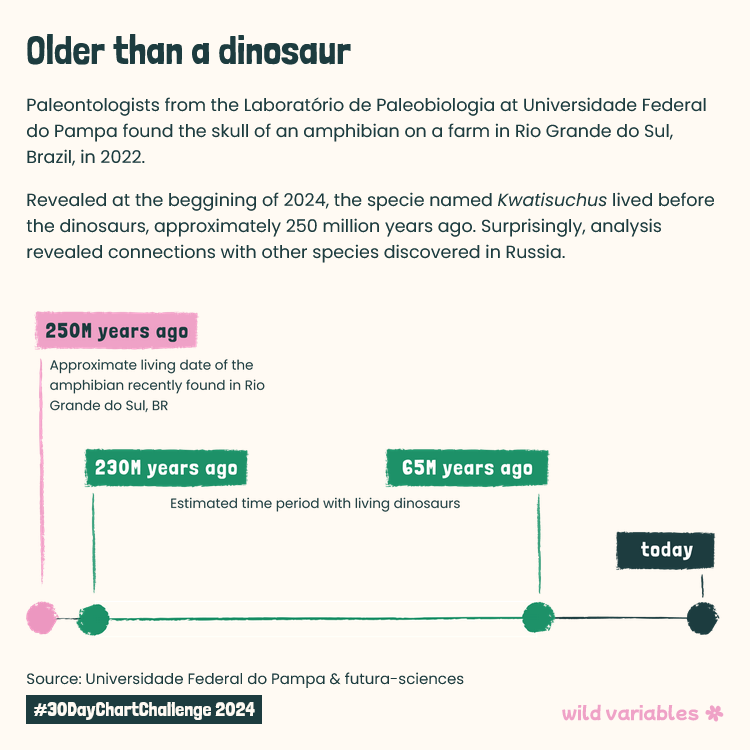
#30DayChartChallenge | Day 19 - Dinosaurs
After few days of break, it's time to continue the challenge! Here, I wanted to highlight a recent discovery made at @UnipampaOficial
Made with Illustrator and Figma
1
14
516
19 Apr 2024
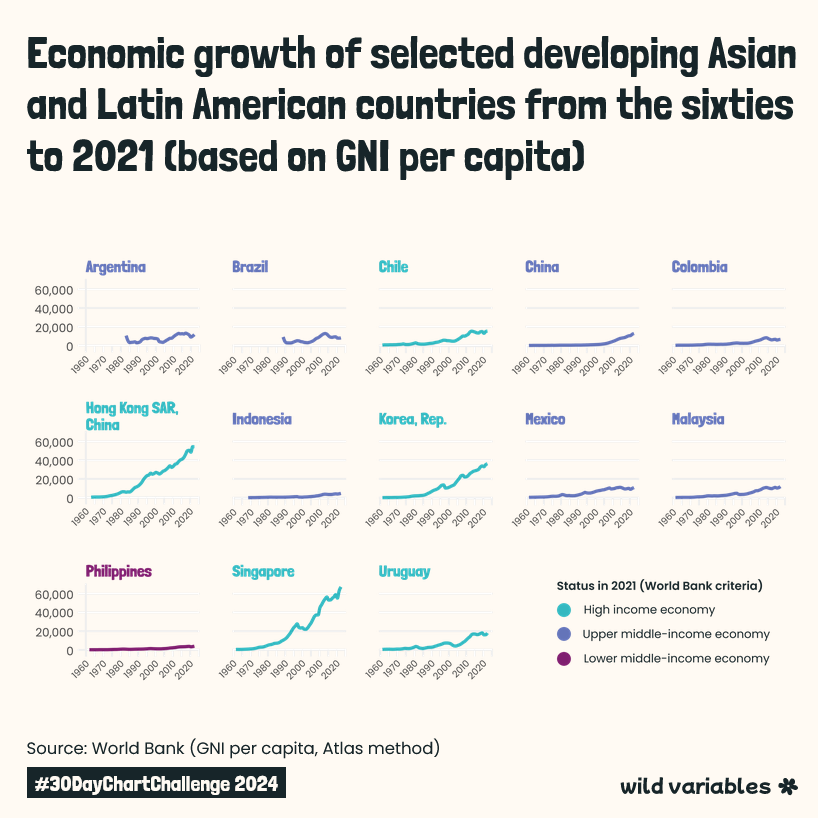
#30DayChartChallenge | Day 18 - Asian Development Bank
I struggled to link the prompt to my brazilian theme but I found some old data about developing Asian and Latin American countries (data.adb.org/dataset/years-m…) and tried to make an updated version
Made with Flourish and Figma
9
656
18 Apr 2024
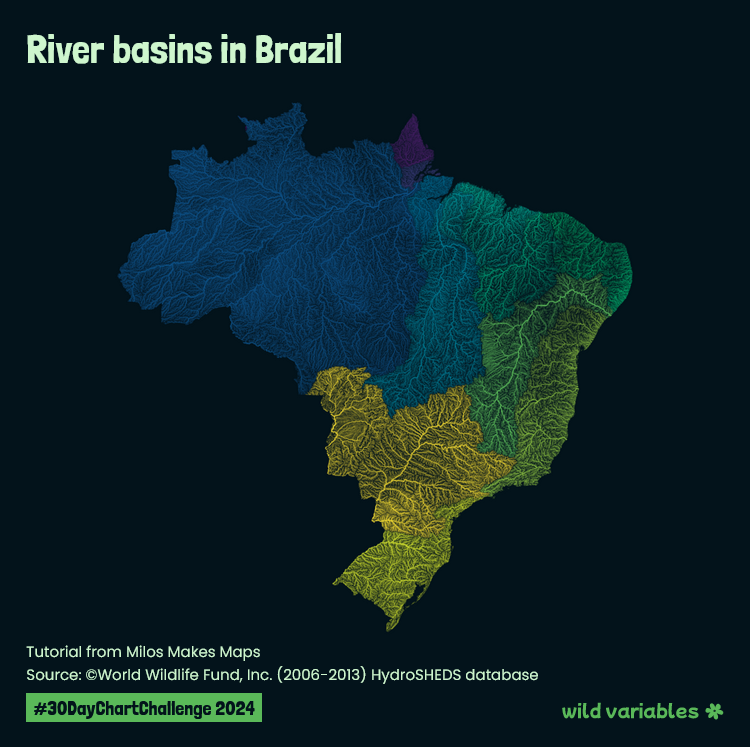
#30DayChartChallenge | Day 17 - Networks
For yesterday's prompt, I worked on my first R project. I only had time to reproduce the map from one of @milos_agathon's amazing tutorials and play with colors
Made with R
2
9
41
6,703
17 Apr 2024
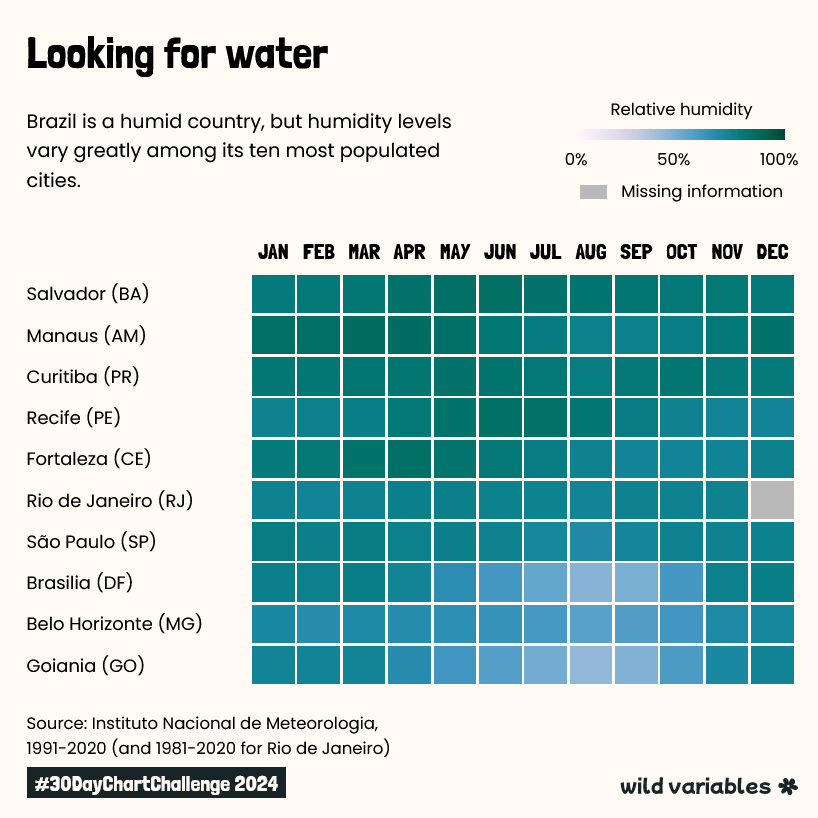
#30DayChartChallenge | Day 16 - Weather
As I adressed weather on Day 14 (heatmap), I deciced to do a Part 2 today, comparing humidity this time!
Made with #Svelte and #D3js
x.com/wildvariables/status/1…
14 Apr 2024

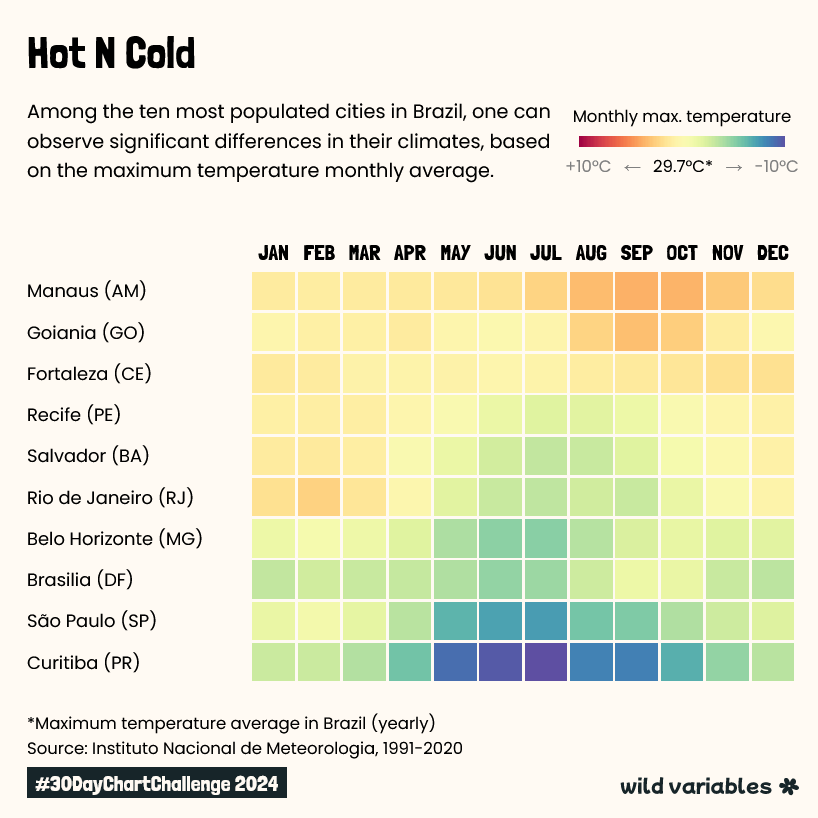
#30DayChartChallenge | Day 14 - Heatmap
Heatmap on heat: how the maximum temperatures evolve through the year in the ten most populated Brazilian cities
Made with #Svelte and #D3js
14
1,003
15 Apr 2024
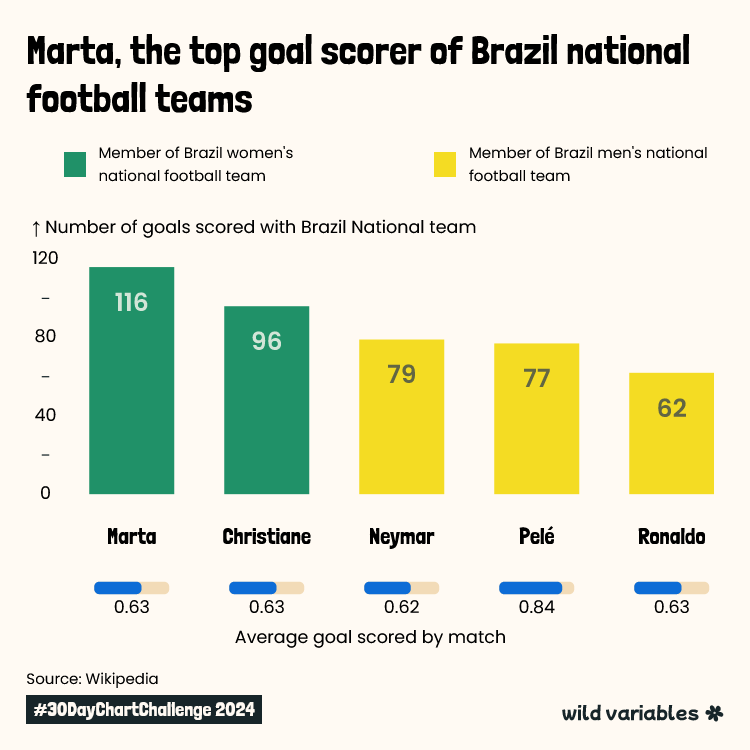
#30DayChartChallenge | Day 15 - Historial
We're halfway through the challenge, and I'm proud to have made it through the first 15 days! The viz of the day is celebrating the amazing athlete #Marta, and her historic record with the national team
Made with #Svelte and #D3js
1
3
23
915
14 Apr 2024
#30DayChartChallenge | Day 14 - Heatmap
Heatmap on heat: how the maximum temperatures evolve through the year in the ten most populated Brazilian cities
Made with #Svelte and #D3js
1
2
39
2,632
14 Apr 2024
I found this article from @lisacmuth in Datawrapper's blog super helpful! blog.datawrapper.de/divergin…
1
119