Tableau Visionary HOF, 6x @tableau Public Ambassador | 12x VOTD | @vizhealth, views are mine | Creatively #ADHD | #projecthealthviz #momswhoviz #datafam #data25
Joined February 2010
- Tweets 15,561
- Following 1,440
- Followers 10,925
- Likes 33,062
1,993 Photos and videos


Lindsay Betzendahl retweeted

🚨#B2VB Week 10: Build a Heatmap
Let's look at ocean conservation trends! This week we are exploring sea turtle sightings and strandings data from Canada.
To Join: Build your viz, Post with #B2VB, Tag us & submit!
🔗Data: bit.ly/4fpPjnZ
5
9
901

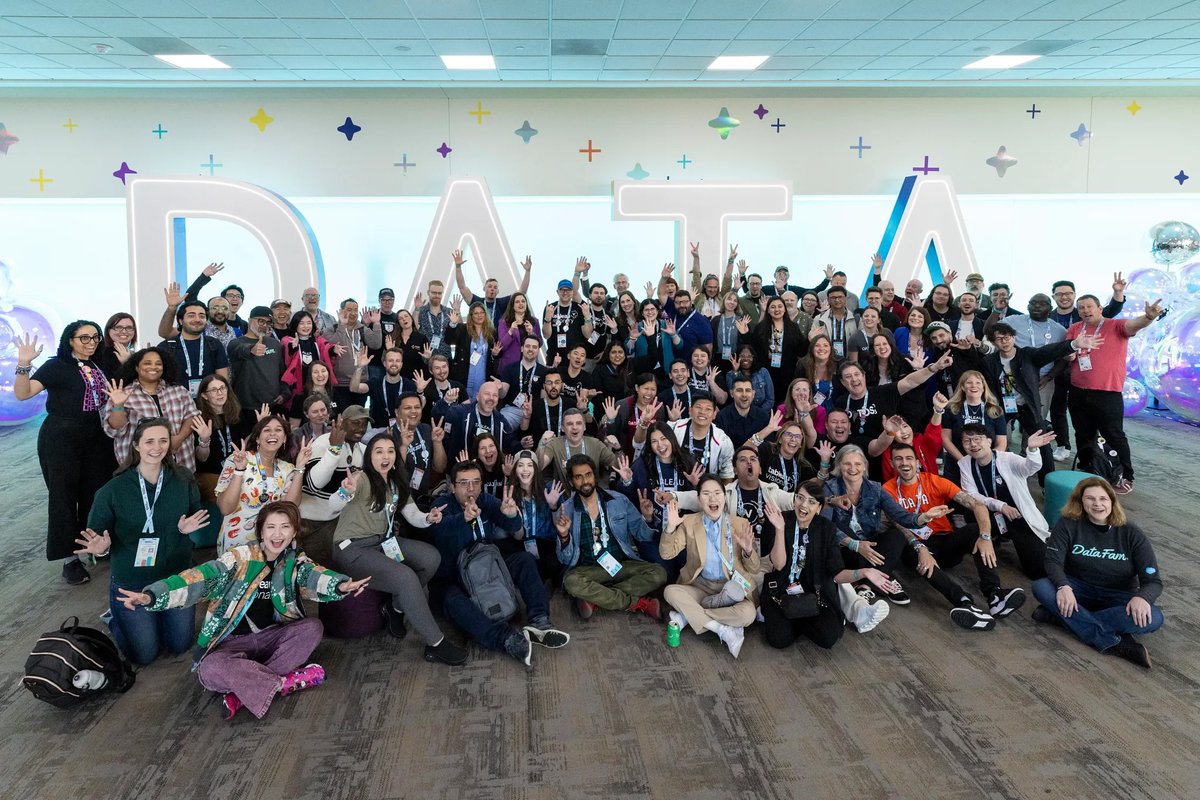
#TC26 has started! Monday kicked off with Data Tacos followed by Data Women! Today begins the connecting and learning!


1
17
480
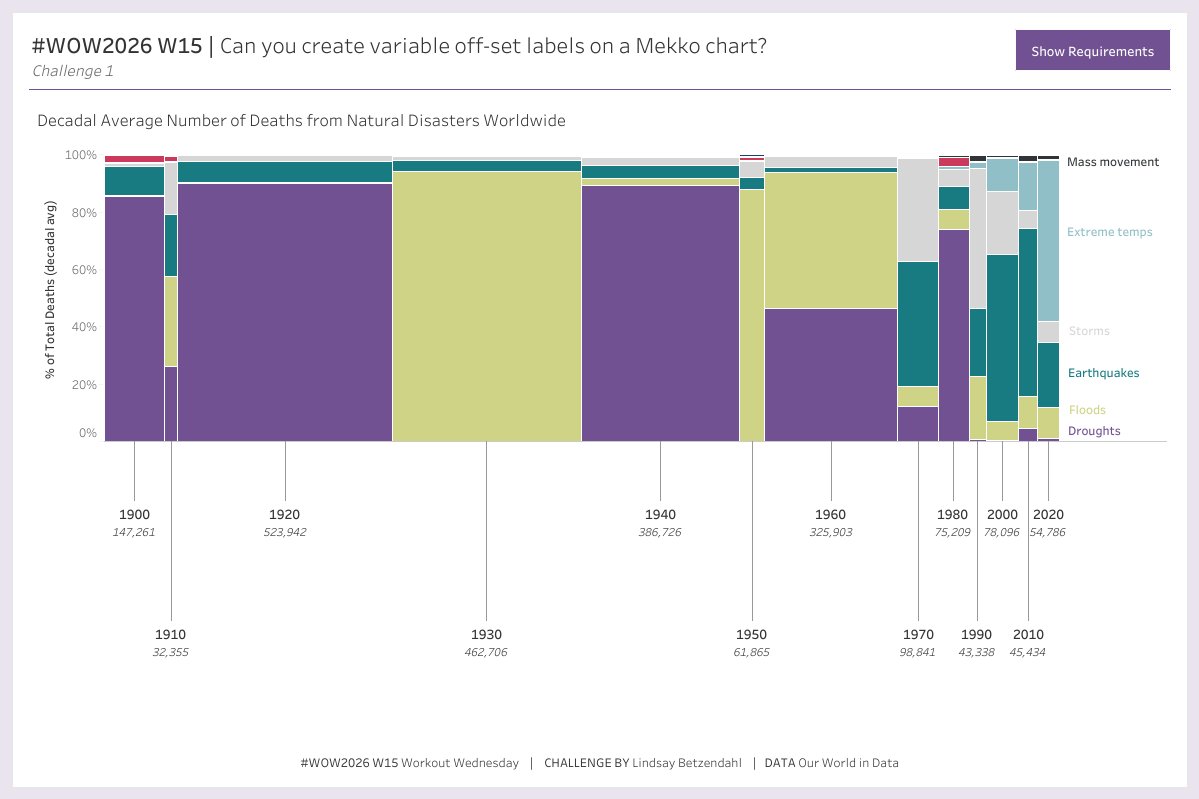
I'm honored to share my first-ever contribution to #WOW2026!! This challenge stemmed from a problem I needed to solve. How can I label a 100% stacked bar via a nice line and have the labels not overlap?
I started with @FlerlageKev's variable-off set label trick, but since I was using a horizontal stacked bar, I couldn't solve it in one sheet like I wanted. At least not initially!
This WOW has TWO challenges, but I think the one-sheet stacked bar solution should be super useful for others. So, check the second tab in the workbook! Good luck! Let me know what you think!
#datafam #tableauchallenge #WOW2026wk15 #tableaulearning #datatips #advancedcharts
public.tableau.com/views/WOW…
#WOW2026 | W15 | Variable Off-Set Labels
#WOW2026 | W15 | Variable Off-Set Labels
public.tableau.com
Apr 14

Welcome to Week 15 of #WOW2026 and week 3 of Community Month! I'm so excited to have @ZenDollData join the coaching crew this week! We're building a Marimekko and using @FlerlageKev's variable offset labeling!
Have at it!
workout-wednesday.com/wow202…
3
18
1,108
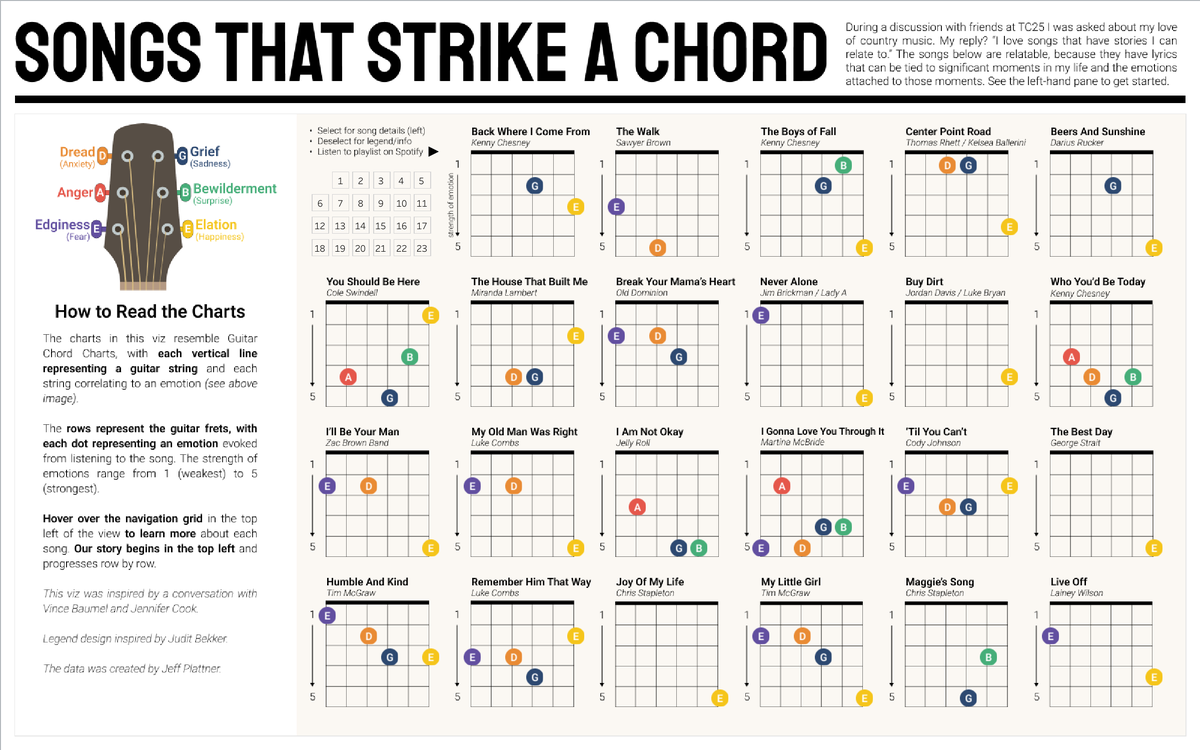
Really digging this viz!! Especially bc I love country music!
Apr 9

In this #VizOfTheDay, Jeff Plattner maps emotions to music using guitar chord–style small multiples—turning songs into visual chords that reveal how different tracks strike emotional notes.
Explore the viz on Tableau Public. tabsoft.co/3Q0ppwf
6
351
If you ever wondered what someone’s office looks like in the space you can’t see on a video call (such as what they look at)… well, now you know. 😉
I collect a LOT of art of varying styles, subjects, and mediums. It’s important to me to support artists I enjoy, so I usually own at least 2 from each artist. Most are originals and some the clock was custom made for me!
Oh and I have so many Legos that, yes, one is on the floor at the moment. 😬
4
15
398
So many good memories over the years from Tableau Conferences of the past!! Less than 40 days till #TC26 #data26
Mar 26

With 40 days until #Data26, here is the obligatory morning walk to the Vegas welcome sign at #Data22. This photo is with @sarahlovesdata, @lcicciari14, @zendolldata.

7
318
Lindsay Betzendahl retweeted

Mar 3
82 people. 17 countries. One #DataFam.
🔗medium.com/@adammico/datafam…
Introducing the #DataFamRisingStars Class of 2026 ... the builders, mentors & storytellers raising the bar for data. 🌟 With my partner @RinconAnnabelle and logo @ZenDollData. See cohort/nominators in comments!

8
28
68
22,221
Lindsay Betzendahl retweeted

Feb 18
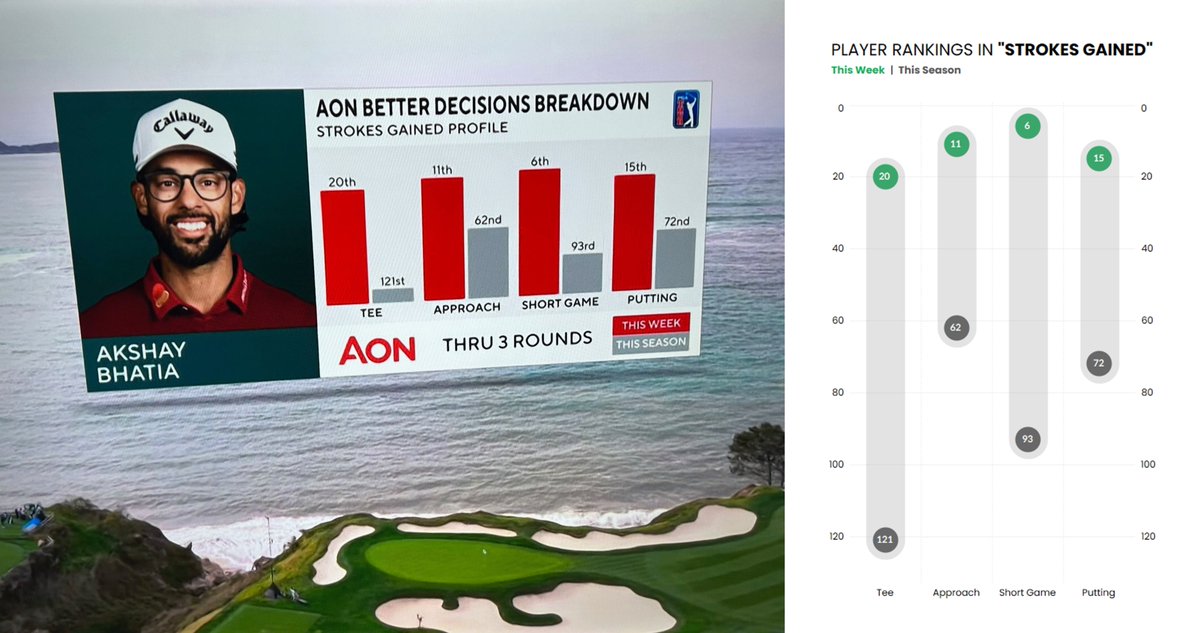
Hey @PGATOUR, saw this graphic on TV the other day. Generally, it's counterintuitive for smaller numbers to be shown as larger bars. I thought there might be a better way to visualize this information and make it easier for viewers to understand.
5
15
655
I love using containers in #Tableau—though that wasn’t always the case. Early on, the drag‑and‑drop approach felt sufficient. However, over time, the benefits of containers became clear: faster development, cleaner layouts, and far better control over design.
This example dashboard highlights common challenges with a tiled approach, contrasted with a container‑driven version.
If you’ve been hesitant to use containers—or aren’t sure why they matter—find out why containers are game-changers. Check it out 👇
public.tableau.com/app/profi…
3
24
935
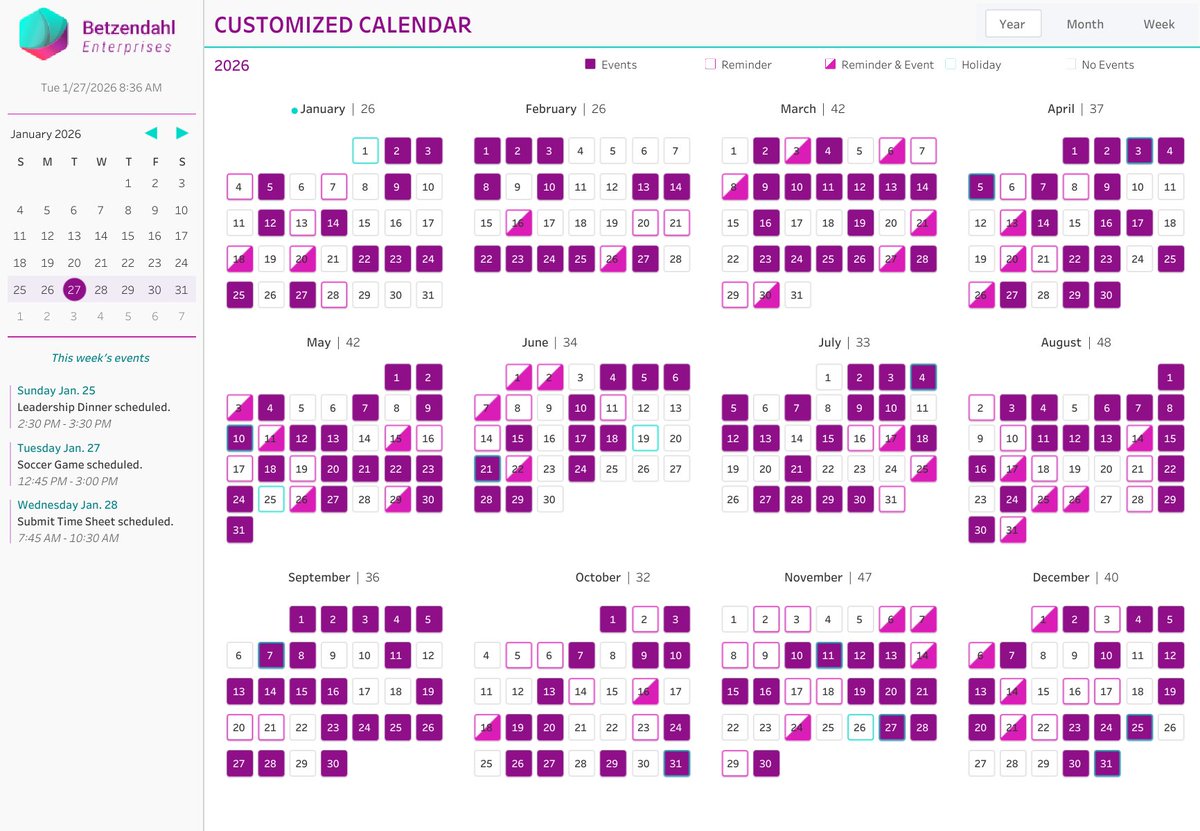
Thanks @tableaupublic!!! This was super enjoyable to build. I love Tableau’s DZV and how it can improve UX. Tableau makes even building a calendar SO MUCH FUN! It is certainly the superior visualization tool. 💪🏻
Jan 27
This #VizOfTheDay by @ZenDollData is a year-at-a-glance calendar that uses color-coded visuals to instantly show daily events, reminders, holidays, and overall activity levels across all months. Inspired by @aabattani.
Explore the viz. tabsoft.co/4rhs4z4
1
20
582
Lindsay Betzendahl retweeted
Jan 19
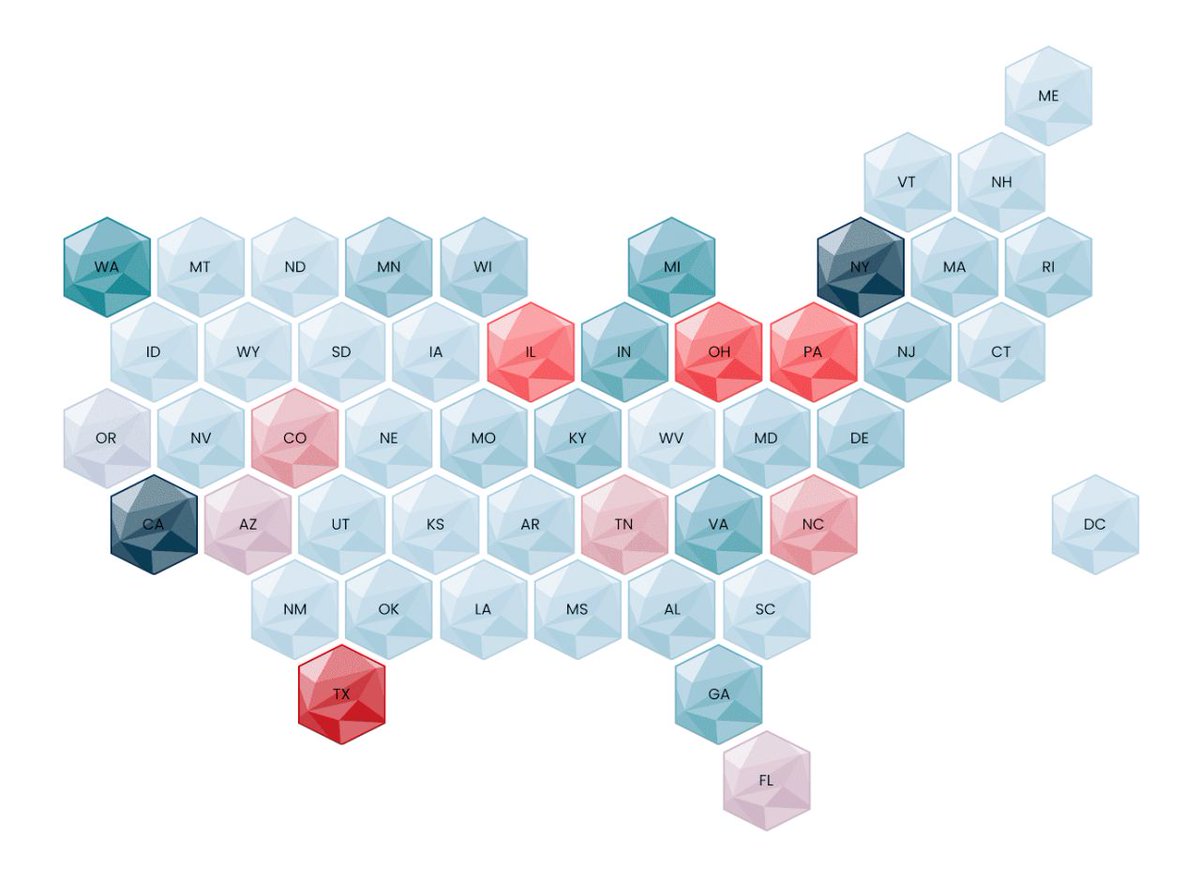
Super helpful blog post from @flerlagekr showing a new way to create hex maps, without all the drawbacks of other methods:
lnkd.in/ejycsWDD
1
8
23
813
In light of the recent release of #zachbryan's new album "With Heaven on Top", I figured why not share my viz I built shortly after seeing him at #LincolnFinancial in Philly the summer of '24. He was amazing, and I hope to see him again sometime! #datafam #dataplusmusic
public.tableau.com/app/profi…
4
302
Finally published this #tableau calendar viz! I had a fun time making each of the views and challenged myself with table calcs. I used @AdamMico1’s datamockstar GPT for the fake data which was perfect to replicate what I needed!! Just keep in mind some data doesn’t make logical sense (like weekend meetings lol).
public.tableau.com/app/profi…
1
9
325
Lindsay Betzendahl retweeted
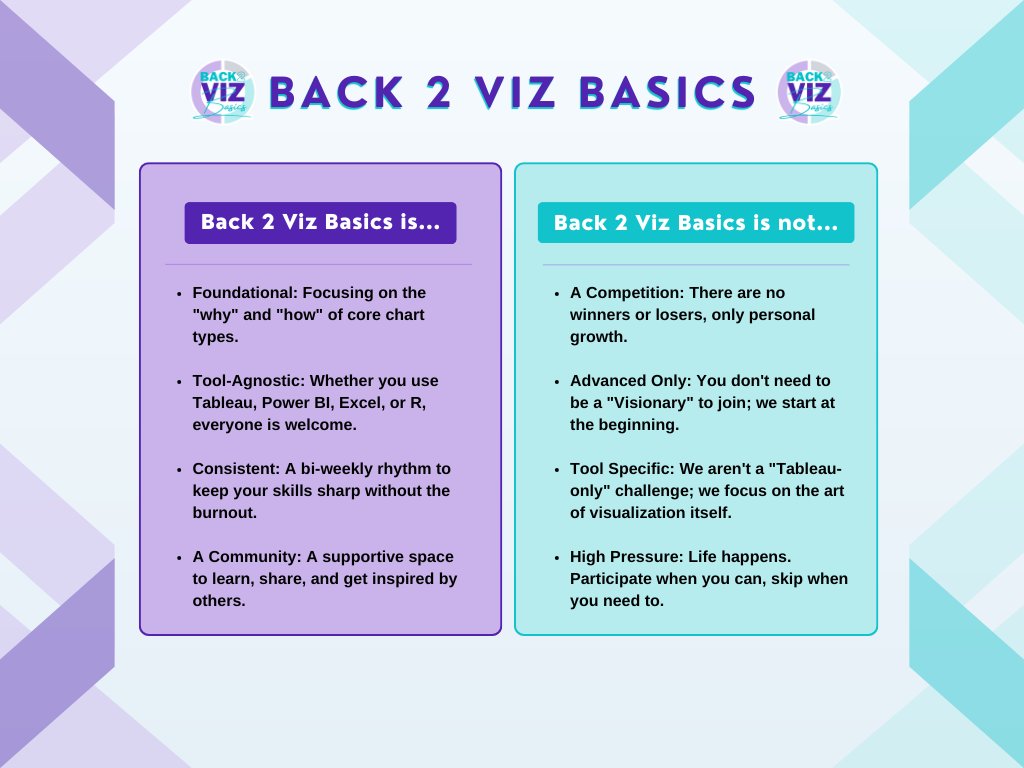
🌟Back 2 Viz Basics starts MONDAY!
As we kick off 2026, here’s a reminder of what #B2VB is all about. Whether you're a total beginner or a pro refreshing the fundamentals, there’s a place for you here.
New challenge drops Monday! See you there.
#Tableau #PowerBI #B2VB

8
18
929
Lindsay Betzendahl retweeted
🚨Welcome to the official home of Back 2 Viz Basics on X!
Our mission: Build your #DataViz foundations with weekly, tool-agnostic challenges.
Follow our new X page for 2026 prompts, spotlights, and tips starting mid-January!
#B2VB #DataCommunity #tableau #PowerBI
3
10
1,715