
We build tools to help Shopify brands scale smarter, not harder. Built by 9-figure store owners, backed by data. Breaking down the future of AI in ecommerce.
Joined February 2016
- Tweets 1,054
- Following 40
- Followers 705
- Likes 421
455 Photos and videos


Pinned Tweet

May 11
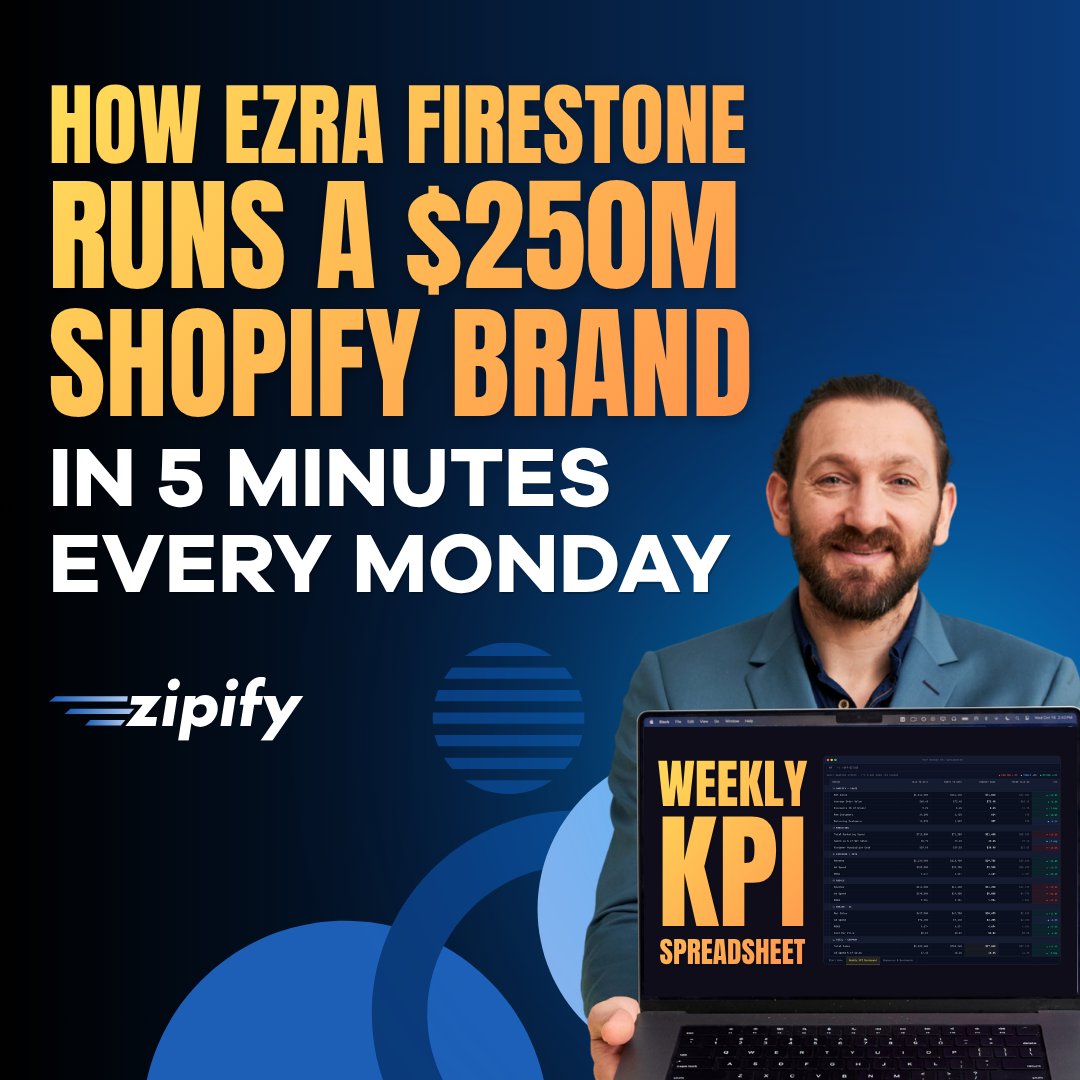
@ezrafirestone runs his $250M Shopify business off of one Google Spreadsheet.
Most ecommerce teams are split pulling reports from 4 or 5 different platforms, Meta, Google, Amazon, Shopify, their CRM, etc., and trying to make sense of it before Monday's meeting.
It's messy, it's time-consuming, and it still doesn't tell you what you actually need to know.
So performance trends only get calculated once or twice a quarter instead of every week.
Which means small problems, a dip in ROAS, a drop in repeat customer revenue, don't get caught until they're obvious.
And way more expensive.
That’s why Ezra created this spreadsheet for every one of his 8-figure brands. He checks it religiously every Monday, because it helps him spend less time lost in reports and more time actually acting on the numbers.
Here’s what’s inside:
📊 20 metrics show your entire business health in one glance
🔁 New vs. repeat customer revenue week over week & Y/Y
💰 Marketing spend as % of net sales to keep margins safe
📈 ROAS for Meta, Google, Amazon
🛒 AOV for all ecommerce channels: Shopify, Amazon, Walmart
🚨 An early warning system to catch problems before they cost you
And it’s AI friendly, so you don’t have to import your numbers manually.
👇 Grab it here: hubs.la/Q04g9RxC0
1
2
1
525
Jun 11
"You don't have a traffic problem. You have an AOV problem. Fix that, and suddenly your ad budget starts going a lot further." — Ezra Firestone (250M Shopify founder)
Most operators hit a CAC wall and immediately look at their ad account.
But there’s a more effective KPI to check before that: AOV.
AOV is the lever that changes the math on every dollar you're already spending.
When AOV goes up, your effective ROAS goes up with it, without changing a single campaign.
And when ROAS goes up, you can afford to outbid competitors, buy more traffic, and scale while they’re stuck optimizing creatives and hoping CPMs come down.
Our team built a 10-point audit covering every funnel stage: pre-purchase, post-purchase, in-checkout, slide cart, bundles, split testing.
In the stores we audit, 20–30% of revenue is going uncollected somewhere in that list.
Find it. Fix it. Watch the ROAS math change.
Start with the audit: hubs.la/Q04l5jzq0
#upsell #business #ecommerce #shopify #aov #kpi
1
43
Jun 9
Three numbers every Shopify operator needs to see right now.
📉 Median AOV dropped $9.32 in two weeks, right after the April tariff announcements.
📉 Median Meta ROAS fell 33.7% in the same window. CPMs are up 20% for the year.
📉 The average brand now loses $29 on every new customer acquired. CAC is up 222% over 8 years.
The variable you still control is AOV.
A 10% lift in AOV offsets a 20% increase in CAC, without adding a dollar to your ad budget.
"Increase AOV and ROAS goes up automatically. Then you can afford to outbid competitors, buy more customers, and really scale." — Ezra Firestone
Our team built a 10-point self-audit covering every funnel stage: pre-purchase, in-checkout, post-purchase, slide cart, split testing, and bundles.
Most stores leave 20–30% of revenue uncollected somewhere in that list.
The audit shows you exactly where.
Check your score: hubs.la/Q04kCRxn0
#aov #upsell #business #ecommerce #shopify
2
2
42
Jun 8
ROAS is one of the metrics every operator watches. But watching it isn't the same as knowing what to do with it.
When ROAS drops, most of the response goes into Ads Manager, new creative, tighter audiences, smaller budgets.
That's fine. But the truth is ROAS will always trend down over time. Ad costs climb. Platforms get crowded. Creative fatigues.
The best metric you have to fight that trend isn't in Ads Manager. It's your AOV.
That's why Ezra Firestone, who runs a $250M Shopify operation, pulls his AOV report before he touches a single ad campaign.
When each order is worth more, every dollar of ad spend works harder. Ad efficiency improves.
Margin improves. CAC tolerance improves.
The fastest AOV levers many Shopify stores still miss:
✅ Pre-purchase upsell offers
✅ Multi-step post-purchase upsell funnels
✅ Bundles and product pairings
✅ Free shipping thresholds
But AOV is just one of the metrics that reveals whether your business is actually healthy.
ROAS, CVR, CAC, most Shopify operators are watching the right metrics, they're just not seeing the full picture.
By the time a problem is obvious enough to notice, it's already hit the bank account.
Ezra runs a 5-minute KPI check every Monday to solve that problem. You can get the full breakdown and download his exact spreadsheet for free here.
👉hubs.la/Q04kw9LS0
#kpi #business #ecommerce #shopify #marketing #aov #roas #cpa
1
42
Jun 4
Post-purchase upsells are one of the highest-converting offers in your funnel, and now they’re even better.
We just launched 10 new updates to the OneClickUpsell post-purchase builder including:
More design flexibility: because how your offer looks affects whether people take it. Control your layout, spacing, image sizes, and CTA placement so you can test more and convert more.
Smarter conversion tools: badges, countdown timers, and button layouts that create urgency and trust right at the moment your customer is most likely to say yes again.
Per-locale layout customization: so global brands can tailor their post-purchase offer to each market and language, instead of forcing one layout to do a job it wasn't built for.
Post-purchase offers are already the easiest place to increase your AOV. These updates make it even easier.
Read the full breakdown to all updates: hubs.la/Q04k9S0Y0
#featurerelease #productupdates #shopify #ecommerce #business #upsell
2
63
Jun 3
You can only get as far as you can think.
Jeff Bezos has two whole days just to wander. No agenda. No input.
So take four hours a week. No calls, no Slack.
Just you and a notebook and see how much you can decompress.
@ezrafirestone
#mindset #business #ecommerce
2
2
207
Jun 2
Most Shopify operators can tell you their ROAS. Almost none can tell you their marketing spend as a percentage of net sales.
But it's one of the earliest warning signals that your margin is disappearing.
That's why Ezra Firestone checks it first thing every Monday morning across his $250M Shopify operation.
The rule he runs his 9-figure business on:
✅ Under 30% — healthy
⚠️ 30–35% — investigate now
🚨 Above 35% — you don't have enough margin to run the business
When it goes red, most operators panic and slash the ad budget. Ezra doesn't. He starts with one diagnostic question: Did spend go up, or did revenue go down?
If spend climbed, he audits channel by channel for fatigue, rising CPMs, or campaigns that scaled without a matching lift in sales.
If revenue dropped, the problem isn't his ads, it's AOV, conversion rate, or new customer mix
.
It's one of 20 KPIs Ezra reviews every Monday, in under 5 minutes, using a free spreadsheet you can download here:
👉 hubs.la/Q04jQpxW0
#kpi #marketing #shopify #ecommerce #business
1
41
Jun 1
This spreadsheet just became your Monday morning reporting intern.
Every week, Ezra Firestone uses Claude Cowork to pull KPI data from Shopify, Meta, Google, Amazon and retail into a custom spreadsheet in under two minutes. No manual exports, no platform hopping.
One of the 20 KPI metrics he tracks: Discount Percentage.
10-15% is normal for most Shopify stores, but a sudden jump to 20-25%, and you didn't run a sale? Then one of your coupon codes leaked.
It's one of the most common revenue leaks on any Shopify store, and most operators won't catch it until it's already compounded.
Ezra catches it every Monday before his first cup of coffee.
If you want the same setup, you can copy his exact spreadsheet here, all 20 KPIs you can pull with AI in two minutes: hubs.la/Q04jF54b0
#claude #cowork #ai #marketing #shopify #ecommerce #business
1
49
May 28
Money won't do it for you.
@ezrafirestone's seen people make millions and still be miserable. Fulfillment isn't something you get, it's something you are.
And if you can't find joy right now, with what you have, more zeros in your bank account won't change a thing.
Figure out how to love your today, because that's ultimately what life is. .
#business #ecommerce #entrepreneurship #mindset
1
3
183
May 27
"Most operators don't find out their business is bleeding until it's too late." — @ezrafirestone
By the time you notice Meta spend is down 10% MoM, it's been dropping for weeks.
By the time marketing spend climbs over 35% of net sales, your margin is already gone.
Most operators have plenty of data and zero visibility. The metrics they actually need to predict trouble are scattered across five or six platforms.
Ezra's fix is one spreadsheet that brings all those scattered numbers into one place. It shows him exactly what's breaking and what he has to do to fix it, in 5 minutes.
-Marketing as a % of net sales.
-New vs. Repeat customer revenue.
-Average order value for all channels.
-Discount percentage.
These are just four of the 20 KPIs inside Ezra's Weekly KPI Spreadsheet, the same tool he uses to run a $250M Shopify brand.
Get the free spreadsheet and watch his 10-minute walkthrough video here: hubs.la/Q04j5f3J0
#upsell #business #ecommerce #shopify #marketing #aov
2
1
180
May 27
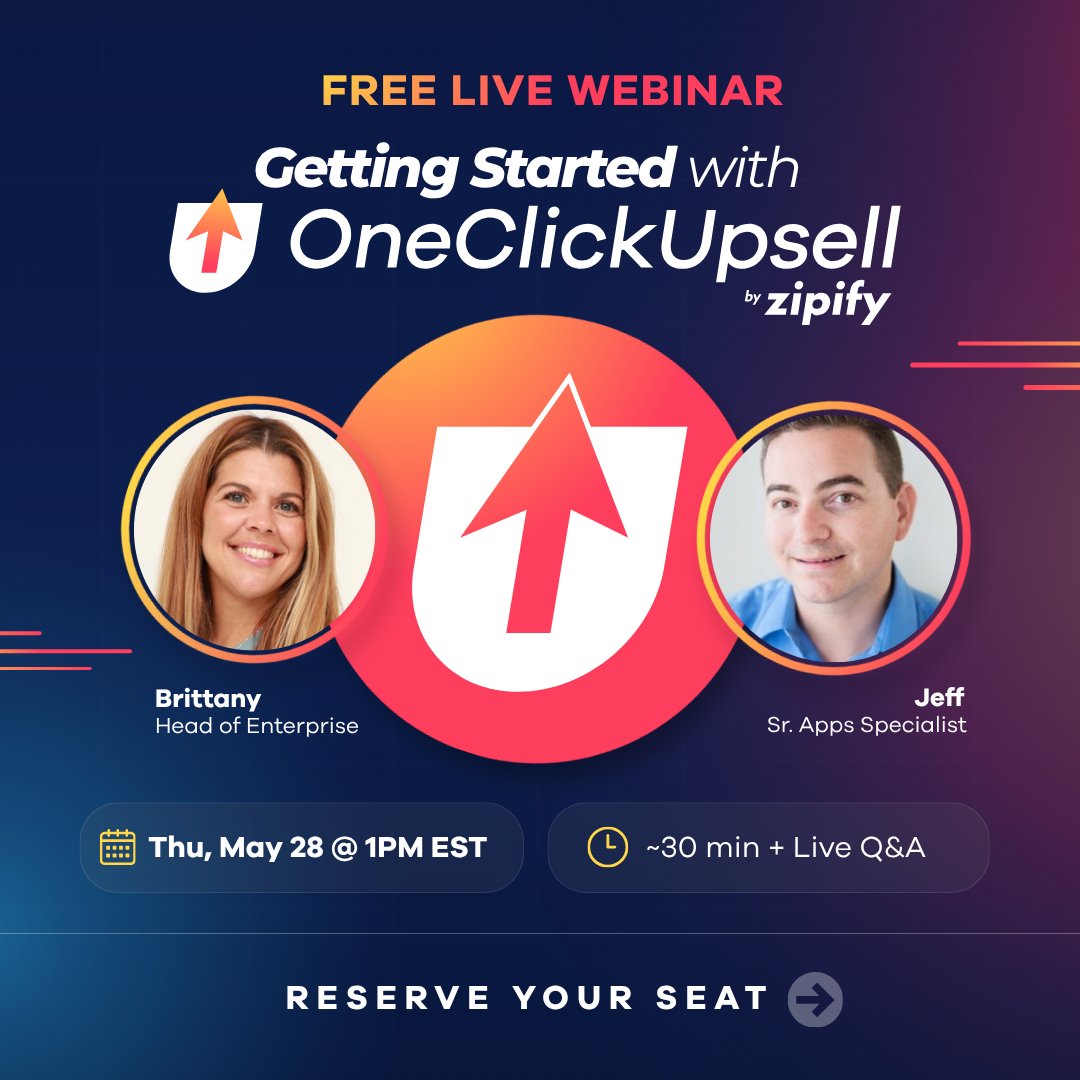
Want to see how OneClickUpsell users are driving over $1B in upsell revenue?
Join Zipify's top experts tomorrow for a live webinar to see how real stores use OneClickUpsell to earn up to 30% more revenue on every order.
📅 May 28th at 1PM EST
Here's what we'll cover:
✅ The upsell strategies driving revenue across 15,000 stores
✅ How to build, configure, and launch your first funnel
✅ A behind-the-scenes look at how 7-8 figure brands set this up
✅ Live Q&A
Can't make it live? Register anyway, we'll send you the recording.
Save your spot here → hubs.la/Q04j4JQv0
14
May 26
If you're running promotions too often, your audience has probably tuned you out.
It's like sending cold emails to a list that never opens.
The offer might be great, but nobody's buying because nobody's paying attention anymore.
When you only show up to sell, your audience learns to ignore you.
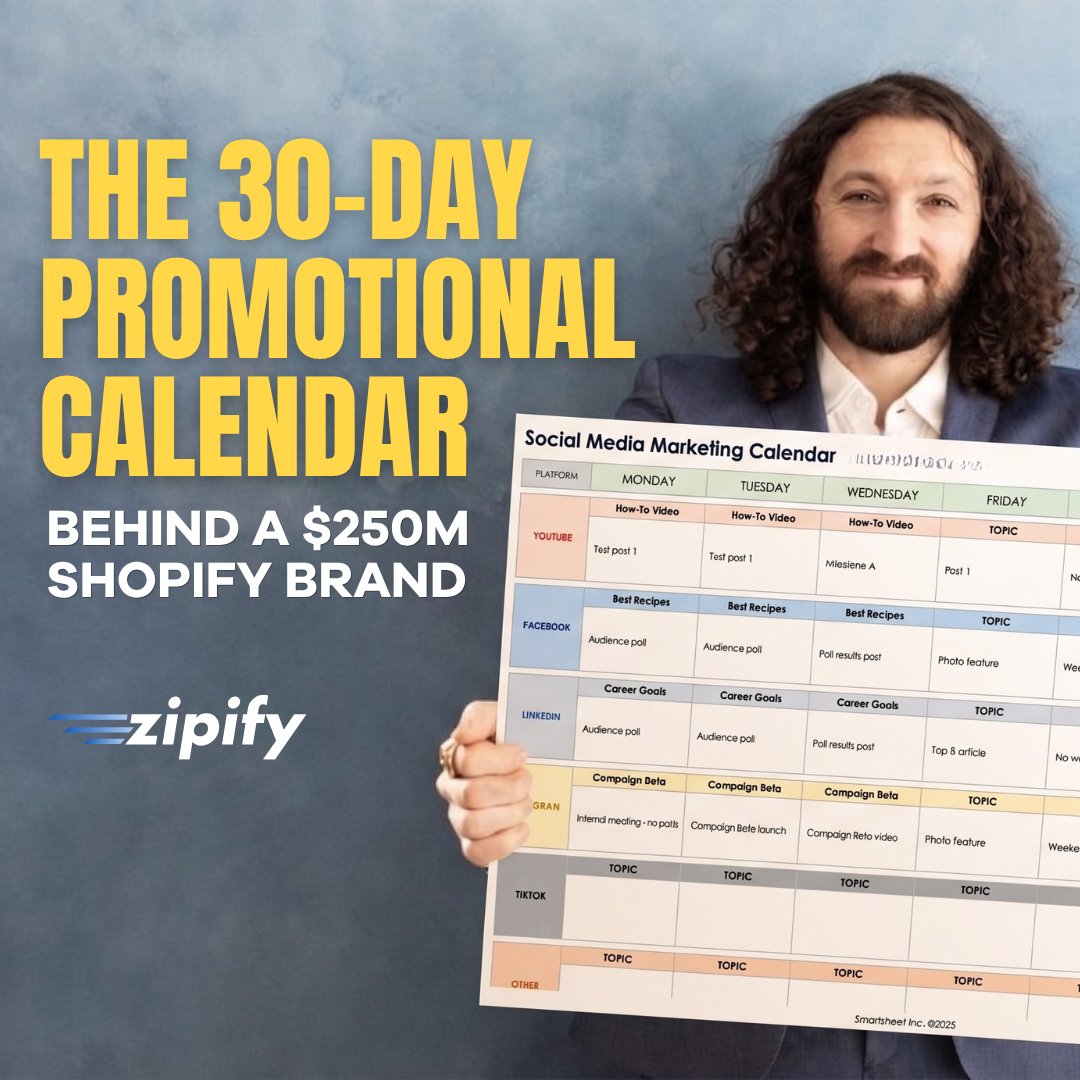
Here's how Ezra Firestone, founder of BOOM! Beauty, a $250M Shopify brand, approaches every promotion differently:
Before a single sale goes live, he spends three weeks warming up his audience with Little Rocks content.
Short videos, customer stories, product education, and social proof. Content that builds trust and earns attention, without asking for a sale.
By the time the promotion drops, his audience isn't cold. They're engaged, they're familiar, and they're ready to buy.
As Ezra puts it:
"Little Rocks aren't about selling — they're about building trust, so when your next big promotion drops, the audience is primed to buy."
The difference between a promotion that performs and one that falls flat isn't the offer. It's the relationship you built before it dropped.
See the full 30-day breakdown of how Ezra runs this system in our latest post: hubs.la/Q04hSP950
#contentmarketing #promotions #upsell #business #ecommerce #shopify #marketing
17
May 19
If your CPAs keep climbing no matter how much you optimize your ads, ask yourself this:
Are you trying to sell to cold traffic or warm?
Most Shopify brands run a sale. It works okay, so they run another one. Then another.
Each time paying to reach people who don't know them, don't trust them, and have no real reason to buy.
Each sale the CPA’s continue to climb.
So they tweak the creative. Test new copy. Adjust the targeting.
But the truth is, you can't out-optimize cold traffic. Warm audiences convert. Cold ones don't.
So the key to scaling profitably isn’t to run better ads. It’s to build warm audiences BEFORE the sale ever drops.
3 weeks of content that earns trust and engagement, then 1 week of promotion results in:
Lower CPAs. Higher ROAS. A sale that actually performs.
Ezra Firestone runs this exact system at BOOM! Beauty, a $250M Shopify brand. See his exact 30 day promotional calendar: hubs.la/Q04h8Wwh0
#contentmarketing #promotions #marketing #shopify #ecommerce #upsell #business
1
49
May 18
Struggling to grow your email list? Here's one of the easiest tactics @ezrafirestone used to grow BOOM!'s audience to 935K subs and followers.
Listicles. Content like "8 skincare tips for women over 40" or "5 mistakes you're making with your morning routine."
Here's the formula Ezra uses to create listicles for BOOM!:
- Pick a topic your audience genuinely cares about (survey your customers or mine your reviews)
- Break it into a scannable, valuable list
- Record it as a video and post it on every platform - ads, socials, blogs, etc.
Listicles work because they deliver genuine value without feeling like a sales pitch.
They give value before they ask for a sale. And when your content genuinely helps someone, they want more of it. That's how you grow your list.
Read the full breakdown, including 25 content ideas you can steal for your own brand: hubs.la/Q04h1ZHN0
#contentmarketing #marketing #shopify #business #upsell
35
May 13
Most people obsess over what they eat. Fewer people think about what they feed their mind.
But what you consume mentally shapes how you think, which shapes how you act, which shapes your entire life.
Social algorithms aren't neutral, they're built to keep you scared and angry because that's what holds attention. You get to choose whether you let that in.
Deliberate consumption is key in 2026.
#mindset #business
1
29