
Certified Financial Technician - CFTe | Financial Analyst & Educator | Media Presenter | Keynote Speaker | News Corp columnist | Founder of MtM
Joined January 2022
- Tweets 4,253
- Following 96
- Followers 21,429
- Likes 3,082
2,606 Photos and videos


Pinned Tweet

22 Dec 2025
Major Milestone achieved for the public MtM account. (Account has tripled in 18months)
At the beginning of last year, a few MtM students asked me a fair question:
“How do we know what you’re teaching actually works?”
So as you know I decided to show them — publicly.
I opened a public MtM investing account (not a trading account). Minimal transactions. Long-term holds. I deposited $100,000 AUD (about $63,000 USD at the time).
You’ve all been able to watch this journey publicly online for the last 18 months, from the moment I started it in April 2024 showing all the transaction statements. And as you know, we’re ASIC licensed — we’re an Authorised Representative of an AFSL — so I can’t post anything that’s misleading or untrue.
As of today, that account has tripled to $189,000 USD.
And what’s interesting is the part most people miss: the journey. A couple of months ago I showed you the account dropped from $270K to $220K — down $50,000aud in a couple of weeks — while many were calling a major top in gold and silver.
My view didn’t change: the top wasn’t in.
Because if you can’t handle the zags, you don’t deserve the zigs.
Most people will never get outcomes like this for one reason: they don’t hold their winners. They cut them out of fear.
Ironically, people hold onto losers because they don’t want to be wrong… but they struggle to hold onto winners because they don’t believe it can keep going.
That’s why data > emotion.
One thing you’ll notice is that the original $100K AUD isn’t $300K AUD yet and that’s simply because the Australian dollar has strengthened.
When you invest in US assets from Australia, currency moves matter. As the AUD rises, it reduces the translated value of USD gains back into AUD terms. It’s a key factor to understand when investing offshore as I mentioned the other day with the AUD being bullish.
But the best part of this milestone isn’t my result.
I’ve received hundreds of messages from MtM students seeing similar progress — many doubling their accounts because they’ve learned to follow process, manage psychology, and let winners work.
And that, to me, is the most important part.
It’s easy for one person to do well. There’s no value in me knowing how to do this if I can’t transfer the skill to other people — so they can build it for themselves.
That’s what MtM is. It’s education.
I spent over a decade as a primary school teacher and HOC and that experience is everything. Not because it sounds nice but because it taught me how people actually learn.
It’s not just what you teach. It’s how you sequence it.
You build it like curriculum: one block at a time, in the right order, so students develop a deep, thorough understanding — not just a few tricks, not just a couple of setups, not just “signals.”
Because markets don’t reward memorisation.
They reward understanding.
masteringthemarkets.com
Learn - grow - succeed


7
6
116
56,410
Will the RBA hike rates again tomorrow?
2
2
33
2,139
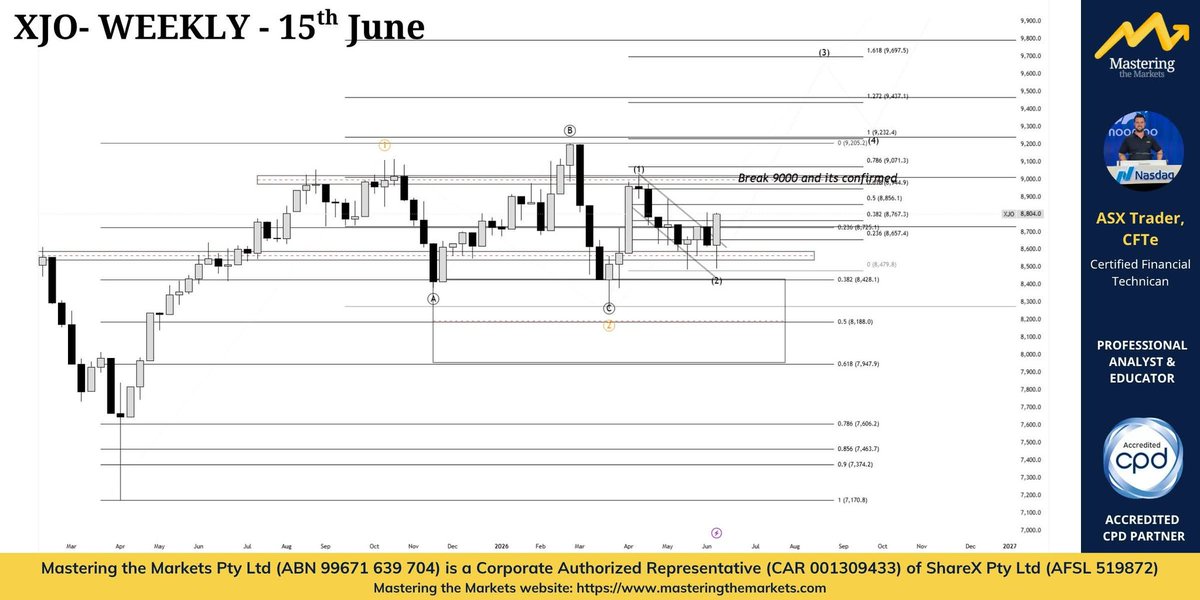
Massive signs are starting to appear that the low may already be in for the Australian share market.
At the start of the year, I said on our free webinar that I expected 2026 to be choppy, frustrating, and difficult for investors. That's pretty much exactly how it's played out.
The good news? The evidence is now starting to shift.
We're seeing multiple sectors turn higher, key technical signals improve, and the broader market show signs that it may be ready to resume its uptrend. While nothing is ever guaranteed, there are growing reasons to believe the next few months could look very different from the first half of the year.
I've put together a detailed breakdown covering the major sectors, key charts, and the technical signals I'm watching right now.
If you want to see exactly what I'm seeing and why I believe the Australian market could trend higher from here, jump into the Free Academy and check out my latest report.
academy.masteringthemarkets.…
The first half of the year was tough.
The next quarter might be where the opportunities start showing up.
2
4
69
4,842
How did I call the top in gold and silver back on January 30?
A couple months prior, I had spoken on stage Australia's largest gold conference. Everywhere I looked, people were incredibly bullish. The conversations were all the same.
"Gold can only go higher."
"The fundamentals are perfect."
And while I agreed with the long-term bullish case, I told people something they didn't want to hear:
Somewhere in Feb-April you're probably about to see the top of this wave.
Not the end of the bull market. Not the end of the cycle. Just the top of the current wave.
Why?
Because markets don't move in straight lines.
The answer wasn't hidden in some secret economic report. It was sitting right there in the charts.
When I combined the technical picture with decades of seasonal data, the odds of a pullback were becoming increasingly obvious.
Seasonality showed that gold & precious metals typically enters a weaker period around February and into the middle part of the year.
Technical analysis was also warning that momentum was becoming stretched and that the market was vulnerable to a correction.
When multiple forms of analysis point in the same direction, you pay attention.
The challenge is that sentiment is usually at its most bullish near tops and its most bearish near bottoms.
That's why so many investors struggle. They're reacting to emotions instead of reading the market.
The correction we've seen since then doesn't change my bigger view.
In fact, it's exactly what healthy bull markets do.
They advance.
They correct.
They shake people out.
Then they continue.
And today, those same multiple pieces of evidence that helped identify the top of that wave are telling a very different story.
Seasonality.
Technical analysis.
Relative strength.
Long-term trend structure.
Intermarket relationships.
They're all pointing in the same direction.
This precious metals cycle still appears to have a long way to go. Commodity Supercycle lasts decades not months or years.
That doesn't mean there won't be corrections along the way. There always are.
But the bigger picture remains intact.
The biggest lesson?
Fundamentals tell you what. Technicals and seasonality often help tell you when.
When multiple independent forms of evidence begin telling the same story, that's when you should pay attention.
And right now, the evidence continues to suggest that we're still in the early innings of a much larger precious metals bull market.
#Gold #Silver #PreciousMetals #TechnicalAnalysis #Seasonality #Investing #Trading #Markets #FinancialEducation #ASXTrader #GoldMiningStocks
9
15
170
13,020
🥇 Why Gold Loves Certain Times of the Year
Most people focus on interest rates, inflation, and central bank decisions when analysing gold.
But there's another factor many investors overlook: seasonality.
Looking at decades of historical data reveals that gold often follows a surprisingly consistent annual pattern.
📉 March to June
Traditionally one of the weaker periods for gold. Demand tends to ease after the holiday season, and prices often move sideways or drift lower.
🔄 Early July
This is where things get interesting.
Historically, July has often marked a turning point, with seasonal strength beginning to emerge as jewellery manufacturers start preparing for major global festivals and holiday demand.
📈 August to September
Volatility tends to increase. While strong rallies can occur, September has historically been more mixed and can sometimes see weakness depending on the broader macro environment.
🚀 October to February
The strongest seasonal window for gold.
Physical demand increases across major markets, helping drive what has historically been the largest portion of gold's average annual gains. Seasonal strength often peaks around late February before the cycle resets.
⚠️ A reminder: seasonality is not a prediction tool. It simply shows historical tendencies, not guarantees.
The best traders use seasonality as one piece of the puzzle alongside trend analysis, macroeconomic conditions, and risk management.
Have you ever used seasonality in your investing or trading decisions? 👇
3
29
2,167
1
37
2,364
Looking forward to speaking at the 2026 Gold Coast Investment Showcase!
I'll be taking the stage at 3:00pm on Friday 12 June, sharing the stage with the lovely Kerry Stevenson from Gold Events as we present The Investment Cycle.
If you're attending the conference, come along and say hello. It would be great to meet members of the MtM community and connect with fellow investors.
📍 JW Marriott Gold Coast Resort & Spa
📅 Friday 12 June 2026
🕒 3:00pm
Hopefully see you there!
1
13
2,348
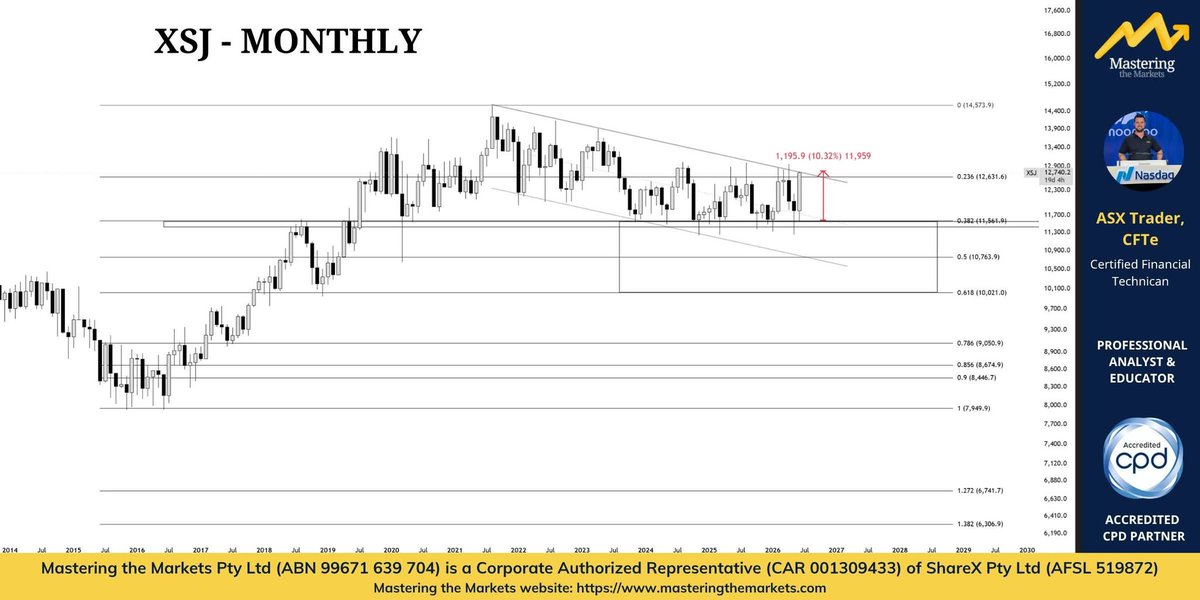
Consumer Staples (XSJ) have been one of the standout sectors this month, already rallying more than 10%.
You've probably noticed Woolworths and Coles breaking above key technical levels, while Metcash has also delivered a strong rebound off the zag zone. The sector is now approaching a major inflection point.
The 13,000 level is the one to watch.
A decisive break above that level would see Consumer Staples break out of a five-year bear channel. What's interesting is how cleanly the sector found support at the 38.2% Fibonacci retracement, which also aligned with a major historical support and resistance zone. From there, price transitioned into an accumulation phase before pushing higher.
Technically, that's a very constructive structure.
The defensive sectors continue to show relative strength, and Consumer Staples remains one of the better-looking areas of the Australian market right now.
For transparency, I still hold significant long positions in names such as Woolworths, with entries from around $26. The trend remains favourable while these recent breakout levels continue to hold.
4
1
29
2,758
Markets are complex things.
They don’t move in straight lines. They zig. They zag.
And that zag usually breaks people in one of two ways.
The first is price - A sharp correction. A fast move down. It happens so quickly that fear takes over and people sell.
The second is time - This is boredom capitulation. Your asset goes sideways for months while everything else seems to be running. You get frustrated. You rotate out. Then, not long after, it finally moves.
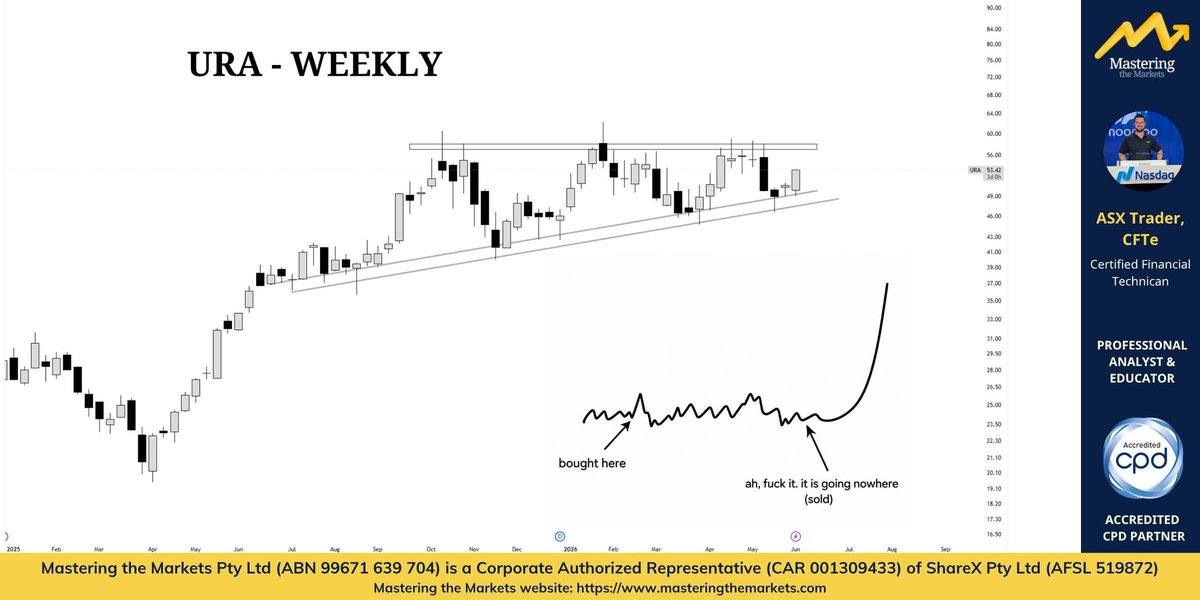
That’s uranium right now.
It has been sitting in a long triangle consolidation for around nine months. Once it clears that overhead resistance, I think we’ll see the rapid impulse move everyone has been waiting for.
So, the real question is simple.
Are you willing to sit and do nothing for a little while longer?
Or are you going to capitulate?
Judging by the sentiment I've seen on socials, plenty of people are already capitulating through time.
That’s why the old Buffett line still hits:
“The stock market is a device for transferring money from the impatient to the patient.”
So, if you know you’re in the right areas, sit on your hands and let the market do the heavy lifting. Not every day is supposed to be a rocket ship.
2
4
78
5,613
David Bird (ASX Trader) B.Ed, CFTe retweeted

Jun 8
One steely blue-chip hiding in plain sight has accumulated strength at the heart of the decade’s most powerful commodity story — a historic milestone may be near, writes ASX Trader. ✍️ READ MORE: bit.ly/43nAV8p

1
1
6
2,293
Nzcryptocon what an event. It was fantastic to be back in New Zealand and see the energy, passion, and growth of the crypto community firsthand.
A huge congratulations to everyone involved in making NZCryptoCon such a success. We were incredibly proud to be the official education partner and to connect with so many people throughout the event.
Given the turnout and enthusiasm, I'm sure it'll be back on the calendar again next year. We'll certainly be looking forward to it.
Now it's time to turn our attention to Sydney dor Auscryptocon for what will likely be tens of thousandsin attendance. We're excited to continue as the official education partner and can't wait to see everyone at AusCryptoCon this November.
See you there!


3
2
16
2,909
David Bird (ASX Trader) B.Ed, CFTe retweeted

Jun 6
✨ Day 1 is well underway, and the energy has been incredible!
From engaging keynote sessions and insightful discussions to meaningful networking and shared learning, today has already delivered valuable moments and inspiring conversations.
A huge thank you to our speakers, partners, and attendees for bringing such enthusiasm and expertise to the event. The connections being made and ideas being exchanged are what make this experience so special.
We're just getting started, and there's plenty more to come. Stay tuned for highlights, key takeaways, and exciting sessions ahead!
3
1
11
2,207
Crypto caution vs technically trending stocks
(ASX:TCL) (ASX:WDS) (ASX:CAR) (ASX:SEK) (ASX:NHC) (ASX:YAL)
Bitcoin seen as weak versus equities, gold and bonds, while select utility altcoins outperform.
Turning to equities, Bird highlights a few stocks he is watching closely at the moment.
ausbiz.com.au/media/crypto-c…
1
20
2,947
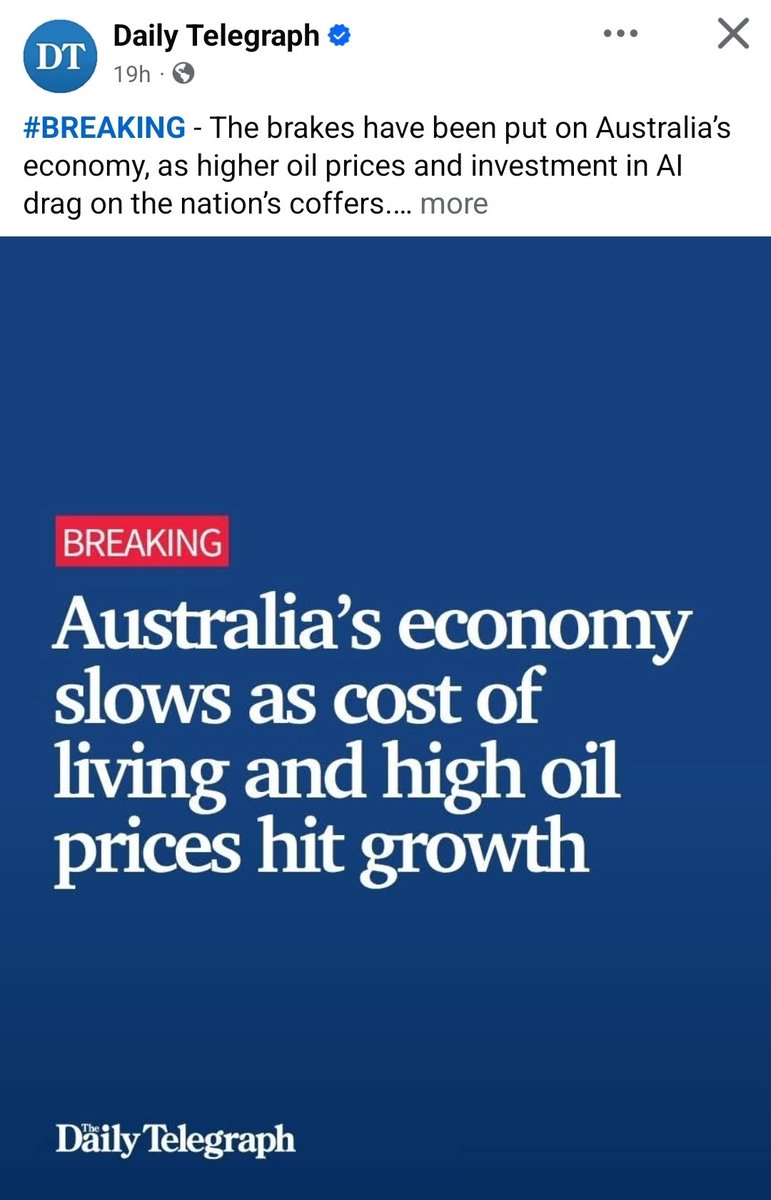
Taken from Daily telegraph yesterday. Charts led the news.
Australia’s economy is officially slowing down, as cost-of-living pressures, surging oil prices and slowing government spending combine for a lacklustre result.
KPMG chief economist Brendan Rynne said the national economy had slowed to a crawl and there was no growth in sight.
Investment Fund VanEck’s head of investment and capital markets Russel Chesler warned slowing growth could lead to stagflation.
“Australia could now well be entering a stagflation regime of low growth and high inflation,” Mr Chesler said.
“GDP is falling while unemployment is rising and inflation is surging.”
Stagflation is the worst possible outcome for an economy as it combines high costs, rising unemployment and little to no growth.
In a press conference following Wednesday’s GDP release treasurer Jim Chalmers was quizzed on Australia’s slowing productivity.
Productivity – which is a measure of the nation’s GDP divided by hours worked- fell by 0.6 per cent over the March quarter.
This effectively means Australians are working more hours and are getting less.
3
1
46
3,783
David Bird (ASX Trader) B.Ed, CFTe retweeted
Jun 1
🚀 NZCryptoCon is THIS SATURDAY. 🚀
The countdown is officially on!
In just a few days, New Zealand's crypto, blockchain, Web3, and digital asset community will come together for a day packed with insights, networking, innovation, and opportunities. Whether you're a seasoned investor, builder, trader, founder, or simply crypto-curious, NZCryptoCon is the place to connect with industry leaders, hear from expert speakers, and discover what's next for the future of digital assets.
- Don't miss your chance to be part of the conversation.
- Meet the people shaping the industry.
- Learn from top minds in crypto and blockchain.
- Expand your network and uncover new opportunities.
Saturday is almost here, have you secured your spot? 🎟️ → bit.ly/40WKlGI
1
6
2,286
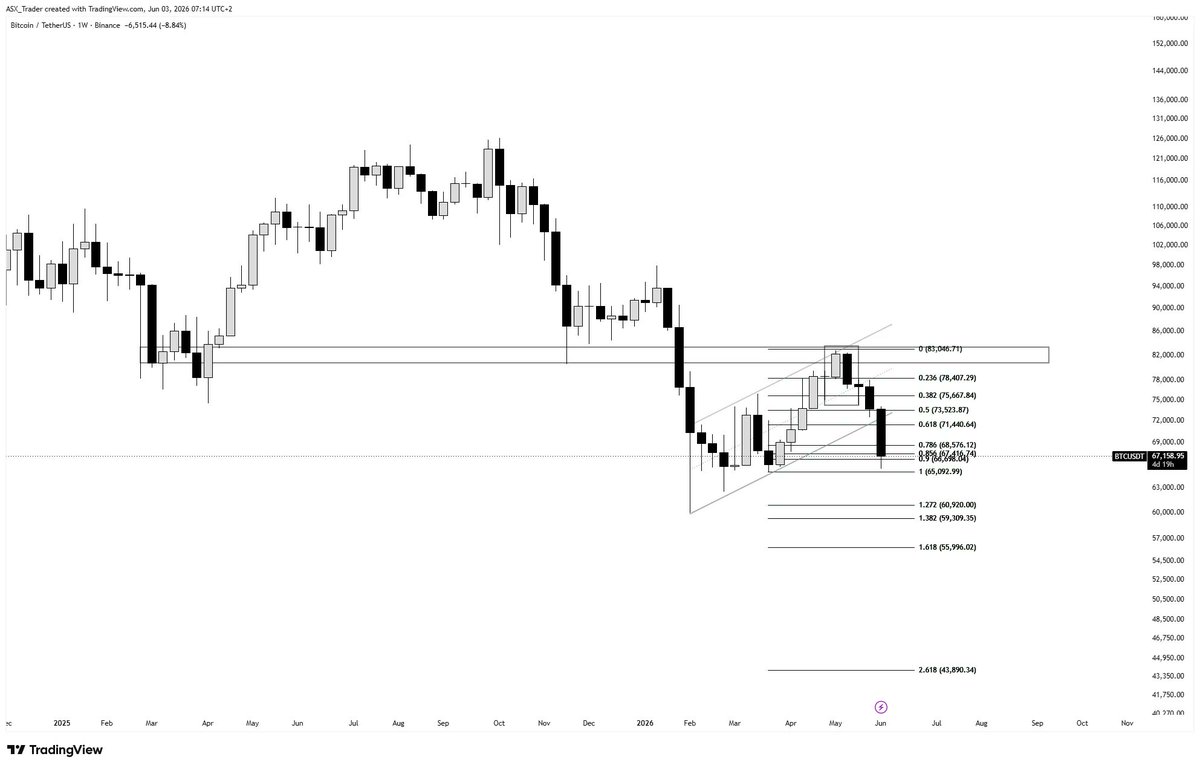
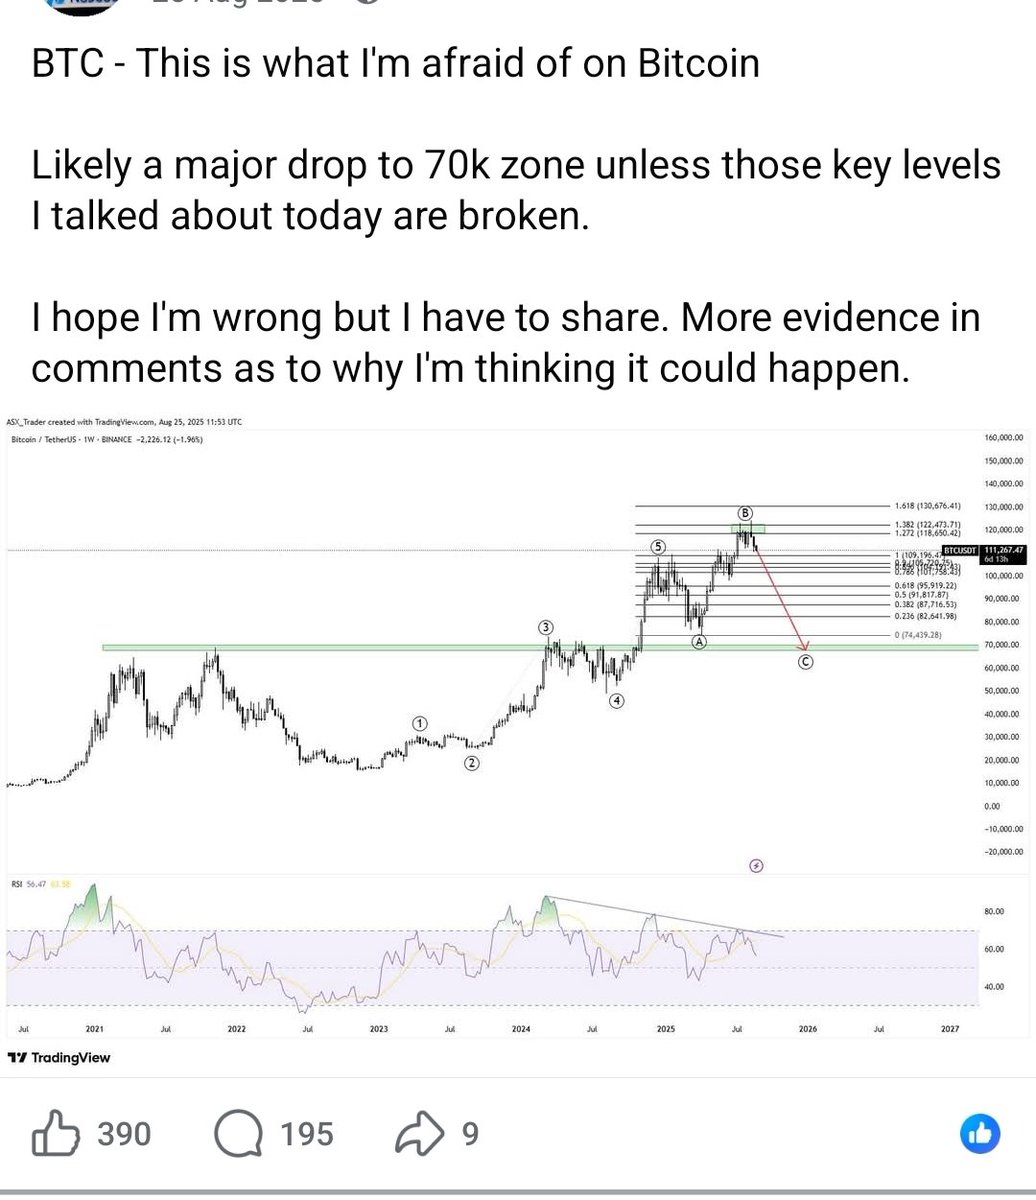
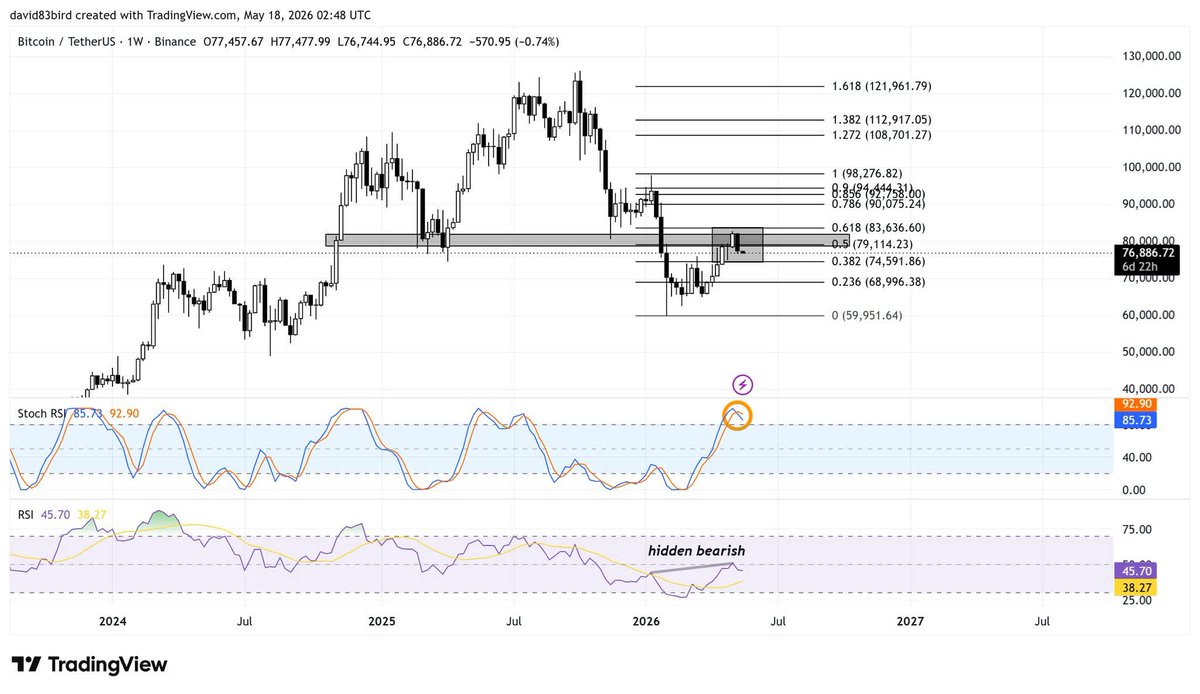
Before and after
BTC downtrend continuation played out.

BTC - Weekly
Still in a clear downtrend. Rejecting major confluence resistance on hidden bearish divergence (continuation) and a bearish cross on STOCHRSI
5
4
38
7,035
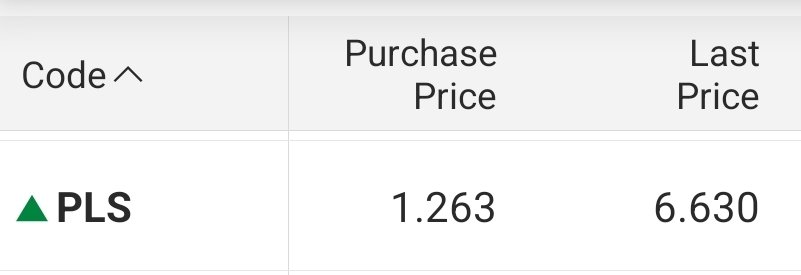
This time last year, I bought Pilbara Minerals (PLS) at $1.26.
Today, it's above $6.
What's interesting isn't the return.
It's that almost nobody wanted lithium when I bought it.
I called the top in lithium and got plenty of criticism.
Then I called the bottom.
Silence.
Nobody wanted to hear about lithium when sentiment was terrible, prices were falling, and the headlines were screaming doom and gloom.
Now everyone tells me they wish they had bought lithium.
That's the lesson.
The biggest opportunities rarely look obvious at the time.
Which is why I'm paying close attention to what's happening right now.
We're entering tax-loss selling season in Australia. Investors sitting on gains often sell their biggest losers before 30 June to offset capital gains tax.
That creates forced selling.
It creates panic.
And on quality companies, it can create capitulation lows.
The surge in volume from tax-loss selling is often the final flush. The point where frustrated investors give up and sell at any price.
For those willing to do the work, that's often where the opportunity begins.
I've been digging through the market looking for the next group of unloved stocks that could be setting up for a turnaround.
I've shared a number of them inside the free Academy, including several that have also been reviewed by our fundamental specialist, Craig Dixon.
If you're looking for opportunities before the crowd finds them, that's where I'd start.
12
1
129
9,899