
I Do Web3 and I Do Me Too || contributor @2golo_ || stacking skills and chasing income in Web3 || DM for collabs.
Joined December 2023
- Tweets 7,430
- Following 1,513
- Followers 1,195
- Likes 34,948
422 Photos and videos


Pinned Tweet

Mar 16
Every strong Web3 project starts the same way: with a community that believes early.
That’s why @kinetic_xyz is launching a Telegram & X Invite Contest hereby giving supporters a chance to help grow the ecosystem while earning rewards.
Here’s what you need to know 🧵

6
3
11
241
AJEE🤴💎 retweeted

Jun 9
There is a question nobody in crypto infrastructure asked for a long time.
Not "𝘩𝘰𝘸 𝘥𝘰 𝘸𝘦 𝘮𝘰𝘷𝘦 𝘢𝘴𝘴𝘦𝘵𝘴 𝘧𝘢𝘴𝘵𝘦𝘳?"
Not "𝘩𝘰𝘸 𝘥𝘰 𝘸𝘦 𝘮𝘢𝘬𝘦 𝘧𝘦𝘦𝘴 𝘤𝘩𝘦𝘢𝘱𝘦𝘳?"
The question nobody asked was this:
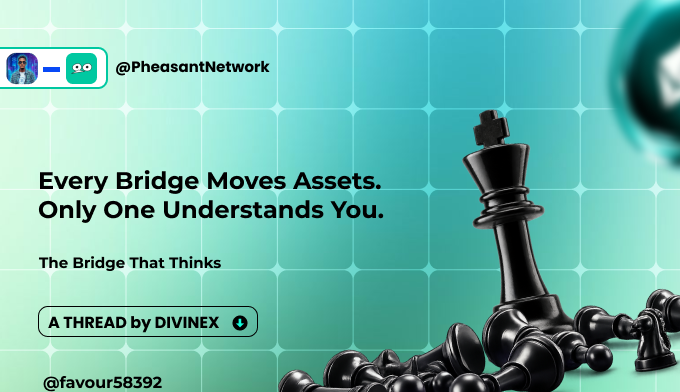
"𝗪𝗵𝗮𝘁 𝗶𝗳 𝘁𝗵𝗲 𝗯𝗿𝗶𝗱𝗴𝗲 𝗰𝗼𝘂𝗹𝗱 𝗷𝘂𝘀𝘁 𝘂𝗻𝗱𝗲𝗿𝘀𝘁𝗮𝗻𝗱 𝘄𝗵𝗮𝘁 𝘁𝗵𝗲 𝘂𝘀𝗲𝗿 𝗶𝘀 𝘁𝗿𝘆𝗶𝗻𝗴 𝘁𝗼 𝗮𝗰𝗵𝗶𝗲𝘃𝗲, 𝗮𝗻𝗱 𝗳𝗶𝗴𝘂𝗿𝗲 𝗼𝘂𝘁 𝘁𝗵𝗲 𝗿𝗲𝘀𝘁 𝗶𝘁𝘀𝗲𝗹𝗳?"
Every bridge built before @PheasantNetwork operates the same way: you tell it exactly what to do, step by step. Which network. Which token. Which route. The bridge executes your instructions. Nothing more.
That is not intelligence. That is a pipe.
Pheasant Network is building something structurally different, a protocol that combines 𝗔𝗜-𝗽𝗼𝘄𝗲𝗿𝗲𝗱 𝗜𝗻𝘁𝗲𝗻𝘁 with 𝗢𝗽𝘁𝗶𝗺𝗶𝘀𝘁𝗶𝗰 𝗜𝗻𝘁𝗲𝗿𝗼𝗽𝗲𝗿𝗮𝗯𝗶𝗹𝗶𝘁𝘆 to create the first cross-chain system that works the way your brain does, not the way a manual does.
The Ethereum Foundation funded it. $200M has already moved through it. And the architecture behind it is unlike anything else running on Ethereum today.
Here is a full breakdown of the two technologies making this possible, and why together they change everything about how blockchains connect.
#PheasantNetwork
13
9
21
389
Jun 9
Touched 1 figures in dollars
Touched 2 figures in dollars
Touched 3 figures in dollars
Touched ⏳
Touched ⏳
6 figures ⏳
7 figures ⏳
How about you?
Jun 9

Touched 1 figures in dollars
Touched 2 figures in dollars
Touched 3 figures in dollars
Touched 4 figures in dollars
Touched 5 figures in dollars
6 figures ⏳
7 figures ⏳
How about you?
1
5
70
AJEE🤴💎 retweeted
Jun 7
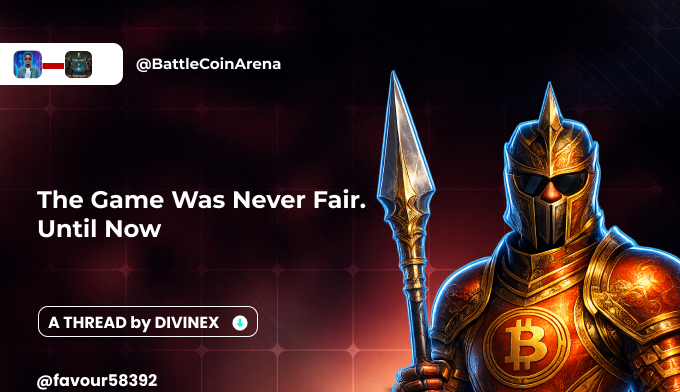
"𝗠𝗼𝘀𝘁 𝗖𝗿𝘆𝗽𝘁𝗼 𝗚𝗮𝗺𝗲𝘀 𝗔𝗿𝗲 𝗥𝗶𝗴𝗴𝗲𝗱. 𝗡𝗼𝘁 𝗕𝗲𝗰𝗮𝘂𝘀𝗲 𝗧𝗵𝗲𝘆 𝗖𝗵𝗲𝗮𝘁 𝗬𝗼𝘂, 𝗕𝗲𝗰𝗮𝘂𝘀𝗲 𝗬𝗼𝘂 𝗖𝗮𝗻 𝗡𝗲𝘃𝗲𝗿 𝗣𝗿𝗼𝘃𝗲 𝗧𝗵𝗲𝘆 𝗗𝗼𝗻'𝘁."
Let that sink in for a second.
Every online casino. Every battle game. Every "provably fair" platform that uses the word fair without showing you the math.
They all have one thing in common: 𝘁𝗵𝗲 𝗿𝗲𝘀𝘂𝗹𝘁 𝗵𝗮𝗽𝗽𝗲𝗻𝘀 𝗼𝗻 𝘁𝗵𝗲𝗶𝗿 𝘀𝗲𝗿𝘃𝗲𝗿. 𝗜𝗻 𝘁𝗵𝗲𝗶𝗿 𝗰𝗼𝗱𝗲. 𝗕𝗲𝗵𝗶𝗻𝗱 𝘁𝗵𝗲𝗶𝗿 𝗰𝗹𝗼𝘀𝗲𝗱 𝗱𝗼𝗼𝗿𝘀. You get a number on your screen and you are supposed to just believe it.
78% of crypto gaming users say they do not trust centralized game outcomes.
And yet, they keep playing. Because there was no alternative.
𝘛𝘩𝘦𝘳𝘦 𝘪𝘴 𝘯𝘰𝘸.
@BattleCoinArena built a battle platform where the result of every single fight is generated on a public blockchain, visible to every person on earth, permanently, the moment it happens. No server. No company deciding your fate. Just open code that anyone can read and nobody can touch.
By the end of this thread you will understand exactly what BCA is, how your money moves, what you earn, and why the first 1,000 people to sign up get something nobody else ever will.
10
7
17
783
AJEE🤴💎 retweeted
Mar 25
The only reason you should go to an irl event in this space is if you’re going for socializing sake(like meet your anon mutuals), or to just have a good time. I don't really believe anyone is dishing out values at those events: it's just the threads and posts they've made on x...

2
3
7
103
AJEE🤴💎 retweeted
Jun 3
How tired can a man be?🥲
How's it going on Active chads?
I think Yesterday was Taco Tuesday, what do we celebrate on Wednesday???😹😹
3
1
6
55
Jun 3
Making it work out is the Plan B✅️
Jun 3

it’s a good morning to talk about $RIVER again after a while..
and a question.. if web3 doesn’t work out the way you hoped, what’s your plan b? 👀

1
3
51
Jun 1
You are just one tweet away from your viral post.
The scary part is you don't know if it's the next one, the 10th one, or the 100th one.
So keep posting. 🥂

You are just one tweet away from your viral post.
The scary part is you don't know if it's the next one, the 10th one, or the 100th one.
So keep posting. 🥂
1
2
29
AJEE🤴💎 retweeted

May 25
today,i learned something that completely changed the way i look at charts..
𝘁𝗵𝗲 𝗺𝗮𝗿𝗸𝗲𝘁 𝗮𝗰𝘁𝘂𝗮𝗹𝗹𝘆 𝗺𝗼𝘃𝗲𝘀 𝗶𝗻 𝘀𝘁𝗿𝘂𝗰𝘁𝘂𝗿𝗲..
waitttt..lemme say something 😹
before now, i used to look at candles and think price was just randomly going up or down..
buh there’s actually a pattern behind those moves..
𝗶𝗻 𝗮𝗻 𝘂𝗽𝘁𝗿𝗲𝗻𝗱, 𝗽𝗿𝗶𝗰𝗲 𝘁𝗲𝗻𝗱𝘀 𝘁𝗼 𝗺𝗮𝗸𝗲:
▪︎ higher highs
▪︎ higher lows
it means price pushes higher, pulls back small, then keeps moving upward without breaking the previous low..
that usually means buyers are still in control..
𝘁𝗵𝗲𝗻 𝗶𝗻 𝗮 𝗱𝗼𝘄𝗻𝘁𝗿𝗲𝗻𝗱, 𝗽𝗿𝗶𝗰𝗲 𝘀𝘁𝗮𝗿𝘁𝘀 𝗺𝗮𝗸𝗶𝗻𝗴:
▪︎ lower highs
▪︎ lower lows
every bounce gets weaker and sellers start taking over,slowly
once you start noticing this stuff, the chart stops looking like noise..
you begin to understand:
▪︎ trend direction
▪︎ momentum
▪︎ when the market is weakening
▪︎ and why some breakouts fail..
still learning this stuff though..and keeping it on here

13
4
32
358
May 20
You will win today
You will win today
You will win today
You will win today
You will win today
You will win today
May 20

You will win today
You will win today
You will win today
You will win today
You will win today
You will win today
2
3
26
AJEE🤴💎 retweeted
May 18
people usually look at markets only from the “price going up” angle
buh stuff like,strong exports,consistent credit ratings,growing industries and rising foreign investments...
those are the kinds of signals that quietly build confidence over time
south korea lowkey looks positioned for long-term growth for real
May 18

THIS COUNTRY IS A HIDDEN GEM!
Here's why we've listed a business from South Korea on 8lends 👇
✅ The Bank of Korea forecasts ~2.0% GDP growth. The country is expected to maintain a large current account surplus (~$170B), supported by exports.
✅ Moody’s rates South Korea at Aa2, which is their third-highest, following Aaa and Aa1. South Korea has held this rating since 2015!
✅ Korean shipbuilders are entering a strong cycle, with profits up ~45%.
✅ In 2025, FDI reached a record high of $36.05 billion, a 4.3% increase from the previous year.
And you're still not investing in this country? It's time to fix this: go.8lends.io/4nTMJZD
Follow us and build with us: @eightlendsKR

10
2
39
449
AJEE🤴💎 retweeted

May 14
Most crypto projects compete for attention.
We’re focused on building something people can actually use.
Real-world utility takes longer.
But it lasts longer too.
#2GOLO
1
1
6
82
May 14
Really realll...

1
26
AJEE🤴💎 retweeted
May 14
to be ballin,yeahhh??
you got to b ~all~in ,eishhh🙂↕️
gumorinn,my neighbours,hehee 😹
how are we making money today??
dae ii of xl
~❤️🔥

43
2
72
738
AJEE🤴💎 retweeted
May 13
one of the biggest hidden problems in web3 right now?
it's getting harder to tell what's actually real..
likes, views, engagement, impressions,
numbers everywhere buhh how much of it is genuinely human??
communities look active, campaigns trend, numbers rise...
but underneath??
bots and sybil activity are quietly distorting everything..
meaningful conversations get buried,reward systems get farmed,
governance gets manipulated..
and with AI accelerating, this only gets harder to detect
because bots can imitate activity buh genuine human presence is much harder to fake
emotion,reputation,authentic interaction,community trust
that's where @bwaveprotocol comes in
focusing not just on wallet activity, buh on distinguishing real humans from automated noise
because bots create numbers,only humans create culture.
8
2
33
994
May 12
...
May 12

if being inconsistent was a felony, i'd probably be in jail 😭
but lately i've been thinking...
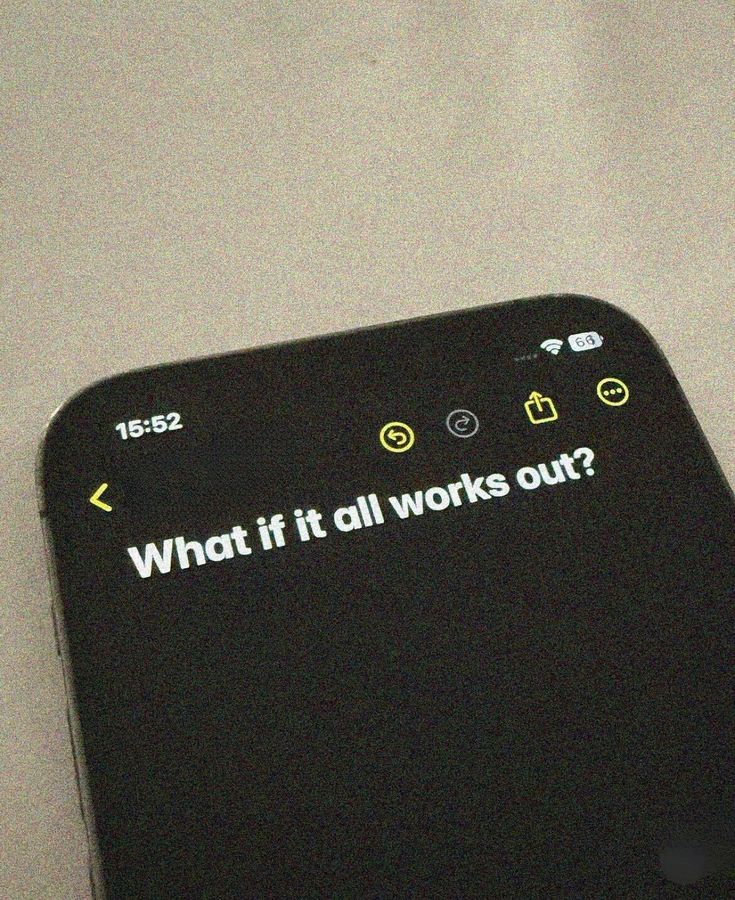
𝘄𝗵𝗮𝘁 𝗶𝗳 i actually leave my shell??
𝘄𝗵𝗮𝘁 𝗶𝗳 i stop overthinking every little thing?
𝘄𝗵𝗮𝘁 𝗶𝗳 i try new things instead of sitting in my comfort zone forever??,eishhhhhh🤦🏾♀️...
𝘄𝗵𝗮𝘁 𝗶𝗳 i fail???
...but then again
𝘄𝗵𝗮𝘁 𝗶𝗳 𝗶 𝗳𝗹𝘆???🌚
what if my life actually changes because i finally decided to show up for myself??
idk mannn...
all i know is,i've decided to let myself live for the next 40 days..
properly this time 😭,so yeah..
i'm starting a 40-day consistency challenge
i'll be documenting everything:
the good, the bad, the rants,the embarrassing, the ugly,all of it..
posts, thoughts, things i'm learning, random experiments, wins, failures..
whatever happens, happens 🌚,I meannn
i don't know if i'll fully pull this off...
buhh let's see where this takes me
one thing i know for sure is,
i refuse to keep being my own downfall
i will be my own saving grace ❤️🔥🙂↔️

1
1
23
May 5
I've been through so much I'm 19 years old, it's been month since I felt at home, but it ain't okay cos I'm broke, psych I'm still sad as a b1tch, right .....🎵🎼🥲
1
2
53
May 5
I know of no better life purpose than to perish in attempting the great and the impossible...

5
15
163
May 5
It's not too much to ask frr😪
May 5

I just want to make money man,
Some 4figs or 5 figs,
It’s not too much to ask 😔😔
6
76