
India First | Investing | FIRE | All Views are Personal | No Buy/Sell Recommendation | DYODD | DM for Collaboration
Joined March 2014
- Tweets 39,917
- Following 600
- Followers 36,222
- Likes 83,184
8,980 Photos and videos


Pinned Tweet

May 28
I’ve started a Telegram channel to share detailed market insights:
▪️ Stock research & sector analysis
▪️ Fundamental analysis & Concall insights
▪️ Technical setups with clean charts
▪️ Data-driven investing thoughts
Join TII Free Telegram 👉
t.me/TheIndianInvestor2
1
6
5,481
Trump says US-Iran deal to be signed on Sunday ☮️
🇺🇸 President Trump has announced that a deal with Iran 🇮🇷 is expected to be signed tomorrow, which could lead to the reopening of the Strait of Hormuz and ease concerns around global energy supplies.
If the agreement materializes as expected, it could reduce geopolitical risk, support lower energy prices, and improve global market sentiment. For Indian equities, which have already shown resilience in recent months, this development may act as an additional positive trigger for the next leg of the bull market.
In my view, this is probably one of the best times to start investing in Indian equites. Historically, some of the biggest wealth creation opportunities have emerged when sentiment begins to improve after a period of uncertainty.
2
2
16
1,861
I’ve started a Telegram channel to share detailed market insights:
• Stock research & sector analysis
• Fundamental analysis & Concall insights
• Technical setups with clean charts
• Data-driven investing thoughts
Join TII Free Telegram 👉
t.me/TheIndianInvestor2
1,787
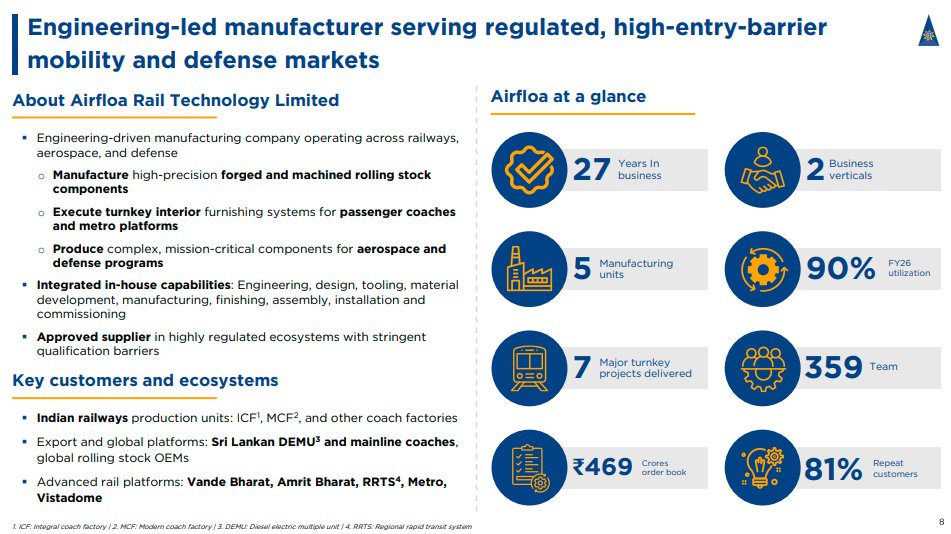
🚆 AIRFLOA RAIL TECHNOLOGY – CONCALL HIGHLIGHTS
1️⃣ Solid Order Visibility
Order book stands strong at ₹486.9 Cr (as of May 2026) with a massive active bid pipeline of ₹1,200 Cr. Historically, the company maintains a healthy bid win ratio of 20–25%.
2️⃣ Near-Term FY27 Guidance
Management has guided for a ₹500 Cr revenue target for FY27, backed by strong execution. PAT margins are expected to land in the 12–13% range.
3️⃣ Long-Term Aspirations Retained
The long-term target remains ₹1,000 Cr in revenue and ₹150 Cr in PAT. While the timeline might shift slightly due to margin-prioritization, management reiterates that the targets are fully achievable.
4️⃣ Margin Discipline > Blind Revenue Growth
Faced with steep raw material inflation (Aluminium up >80%, Stainless Steel up ~60%), the company consciously avoided low-margin contracts. They are actively walking away from unviable bids, prioritizing profitability over chasing numbers.
5️⃣ Massive Coach Refurbishment Play
The Government has sanctioned ₹26,000 Cr to refurbish ~25,000 railway coaches. Airfloa is positioning itself aggressively here, targeting ₹100 Cr worth of orders in FY27 from this segment alone.
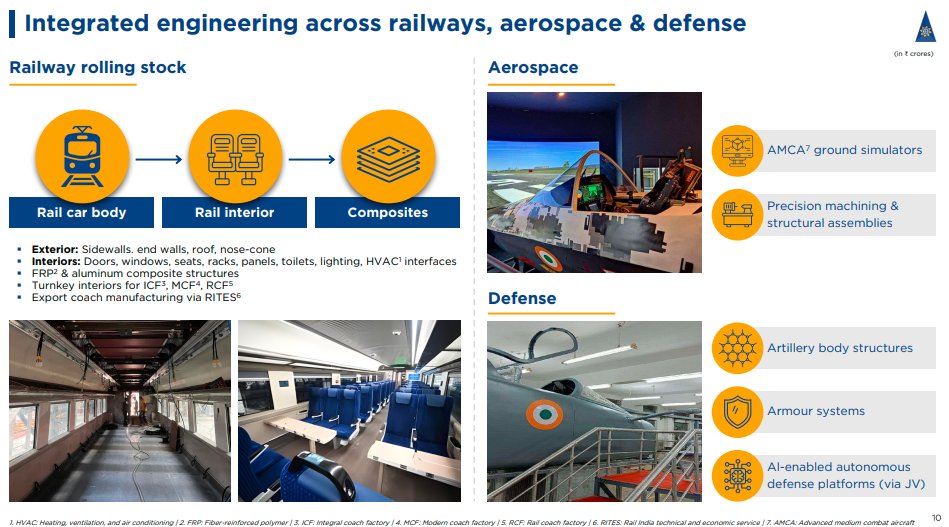
6️⃣ Defence & Aerospace: The Next Growth Engine
FY26 was a foundational year. Airfloa is forming a Joint Venture (JV) with Big Bang Boom Solutions (expected by mid-June 2026) focusing on anti-drone systems, electronic warfare, and lasers. Airfloa will hold the manufacturing rights and commit ₹25 Cr to this JV.
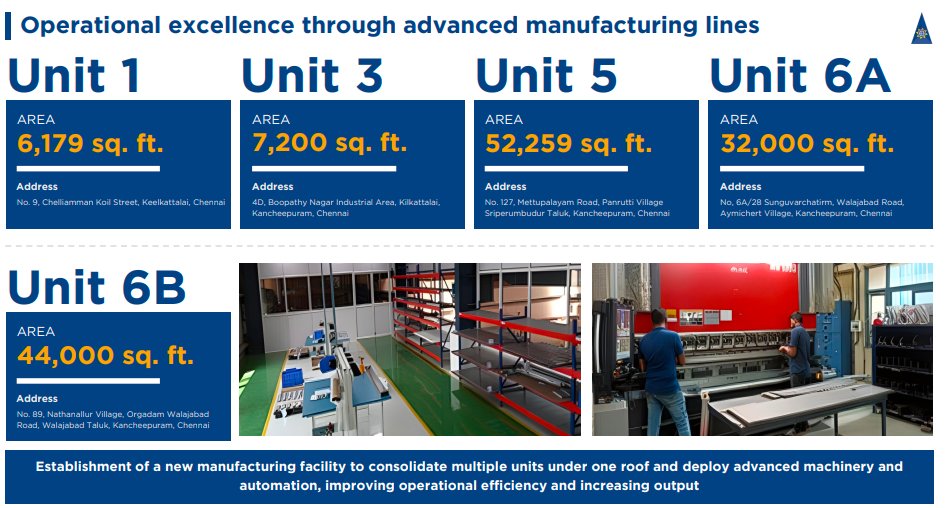
7️⃣ Massive Capacity Doubling & Asset Consolidation
Current facilities are running at ~90% utilization (operating on 2 shifts). The company has secured 14 acres of land to build an integrated campus. This will eventually double capacity and save ₹20–25 lakh/month in rental expenses by consolidating smaller units.
8️⃣ R&D Spend to Double
To build serious technical moats in defense and railways, R&D spend is being ramped up from ~4% to 8–9% of revenue. A significant portion of this will be capitalized on the balance sheet.
9️⃣ Asset-Light Scalability via Channel Partners
Airfloa is moving towards a channel partner model where it handles core manufacturing while regional partners execute projects locally. This sharply reduces fixed infrastructure costs, working capital pressure, and bank guarantee requirements.
🔟 Fully Funded Capex & No Equity Dilution
FY27 Capex is guided at ₹30–40 Cr. Crucially, no equity dilution is planned for FY27. Funding is tied up via a ₹120 Cr debt arrangement (₹60 Cr already sanctioned) at a very competitive interest rate of 8.25%, supplemented by strong internal collections.
🚫 No Recommendation. DYODD.

AIRFLOA RAIL TECHNOLOGY – DETAILED CONCALL HIGHLIGHTS 🧾📑
Airfloa Rail Technology continues to evolve from being a railway component supplier into a much broader engineering, manufacturing and technology-driven platform. Over the last few years, the company has gradually moved up the value chain from supplying individual products to undertaking complete turnkey solutions involving design, manufacturing, supply, installation and commissioning.
The company believes this transformation is strategically important as it enables higher value addition, stronger customer relationships, improved profitability and participation in significantly larger opportunities.
🔸 Today, Railways remain the largest contributor to the business and management continues to remain highly optimistic on the sector's long-term growth prospects.
The opportunity pipeline is being driven by:
▪ Vande Bharat Trains
▪ Vande Bharat Sleeper Trains
▪ Amrit Bharat Trains
▪ Metro Rail Projects
▪ Coach Refurbishment Programs
▪ High-Speed Rail Projects
▪ Regional Transit Projects
▪ Border Modernization Initiatives
According to the company, Indian Railways is entering a multi-year investment cycle where modernization, safety upgrades, refurbishment and indigenous manufacturing will continue to create significant opportunities for specialized players.
🔸 One of the most important opportunities discussed during the call was the railway coach refurbishment program.
The Government has already sanctioned approximately ₹26,000 crore for refurbishment activities covering nearly 25,000 railway coaches. The company believes this could become one of the largest opportunities available within the railway ecosystem over the next few years.
Airfloa has already started positioning itself aggressively in this segment and is targeting approximately ₹100 crore worth of refurbishment orders during FY27 alone.
🔸 Apart from refurbishment, the company is actively pursuing opportunities under Vande Bharat Sleeper, Amrit Bharat and multiple metro rail projects, which together form a significant portion of the future pipeline.
The metro business continues to emerge as another important growth driver.
The company currently has approximately ₹70 crore worth of metro-related orders under execution and is evaluating another ₹120 crore worth of opportunities from the active pipeline.
Management believes increasing investments in urban transportation systems across India will continue creating long-term opportunities for metro rail suppliers.
🔸 Order visibility remains strong.
As of May 2026:
▪ Unexecuted Order Book – ₹486.9 Crore
▪ Active Bid Pipeline – ₹1,200 Crore
▪ Historical Bid Win Ratio – 20–25%
Importantly, nearly ₹900 crore of the active pipeline belongs to the railway segment itself, providing strong visibility for future growth.
The pipeline includes opportunities across:
▪ Vande Bharat Sleeper
▪ Amrit Bharat Projects
▪ Metro Rail
▪ Coach Refurbishment
▪ Kavach Related Opportunities
▪ Regional Transit Systems
▪ Turnkey Railway Projects
Management sounded particularly confident regarding the quality of the order pipeline and believes the company is well-positioned to benefit from India's ongoing railway modernization efforts.
🔸 A major highlight of the concall was the company's continued focus on profitability rather than simply chasing revenue growth.
Over the last year, the industry witnessed sharp inflation in raw material prices.
▪ Aluminium prices increased more than 80%.
▪ Stainless steel prices increased approximately 60–65%.
Since raw materials account for more than 60% of product costs, the impact on profitability was significant.
However, instead of accepting low-margin contracts, the company consciously adopted a disciplined approach.
This included:
▪ Selective bidding.
▪ Price renegotiations.
▪ Supplier optimization.
▪ Advance procurement.
▪ Cost-control measures.
▪ Re-tendering of unattractive projects.
Management clearly stated that they are not willing to sacrifice margins merely to achieve revenue targets.
📌 This disciplined approach is one of the reasons why the timeline for achieving the company's long-term ₹1,000 crore revenue aspiration may shift slightly. However, management reiterated that the target itself remains fully achievable.
🔸 A significant portion of the discussion focused on defence, which management views as the company's next major growth engine.
Management described FY26 as a foundational year for the defence and aerospace vertical. While the contribution remains relatively small today, the focus has been on capability building, technology acquisition and creating the foundation for long-term growth.
A major milestone is the proposed Joint Venture with Big Bang Boom Solutions, which management expects to be incorporated within approximately two weeks and before mid-June 2026.
The JV will focus on:
▪ Autonomous Drones for Defence & Industrial Applications
▪ Electronic Warfare Systems
▪ High-Power Microwave Systems
▪ Laser-Based Defence Technologies
Management clarified that the operating structure is strategically designed where the JV will act as the technology holder, while manufacturing rights for these technologies will be given to Airfloa.
The company plans to invest approximately ₹25 crore into JV-related activities and technology development.
While some revenue contribution may begin during FY27, management repeatedly highlighted that defence is a long-gestation business and should be viewed as a multi-year opportunity.
▪ Management emphasized that defence procurement involves extensive testing, validation and approval cycles, making it a longer-gestation opportunity compared to the railway business.
They described it as a "two-year program" with a more meaningful impact expected across FY27–FY28 as technologies complete validation, testing and procurement cycles.
The company also highlighted opportunities linked to HAL and indicated that defence opportunities worth approximately ₹60–70 crore are currently visible through the HAL ecosystem.
Current defence order book exposure stands at approximately ₹29 crore.
Discussed simulator-related opportunities connected to the AMCA ecosystem and clarified that the opportunity currently relates to simulator systems and training infrastructure rather than the actual aircraft platform.
🔸 Management indicated that research and development spending is expected to increase significantly.
Historically:
▪ R&D Spend – ~4% of Revenue
Going Forward:
▪ Target R&D Spend – 8–9% of Revenue
The increase will primarily support:
▪ New Product Development
▪ Technology Transfers
▪ Defence Technologies
▪ Aerospace Technologies
▪ Electronic Warfare Systems
▪ Autonomous Platforms
An important disclosure made during the call was that management expects a significant portion of this R&D spending to be reflected on the balance sheet, making it an important metric for investors to monitor going forward.
🔸 The company has also established a subsidiary focused on electroluminescent dynamic display boards and flexible electronics.
Management sees applications across:
▪ Railway Display Systems
▪ Commercial Signage Networks
▪ Aerospace Applications
▪ Space Applications
▪ Flexible Electronics
The initiative is being positioned as an additional growth driver outside the current railway and defence businesses.
Management expects commercialization opportunities to emerge during FY27 and clarified that potential revenue from this business is currently not included in existing order book or tender pipeline disclosures.
🔸 Another interesting area discussed was technology development.
The company is currently developing an AI-based railway security platform.
Management clarified that this solution is different from Kavach.
The platform focuses on:
▪ AI-enabled monitoring.
▪ Remote security management.
▪ Railway asset protection.
▪ Advanced surveillance applications.
The company expects demonstrations before Railway Board and RDSO during FY27.
If approved, management believes this could create a completely new technology-led business vertical within the railway ecosystem.
🔸 Capacity utilization was another important discussion point.
Current facilities are operating at approximately:
▪ Capacity Utilization – ~90%
To support growth despite high utilization levels, the company has already implemented a two-shift operating model.
Management indicated that a full year of two-shift operations should significantly increase throughput even before major new manufacturing facilities become operational.
▪ Management further indicated that the upcoming infrastructure project is expected to effectively double the company's existing manufacturing capacity over time, creating additional headroom for future railway and defence opportunities.
The company is also pursuing a channel partner strategy to improve scalability.
Under this model:
▪ Airfloa manufactures products.
▪ Regional partners execute projects locally.
▪ Lower infrastructure investments required.
▪ Reduced working capital burden.
▪ Lower bank guarantee requirements.
▪ Improved profitability.
Management believes this model can help scale the business efficiently towards ₹1,000–2,000 crore revenue levels without proportionately increasing fixed infrastructure costs.
🔸 A major strategic initiative underway is the development of a new integrated manufacturing campus.
The company has already secured:
▪ 14 Acres of Land
Development plans include:
▪ Initial Manufacturing Area – 50,000 to 1,00,000 Sq. Ft.
▪ Long-Term Expansion Potential – 3,00,000 to 4,00,000 Sq. Ft.
The objective is not merely capacity expansion.
Management intends to consolidate multiple smaller facilities into a more integrated manufacturing ecosystem.
Expected benefits include:
▪ Reduced rental expenses.
▪ Better operational efficiency.
▪ Improved manufacturing integration.
▪ Higher productivity.
▪ Better economies of scale.
▪ Management highlighted that the company currently incurs approximately ₹20–25 lakh per month in rental expenses and expects meaningful savings as operations are gradually consolidated into larger owned facilities.
Over time, the company expects to operate primarily through two major manufacturing facilities rather than multiple smaller units.
🔸 To support future growth, Airfloa has outlined significant investment plans.
FY27 Capex Guidance:
▪ ₹30–40 Crore
Infrastructure Development Spend:
▪ ₹30–35 Crore
The investments will primarily support:
▪ Manufacturing Expansion
▪ Defence Capabilities
▪ Product Development
▪ Technology Development
▪ New Facility Construction
Research and Development continues to be a major priority.
The increased spending will focus primarily on:
▪ Defence Technologies
▪ Aerospace Technologies
▪ Electronic Warfare Systems
▪ Autonomous Systems
▪ Advanced Product Development
Management believes these investments are necessary to create technological differentiation and long-term competitive advantages.
Funding plans were also discussed in detail.
The company clarified that:
▪ No equity dilution is planned during FY27.
▪ Debt funding of approximately ₹120 crore is being arranged.
▪ ₹60 crore has already been sanctioned.
▪ Additional ₹60 crore is expected shortly.
▪ Borrowing cost is approximately 8.25%.
Management believes existing cash flows, receivable collections and debt funding will be sufficient to support the company's expansion plans.
🔸 Working capital improvement remains another major focus area.
Management is targeting:
▪ Working Capital Cycle – 60–70 Days
▪ Receivable Cycle – 60–70 Days
▪ Expected Collections by June 2026 – ₹100–110 Crore
The company expects collections and working capital efficiency to improve meaningfully over the next few quarters.
Looking ahead, management remains highly confident regarding FY27.
🔸 Guidance provided includes:
▪ FY27 Revenue Target – ₹500 Crore
▪ FY27 PAT Margin Guidance – 12–13%
The confidence is supported by:
▪ Strong ₹486.9 crore order book.
▪ ₹1,200 crore active pipeline.
▪ Railway modernization opportunities.
▪ Metro expansion opportunities.
▪ Defence diversification.
▪ Manufacturing expansion.
▪ Technology initiatives.
▪ Channel partner model.
Management also reiterated confidence in eventually achieving:
▪ ₹1,000 Crore Revenue
▪ ₹150 Crore PAT
while maintaining profitability discipline and avoiding low-return business.
KEY NUMBERS AT A GLANCE
▪ Order Book (May 2026) – ₹486.9 Crore
▪ Active Bid Pipeline – ₹1,200 Crore
▪ Railway Pipeline – ~₹900 Crore
▪ Metro Pipeline – ~₹120 Crore
▪ Defence Pipeline – ₹60–70 Crore
▪ Current Metro Orders – ~₹70 Crore
▪ Bid Win Ratio – 20–25%
▪ FY27 Revenue Guidance – ₹500 Crore
▪ FY27 PAT Margin Guidance – 12–13%
▪ Long-Term Revenue Aspiration – ₹1,000 Crore
▪ Long-Term PAT Aspiration – ₹150 Crore
▪ Capacity Utilization – ~90%
▪ Land Acquired – 14 Acres
▪ Initial Manufacturing Area – 50,000–1,00,000 Sq. Ft.
▪ Long-Term Expansion Potential – 3,00,000–4,00,000 Sq. Ft.
▪ FY27 Capex – ₹30–40 Crore
▪ Infrastructure Spend – ₹30–35 Crore
▪ Planned Debt Funding – ₹120 Crore
▪ Debt Already Sanctioned – ₹60 Crore
▪ Additional Debt Expected – ₹60 Crore
▪ Interest Rate – 8.25%
▪ R&D Spend FY26 – ~4% of Revenue
▪ R&D Spend Target – 8–9% of Revenue
▪ JV Investment Commitment – ₹25 Crore
▪ Railway Refurbishment Opportunity – ₹26,000 Crore
▪ Refurbishment Scope – ~25,000 Coaches
▪ FY27 Refurbishment Target – ₹100 Crore
▪ Working Capital Target – 60–70 Days
▪ Receivable Cycle Target – 60–70 Days
▪ Expected Collections by June 2026 – ₹100–110 Crore
Disclaimer: This summary is based on management commentary during the conference call and is intended solely for educational purposes. Please conduct your own research before making any investment decisions.

6
16
2,112
The Indian Investor retweeted
AIRFLOA RAIL TECHNOLOGY – DETAILED CONCALL HIGHLIGHTS 🧾📑
Airfloa Rail Technology continues to evolve from being a railway component supplier into a much broader engineering, manufacturing and technology-driven platform. Over the last few years, the company has gradually moved up the value chain from supplying individual products to undertaking complete turnkey solutions involving design, manufacturing, supply, installation and commissioning.
The company believes this transformation is strategically important as it enables higher value addition, stronger customer relationships, improved profitability and participation in significantly larger opportunities.
🔸 Today, Railways remain the largest contributor to the business and management continues to remain highly optimistic on the sector's long-term growth prospects.
The opportunity pipeline is being driven by:
▪ Vande Bharat Trains
▪ Vande Bharat Sleeper Trains
▪ Amrit Bharat Trains
▪ Metro Rail Projects
▪ Coach Refurbishment Programs
▪ High-Speed Rail Projects
▪ Regional Transit Projects
▪ Border Modernization Initiatives
According to the company, Indian Railways is entering a multi-year investment cycle where modernization, safety upgrades, refurbishment and indigenous manufacturing will continue to create significant opportunities for specialized players.
🔸 One of the most important opportunities discussed during the call was the railway coach refurbishment program.
The Government has already sanctioned approximately ₹26,000 crore for refurbishment activities covering nearly 25,000 railway coaches. The company believes this could become one of the largest opportunities available within the railway ecosystem over the next few years.
Airfloa has already started positioning itself aggressively in this segment and is targeting approximately ₹100 crore worth of refurbishment orders during FY27 alone.
🔸 Apart from refurbishment, the company is actively pursuing opportunities under Vande Bharat Sleeper, Amrit Bharat and multiple metro rail projects, which together form a significant portion of the future pipeline.
The metro business continues to emerge as another important growth driver.
The company currently has approximately ₹70 crore worth of metro-related orders under execution and is evaluating another ₹120 crore worth of opportunities from the active pipeline.
Management believes increasing investments in urban transportation systems across India will continue creating long-term opportunities for metro rail suppliers.
🔸 Order visibility remains strong.
As of May 2026:
▪ Unexecuted Order Book – ₹486.9 Crore
▪ Active Bid Pipeline – ₹1,200 Crore
▪ Historical Bid Win Ratio – 20–25%
Importantly, nearly ₹900 crore of the active pipeline belongs to the railway segment itself, providing strong visibility for future growth.
The pipeline includes opportunities across:
▪ Vande Bharat Sleeper
▪ Amrit Bharat Projects
▪ Metro Rail
▪ Coach Refurbishment
▪ Kavach Related Opportunities
▪ Regional Transit Systems
▪ Turnkey Railway Projects
Management sounded particularly confident regarding the quality of the order pipeline and believes the company is well-positioned to benefit from India's ongoing railway modernization efforts.
🔸 A major highlight of the concall was the company's continued focus on profitability rather than simply chasing revenue growth.
Over the last year, the industry witnessed sharp inflation in raw material prices.
▪ Aluminium prices increased more than 80%.
▪ Stainless steel prices increased approximately 60–65%.
Since raw materials account for more than 60% of product costs, the impact on profitability was significant.
However, instead of accepting low-margin contracts, the company consciously adopted a disciplined approach.
This included:
▪ Selective bidding.
▪ Price renegotiations.
▪ Supplier optimization.
▪ Advance procurement.
▪ Cost-control measures.
▪ Re-tendering of unattractive projects.
Management clearly stated that they are not willing to sacrifice margins merely to achieve revenue targets.
📌 This disciplined approach is one of the reasons why the timeline for achieving the company's long-term ₹1,000 crore revenue aspiration may shift slightly. However, management reiterated that the target itself remains fully achievable.
🔸 A significant portion of the discussion focused on defence, which management views as the company's next major growth engine.
Management described FY26 as a foundational year for the defence and aerospace vertical. While the contribution remains relatively small today, the focus has been on capability building, technology acquisition and creating the foundation for long-term growth.
A major milestone is the proposed Joint Venture with Big Bang Boom Solutions, which management expects to be incorporated within approximately two weeks and before mid-June 2026.
The JV will focus on:
▪ Autonomous Drones for Defence & Industrial Applications
▪ Electronic Warfare Systems
▪ High-Power Microwave Systems
▪ Laser-Based Defence Technologies
Management clarified that the operating structure is strategically designed where the JV will act as the technology holder, while manufacturing rights for these technologies will be given to Airfloa.
The company plans to invest approximately ₹25 crore into JV-related activities and technology development.
While some revenue contribution may begin during FY27, management repeatedly highlighted that defence is a long-gestation business and should be viewed as a multi-year opportunity.
▪ Management emphasized that defence procurement involves extensive testing, validation and approval cycles, making it a longer-gestation opportunity compared to the railway business.
They described it as a "two-year program" with a more meaningful impact expected across FY27–FY28 as technologies complete validation, testing and procurement cycles.
The company also highlighted opportunities linked to HAL and indicated that defence opportunities worth approximately ₹60–70 crore are currently visible through the HAL ecosystem.
Current defence order book exposure stands at approximately ₹29 crore.
Discussed simulator-related opportunities connected to the AMCA ecosystem and clarified that the opportunity currently relates to simulator systems and training infrastructure rather than the actual aircraft platform.
🔸 Management indicated that research and development spending is expected to increase significantly.
Historically:
▪ R&D Spend – ~4% of Revenue
Going Forward:
▪ Target R&D Spend – 8–9% of Revenue
The increase will primarily support:
▪ New Product Development
▪ Technology Transfers
▪ Defence Technologies
▪ Aerospace Technologies
▪ Electronic Warfare Systems
▪ Autonomous Platforms
An important disclosure made during the call was that management expects a significant portion of this R&D spending to be reflected on the balance sheet, making it an important metric for investors to monitor going forward.
🔸 The company has also established a subsidiary focused on electroluminescent dynamic display boards and flexible electronics.
Management sees applications across:
▪ Railway Display Systems
▪ Commercial Signage Networks
▪ Aerospace Applications
▪ Space Applications
▪ Flexible Electronics
The initiative is being positioned as an additional growth driver outside the current railway and defence businesses.
Management expects commercialization opportunities to emerge during FY27 and clarified that potential revenue from this business is currently not included in existing order book or tender pipeline disclosures.
🔸 Another interesting area discussed was technology development.
The company is currently developing an AI-based railway security platform.
Management clarified that this solution is different from Kavach.
The platform focuses on:
▪ AI-enabled monitoring.
▪ Remote security management.
▪ Railway asset protection.
▪ Advanced surveillance applications.
The company expects demonstrations before Railway Board and RDSO during FY27.
If approved, management believes this could create a completely new technology-led business vertical within the railway ecosystem.
🔸 Capacity utilization was another important discussion point.
Current facilities are operating at approximately:
▪ Capacity Utilization – ~90%
To support growth despite high utilization levels, the company has already implemented a two-shift operating model.
Management indicated that a full year of two-shift operations should significantly increase throughput even before major new manufacturing facilities become operational.
▪ Management further indicated that the upcoming infrastructure project is expected to effectively double the company's existing manufacturing capacity over time, creating additional headroom for future railway and defence opportunities.
The company is also pursuing a channel partner strategy to improve scalability.
Under this model:
▪ Airfloa manufactures products.
▪ Regional partners execute projects locally.
▪ Lower infrastructure investments required.
▪ Reduced working capital burden.
▪ Lower bank guarantee requirements.
▪ Improved profitability.
Management believes this model can help scale the business efficiently towards ₹1,000–2,000 crore revenue levels without proportionately increasing fixed infrastructure costs.
🔸 A major strategic initiative underway is the development of a new integrated manufacturing campus.
The company has already secured:
▪ 14 Acres of Land
Development plans include:
▪ Initial Manufacturing Area – 50,000 to 1,00,000 Sq. Ft.
▪ Long-Term Expansion Potential – 3,00,000 to 4,00,000 Sq. Ft.
The objective is not merely capacity expansion.
Management intends to consolidate multiple smaller facilities into a more integrated manufacturing ecosystem.
Expected benefits include:
▪ Reduced rental expenses.
▪ Better operational efficiency.
▪ Improved manufacturing integration.
▪ Higher productivity.
▪ Better economies of scale.
▪ Management highlighted that the company currently incurs approximately ₹20–25 lakh per month in rental expenses and expects meaningful savings as operations are gradually consolidated into larger owned facilities.
Over time, the company expects to operate primarily through two major manufacturing facilities rather than multiple smaller units.
🔸 To support future growth, Airfloa has outlined significant investment plans.
FY27 Capex Guidance:
▪ ₹30–40 Crore
Infrastructure Development Spend:
▪ ₹30–35 Crore
The investments will primarily support:
▪ Manufacturing Expansion
▪ Defence Capabilities
▪ Product Development
▪ Technology Development
▪ New Facility Construction
Research and Development continues to be a major priority.
The increased spending will focus primarily on:
▪ Defence Technologies
▪ Aerospace Technologies
▪ Electronic Warfare Systems
▪ Autonomous Systems
▪ Advanced Product Development
Management believes these investments are necessary to create technological differentiation and long-term competitive advantages.
Funding plans were also discussed in detail.
The company clarified that:
▪ No equity dilution is planned during FY27.
▪ Debt funding of approximately ₹120 crore is being arranged.
▪ ₹60 crore has already been sanctioned.
▪ Additional ₹60 crore is expected shortly.
▪ Borrowing cost is approximately 8.25%.
Management believes existing cash flows, receivable collections and debt funding will be sufficient to support the company's expansion plans.
🔸 Working capital improvement remains another major focus area.
Management is targeting:
▪ Working Capital Cycle – 60–70 Days
▪ Receivable Cycle – 60–70 Days
▪ Expected Collections by June 2026 – ₹100–110 Crore
The company expects collections and working capital efficiency to improve meaningfully over the next few quarters.
Looking ahead, management remains highly confident regarding FY27.
🔸 Guidance provided includes:
▪ FY27 Revenue Target – ₹500 Crore
▪ FY27 PAT Margin Guidance – 12–13%
The confidence is supported by:
▪ Strong ₹486.9 crore order book.
▪ ₹1,200 crore active pipeline.
▪ Railway modernization opportunities.
▪ Metro expansion opportunities.
▪ Defence diversification.
▪ Manufacturing expansion.
▪ Technology initiatives.
▪ Channel partner model.
Management also reiterated confidence in eventually achieving:
▪ ₹1,000 Crore Revenue
▪ ₹150 Crore PAT
while maintaining profitability discipline and avoiding low-return business.
KEY NUMBERS AT A GLANCE
▪ Order Book (May 2026) – ₹486.9 Crore
▪ Active Bid Pipeline – ₹1,200 Crore
▪ Railway Pipeline – ~₹900 Crore
▪ Metro Pipeline – ~₹120 Crore
▪ Defence Pipeline – ₹60–70 Crore
▪ Current Metro Orders – ~₹70 Crore
▪ Bid Win Ratio – 20–25%
▪ FY27 Revenue Guidance – ₹500 Crore
▪ FY27 PAT Margin Guidance – 12–13%
▪ Long-Term Revenue Aspiration – ₹1,000 Crore
▪ Long-Term PAT Aspiration – ₹150 Crore
▪ Capacity Utilization – ~90%
▪ Land Acquired – 14 Acres
▪ Initial Manufacturing Area – 50,000–1,00,000 Sq. Ft.
▪ Long-Term Expansion Potential – 3,00,000–4,00,000 Sq. Ft.
▪ FY27 Capex – ₹30–40 Crore
▪ Infrastructure Spend – ₹30–35 Crore
▪ Planned Debt Funding – ₹120 Crore
▪ Debt Already Sanctioned – ₹60 Crore
▪ Additional Debt Expected – ₹60 Crore
▪ Interest Rate – 8.25%
▪ R&D Spend FY26 – ~4% of Revenue
▪ R&D Spend Target – 8–9% of Revenue
▪ JV Investment Commitment – ₹25 Crore
▪ Railway Refurbishment Opportunity – ₹26,000 Crore
▪ Refurbishment Scope – ~25,000 Coaches
▪ FY27 Refurbishment Target – ₹100 Crore
▪ Working Capital Target – 60–70 Days
▪ Receivable Cycle Target – 60–70 Days
▪ Expected Collections by June 2026 – ₹100–110 Crore
Disclaimer: This summary is based on management commentary during the conference call and is intended solely for educational purposes. Please conduct your own research before making any investment decisions.
Jun 9
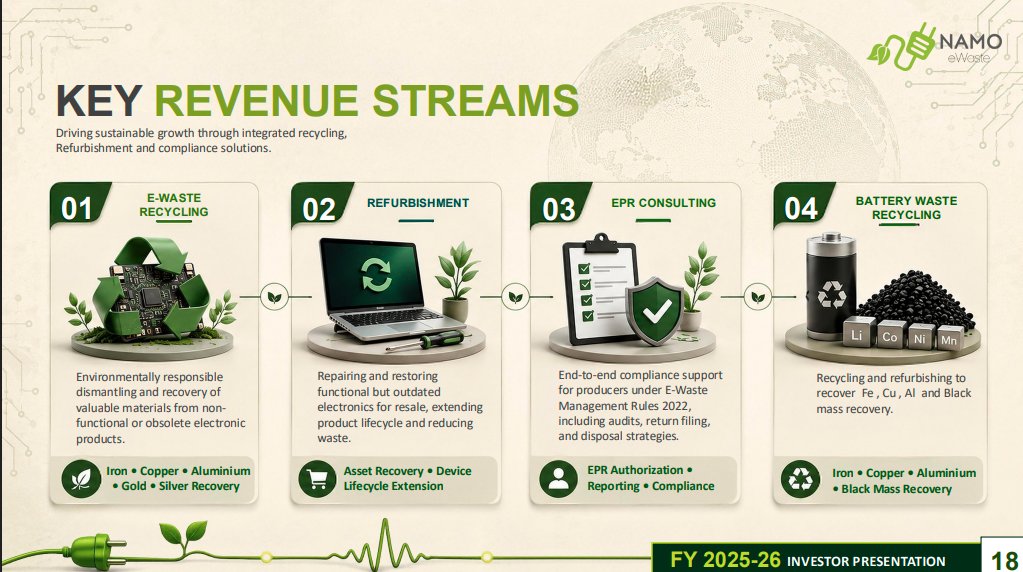
Namo Ewaste – Detailed Concall Highlights & Breakdown 📑🧾
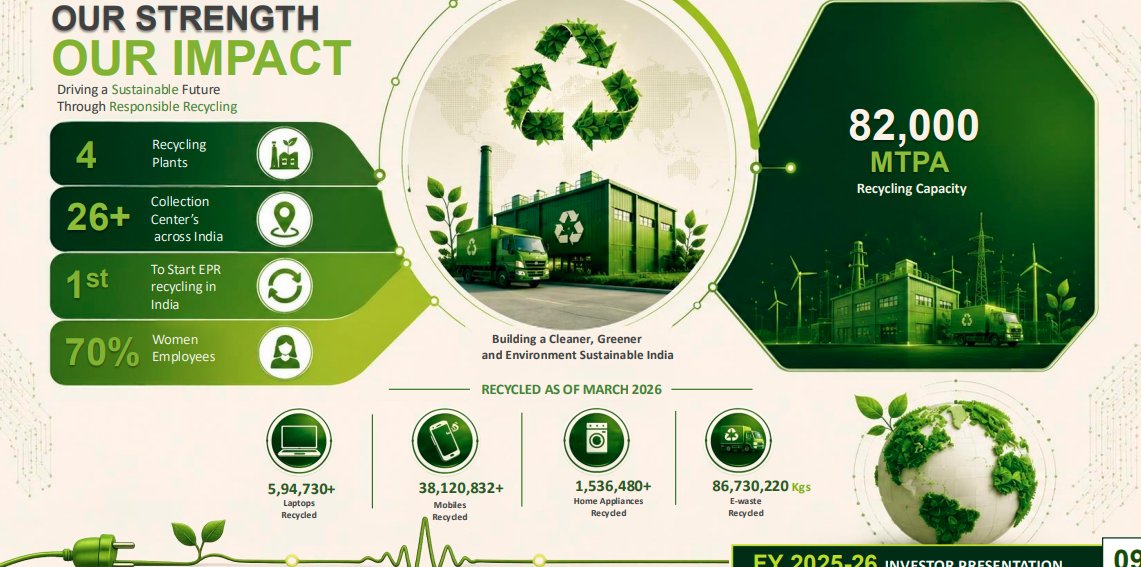
Namo eWaste continues to strengthen its position as one of India's leading organized recyclers, benefiting from the increasing formalization of the e-waste and battery recycling ecosystem. The company believes stricter implementation of recycling regulations, rising EPR compliance, growing EV adoption, increasing electronics consumption and stronger ESG focus are creating a significant long-term opportunity for organized players.
Management highlighted that India generated more than 6 million tonnes of e-waste in FY24 and expects this figure to reach nearly 14 million tonnes by 2030, creating a massive addressable opportunity for the recycling industry.
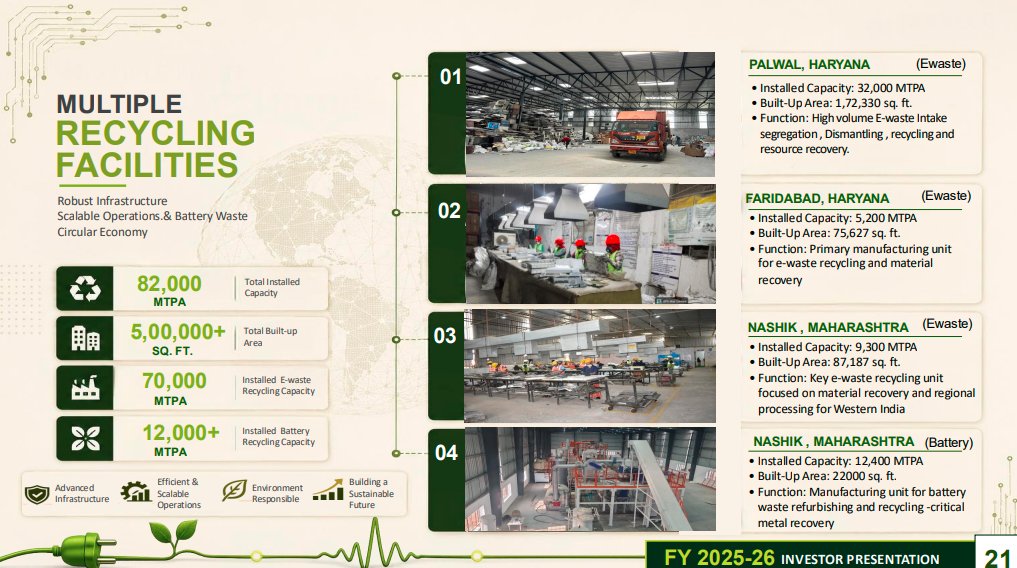
Over the years, the company has built a strong nationwide presence.
Today, Namo eWaste operates through:
▪ 4 Recycling Plants
▪ 26 Collection Centres
▪ 300 Clients
▪ 105 Recycling Categories
📌 As of March 2026, the company has processed more than 86 million kilograms of e-waste, including over 3.8 crore mobile devices and nearly 6 lakh laptops. This scale has helped establish the company as one of the major formal recyclers in India.
🔸 One of the biggest developments during FY26 was the significant expansion of recycling capacity.
The company expanded its total installed recycling capacity to approximately 82,000 metric tonnes per annum.
The current capacity structure is:
▪ E-Waste Recycling Capacity – 70,000 TPA
▪ Battery Recycling Capacity – 12,000 TPA
▪ Total Capacity – 82,000 TPA
Management clarified that the e-waste capacity includes the upcoming Hyderabad facility, which alone contributes approximately 25,000 TPA capacity.
A major growth driver over the coming years will be the Hyderabad facility.
The plant is strategically located within Telangana's electronics manufacturing ecosystem and is expected to significantly improve access to South India's growing electronics, IT and industrial waste streams.
The company expects the Hyderabad facility to become operational in Q2 FY27.
According to management, the facility is particularly important because it will substantially reduce reverse logistics costs currently incurred in transporting material from South India to Northern facilities.
The management team believes this will improve operational efficiency and support margin expansion going forward.
🔸 The company also discussed the utilization profile of its e-waste business.
During FY26, effective e-waste capacity utilization stood at approximately 60%.
Management indicated that despite capacity additions, they would be comfortable operating at around 60–70% utilization over the next year while continuing to grow volumes significantly.
The reason is that the company continues to add new capacities and expand geographically, resulting in a larger capacity base.
Management provided interesting insights regarding revenue potential from existing infrastructure.
For e-waste recycling:
▪ Current Capacity – 70,000 TPA
▪ Revenue Potential at Full Utilization – Approximately ₹500 Crore
▪ Potential Range Depending on Product Mix – ₹500–1,000 Crore
The company highlighted that revenue depends heavily on the type of material processed. Higher-value waste streams such as mobile phones and telecom equipment generate significantly higher realizations compared to white goods and consumer appliances.
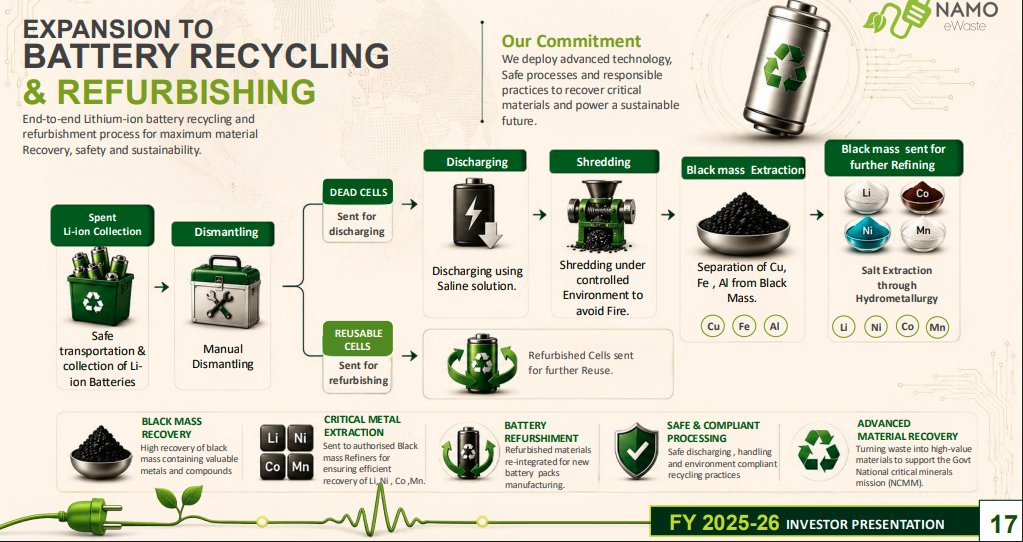
🔸 Battery recycling emerged as one of the most important growth themes discussed during the call.
The Nasik lithium-ion battery recycling and refurbishment facility commenced operations during FY26 and is gradually ramping up.
During FY26:
▪ Battery Recycling Capacity – 12,000 TPA
▪ Battery Processed – ~1,200 Tonnes
▪ Capacity Utilization – ~10%
Management clarified that FY26 was largely a commissioning and customer onboarding year, with operations beginning only around September and OEM empanelments taking time.
The outlook for FY27 is significantly stronger.
The company expects:
▪ Approximately 80% Battery Capacity Utilization
▪ Around 10,000 Tonnes of Battery Processing
▪ Single Shift Operations
Management further clarified that the existing infrastructure is based on a single 8-hour shift. Simply adding additional shifts can substantially increase throughput without major new capacity additions.
Battery recycling economics were discussed extensively.
Management indicated that battery recycling offers superior margins compared to traditional e-waste recycling.
Margin Profile:
▪ E-Waste Gross Margin – 15–18%
▪ Battery Recycling Margin – 20–25%
The company expects battery recycling to become an increasingly important contributor to profitability over the coming years.
Revenue potential from battery recycling is also substantial.
At approximately 90% utilization, management estimates:
▪ Battery Recycling Revenue Potential – ₹250–350 Crore
Depending on battery chemistry, realizations can vary significantly.
▪ NMC Batteries – Higher Realizations
▪ LFP Batteries – Lower Realizations
This creates variability in revenue despite similar processing volumes.
🔸 One of the most important developments discussed during the concall was the company's entry into hydrometallurgy.
Management views hydrometallurgy as the next major growth phase beyond battery crushing and black mass production.
Currently, the company produces black mass from battery recycling.
Going forward, it plans to recover critical metals such as:
▪ Lithium
▪ Cobalt
▪ Nickel
▪ Manganese
This will allow Namo eWaste to move further up the value chain and capture significantly higher economics.
The hydrometallurgy roadmap has two phases.
Phase 1 – Pilot Plant
▪ Capacity – 1 Ton Per Day
▪ Expected Start – December 2026 / January 2027
Phase 2 – Commercial Plant
▪ Capacity – 5 Ton Per Day
▪ Estimated Project Size – ₹60 Crore
▪ Construction Timeline – Approximately 7–8 Months
The pilot facility will help optimize processes, improve recoveries and validate economics before scaling.
📌 Management revealed that the company has already received eligibility under the National Critical Mineral Mission scheme.
The project may benefit from substantial government support.
Potential Subsidy Support:
▪ National Critical Mineral Mission – ~18–20%
▪ State Subsidies – 30–50% (depending on state)
▪ Combined Subsidy Eligibility – Potentially 50–70%
The company is currently evaluating locations and project economics before moving ahead with full-scale implementation.
Regarding funding, management indicated that the preferred route is debt financing.
The company remains debt-free and believes future hydromet investments can comfortably be serviced through operating cash flows and expected profitability.
The economics of hydrometallurgy appear particularly attractive.
Management expects:
▪ Hydromet EBITDA Margins – 25–30%
▪ Additional EPR Revenue on Recovered Critical Metals
This margin profile is substantially higher than traditional e-waste recycling and battery recycling operations.
🔸 The company also discussed black mass economics.
Currently:
▪ Black Mass Selling Price – ₹500–1,000 per kg
▪ Realization Linked to Metal Content
▪ Company Receives More Than 90% Payables on Metal Content
Presently, black mass is sold to domestic refiners such as BatX and Rubamin. However, once the hydromet facility is operational, management expects a significant portion of black mass to be processed internally.
🔸 Management also provided insights into sourcing.
Raw material procurement remains the biggest challenge in the recycling industry.
However, Namo eWaste has built a strong sourcing network over more than a decade.
Key sourcing strengths include:
▪ 12 Years of Industry Presence
▪ Long-Term Contracts
▪ Direct Relationships with OEMs
▪ EV Ecosystem Partnerships
▪ Electronics Manufacturer Relationships
▪ 80–85% Direct B2B Procurement
▪ Only 10–15% Dependence on Aggregators
📌 Management believes this sourcing network represents one of the company's biggest competitive advantages.
🔸 The company also shared the composition of its e-waste procurement.
Current Mix:
▪ IT Equipment – ~30%
▪ Telecom & Mobile Devices – ~15%
▪ Consumer Electronics – Balance
Consumer electronics continue to contribute roughly 50% of overall volumes and remain an important part of the business despite relatively lower margins.
🔸 Another important theme was EPR (Extended Producer Responsibility).
Management stated that EPR realization and compliance have improved considerably over the last year.
Key Highlights:
▪ FY26 EPR Revenue – ~₹25 Crore
▪ FY25 EPR Revenue – ~₹18 Crore
▪ Average EPR Realization – ₹28
Management believes regulatory enforcement and minimum pricing mechanisms are gradually improving industry economics despite some resistance from select producers.
🔸 The refurbishment business also continues to contribute meaningfully.
FY26 Refurbishment Revenue:
▪ Approximately ₹35 Crore
This remains one of the important value-added segments within the overall business model.
📌 Management also outlined its long-term growth aspirations.
The company continues to target strong annual growth while expanding both e-waste and battery recycling operations.
Key Growth Drivers:
▪ Hyderabad Facility Commissioning
▪ Battery Recycling Ramp-Up
▪ Hydrometallurgy Entry
▪ Geographic Expansion
▪ Growing OEM Relationships
▪ Increasing EPR Adoption
▪ Strong EV Ecosystem Growth
▪ Rising Electronics Consumption
Management reiterated its aspiration of achieving approximately 2x growth over the coming 1.5 - 2 years through a combination of organic expansion and new business verticals.
🔸 One of the most important statements during the call related to future scale.
📌 Management indicated that before considering migration to the main board, it would like the company to reach:
▪ Revenue – ₹800–900 Crore
▪ PAT – ₹50 Crore
According to management, this milestone could potentially be achieved over the next 1.5–2 years if current growth plans execute successfully.
On profitability, management maintained a conservative stance.
🔸 While battery recycling and hydrometallurgy are expected to improve profitability, the company remains focused on maintaining sustainable margins.
PAT Margin Guidance:
▪ Expected Range – 7–10%
Management believes maintaining profitability within this range remains achievable over the medium term.
KEY NUMBERS AT A GLANCE
▪ Total Recycling Capacity – 82,000 TPA
▪ E-Waste Capacity – 70,000 TPA
▪ Battery Recycling Capacity – 12,000 TPA
▪ Hyderabad Facility Capacity – 25,000 TPA
▪ E-Waste Capacity Utilization – ~60%
▪ Battery Utilization FY26 – ~10%
▪ Battery Utilization Target FY27 – ~80%
▪ Battery Processed FY26 – ~1,200 Tonnes
▪ Clients Served – 300
▪ Collection Centres – 26
▪ Recycling Categories – 105
▪ E-Waste Recycled Till Date – 86 Million Kg
▪ Mobile Devices Recycled – 3.8 Crore
▪ Laptops Recycled – ~6 Lakh
▪ E-Waste Revenue Potential – ₹500–1,000 Crore
▪ Battery Revenue Potential – ₹250–350 Crore
▪ E-Waste Gross Margin – 15–18%
▪ Battery Margin – 20–25%
▪ Hydromet Margin Potential – 25–30%
▪ Hydromet Pilot Plant – 1 TPD
▪ Hydromet Commercial Plant – 5 TPD
▪ Hydromet Project Size – ~₹60 Crore
▪ Subsidy Eligibility – 50–70%
▪ FY26 EPR Revenue – ~₹25 Crore
▪ FY25 EPR Revenue – ~₹18 Crore
▪ Average EPR Realization – ₹28
▪ FY26 Refurbishment Revenue – ~₹35 Crore
▪ Black Mass Selling Price – ₹500–1,000/kg
▪ Direct B2B Procurement – 80–85%
▪ Aggregator Dependence – 10–15%
▪ Mainboard Aspiration Revenue – ₹800–900 Crore
▪ Mainboard Aspiration PAT – ₹50 Crore
▪ PAT Margin Guidance – 7–10%
Disclaimer: This summary is based on management commentary during the conference call and is intended solely for educational purposes. Please conduct your own research before making any investment decisions.
3
10
39
7,143
The Indian Investor retweeted
Jun 11
📊 Flexi Cap Funds: Smallcap Exposure Growth
▪️ ICICI Pru Flexicap Fund - 8.2%
▪️ Bank of India Flexi Cap Fund - 13.9%
▪️ Invesco India Flexi Cap Fund - 7.7%
▪️ Union Flexi Cap Fund - 11.2%
▪️ HSBC Flexi Cap Fund - 14.0%
▪️ Bandhan Flexi Cap Fund - 4.8%
▪️ PGIM India Flexi Cap Fund - 5.1%
▪️ WOC Flexi Cap Fund - 20.2%
💡 Key Takeaways
▪️ WOC Flexi Cap Fund holds the highest overall smallcap allocation at 28.0%.
▪️ ICICI Pru Flexicap Fund saw the most aggressive strategy shift, more than tripling its allocation from 8.2% to 24.8%
🧠 Bro tip: Instead of investing in a Flexi Cap fund that is aggressively adding small-cap stocks, it is better to choose a dedicated, top-performing Small Cap fund.
🚫 No Recommendation. DYODD.
Jun 10
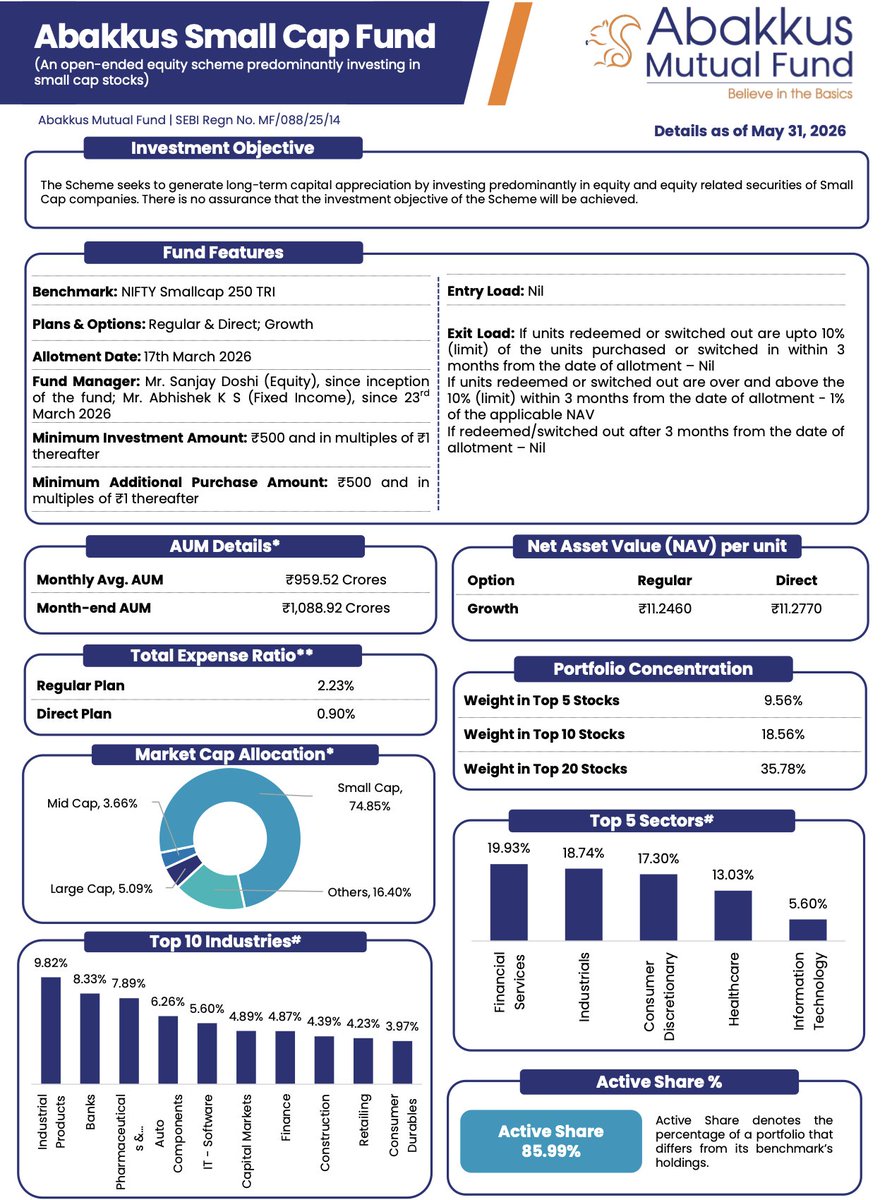
Deep Dive: Analyzing Sunil Singhania's Abakkus Small Cap Fund (May 2026 Factsheet) 📊🔍
Abakkus Small Cap Mutual Fund is bullish on the following stocks with meaningful portfolio allocation in May 2026 👇
Industrial Products
Godawari Power & Ispat Ltd: 1.39%
Inox India Ltd: 1.70%
Jindal Saw Ltd: 1.70%
Kirloskar Oil Engines Ltd: 1.77%
Kirloskar Pneumatic Company Ltd: 1.30%
Welspun Corp Ltd: 1.96%
Pharmaceuticals & Biotechnology
Alembic Pharmaceuticals Ltd: 1.35%
Divi's Laboratories Ltd: 1.08%
Jubilant Pharmova Ltd: 1.42%
Neuland Laboratories Ltd: 1.80%
Sanofi Consumer Healthcare India Ltd: 1.13%
Sanofi India Ltd: 1.11%
Banks
Bank of Baroda: 1.23%
Equitas Small Finance Bank Ltd: 1.74%
HDFC Bank Ltd: 1.23%
Karur Vysya Bank Ltd: 1.72%
RBL Bank Ltd: 1.35%
State Bank of India: 1.06%
Auto Components
Gabriel India Ltd: 1.46%
Sansera Engineering Ltd: 1.77%
Shriram Pistons & Rings Ltd: 1.28%
ZF Commercial Vehicle Control Systems India Ltd: 1.75%
IT - Software
Intellect Design Arena Ltd: 1.35%
Oracle Financial Services Software Ltd: 1.10%
Rategain Travel Technologies Ltd: 1.85%
Tanla Platforms Ltd: 1.30%
Capital Markets
Canara Robeco AMC: 1.40%
CDSL: 1.60%
CAMS: 1.89%
Finance
Edelweiss Financial Services Ltd: 1.30%
IIFL Finance Ltd: 1.82%
PNB Housing Finance Ltd: 1.75%
Construction
Cemindia Projects Ltd: 1.97%
NCC Ltd: 1.33%
PNC Infratech Ltd: 1.09%
Retailing
Arvind Fashions Ltd: 1.63%
Urban Company Ltd: 1.43%
Vedant Fashions Ltd: 1.17%
Consumer Durables
Century Plyboards Ltd: 1.21%
Kajaria Ceramics Ltd: 1.43%
PG Electroplast Ltd: 1.33%
Healthcare Services
Dr Lal PathLabs Ltd: 1.77%
Rainbow Children's Medicare Ltd: 1.65%
Commercial Services & Supplies
International Gemological Institute (IGI): 1.72%
WeWork India Management Ltd: 1.64%
Electrical Equipment
Avalon Technologies Ltd: 1.89%
Emmvee Photovoltaic Power Ltd: 1.12%
Insurance
Star Health Insurance: 1.84%
Healthcare Equipment & Supplies
Q-Line Biotech Ltd: 1.72%
Textiles & Apparels
KPR Mill Ltd: 1.60%
Fertilizers & Agrochemicals
Rallis India Ltd: 1.50%
Chemicals & Petrochemicals
Aether Industries Ltd: 1.49%
Leisure Services
Leela Palaces Hotels & Resorts Ltd: 1.24%
Other Utilities
ION Exchange India Ltd: 1.20%
Industrial Manufacturing
The Anup Engineering Ltd: 1.18%
Transport Services
Container Corporation of India (CONCOR): 0.96%
Diversified Metals
Vedanta Ltd: 0.49%
Aerospace & Defence
Cyient DLM Ltd: 0.34%
Ferrous Metals
Vedanta Iron & Steel Ltd: 0.17%
Power
Talwandi Sabo Power Ltd: 0.17%
Non-Ferrous Metals
Vedanta Aluminium Metal Ltd: 0.17%
Oil
Malco Energy Ltd: 0.17%
Cash & Cash Equivalents
Cash & Cash Equivalents: 13.88%
Commercial Paper: 1.84%
Total Cash & Liquid Allocation: 15.72%
When tracking institutional smart money, the full factsheet reveals exactly how a veteran fund manager balances conviction, diversification, and risk management.
Fund Operations & Key Metrics
Month-end AUM: ₹1,088.92 Crores
Monthly Average AUM: ₹959.52 Crores
Active Share: 85.99%
Total Number of Stocks: 62
Analysis Takeaway:
An Active Share of nearly 86% indicates a highly active, high-conviction portfolio that differs significantly from the benchmark and reflects genuine stock-picking ability.
Market Cap Allocation
Small Cap: 74.85%
Mid Cap: 3.66%
Large Cap: 5.09%
Others (Cash & Equivalents): 16.40%
Analysis Takeaway:
The fund remains highly committed to its small-cap mandate while maintaining enough liquidity to capitalize on future opportunities.
Top Sectoral Allocation
Financial Services: 19.93%
Industrials: 18.74%
Consumer Discretionary: 17.30%
Healthcare: 13.03%
Information Technology: 5.60%
The portfolio clearly reflects a strong preference towards manufacturing, industrial growth, financialization, healthcare, and technology-led themes.
Portfolio Concentration
Top 5 Stocks: 9.56%
Top 10 Stocks: 18.56%
Top 20 Stocks: 35.78%
The portfolio remains well diversified despite being conviction-driven.
Why Has The Cash Allocation Fallen Sharply? 🔍
The most interesting development in this month's factsheet is the sharp decline in cash allocation.
April 2026 Cash Allocation: 24.57%
May 2026 Cash Allocation: 16.40%
At first glance, 16.40% cash may still appear elevated. However, context matters.
The fund was launched only on March 17, 2026. Deploying more than ₹1,000 Crores into small-cap companies overnight is practically impossible without creating impact costs and pushing stock prices higher.
As a result, fund managers typically deploy capital gradually while building positions in their highest-conviction ideas.
The latest factsheet clearly shows that this deployment process is underway.
Small-cap allocation has increased from 67.14% to 74.85%, while cash allocation has declined from 24.57% to 16.40%.
This suggests that Abakkus is actively accumulating positions across its preferred businesses and converting idle cash into productive equity exposure.
For investors tracking institutional smart money, this remains a fascinating portfolio to monitor because a large institutional buyer is still actively building positions in many of these companies.
Disclaimer: For educational and study purposes only. Data sourced from Abakkus Small Cap Fund Factsheet dated May 31, 2026.


2
3
24
4,350
The Indian Investor retweeted
Jun 12
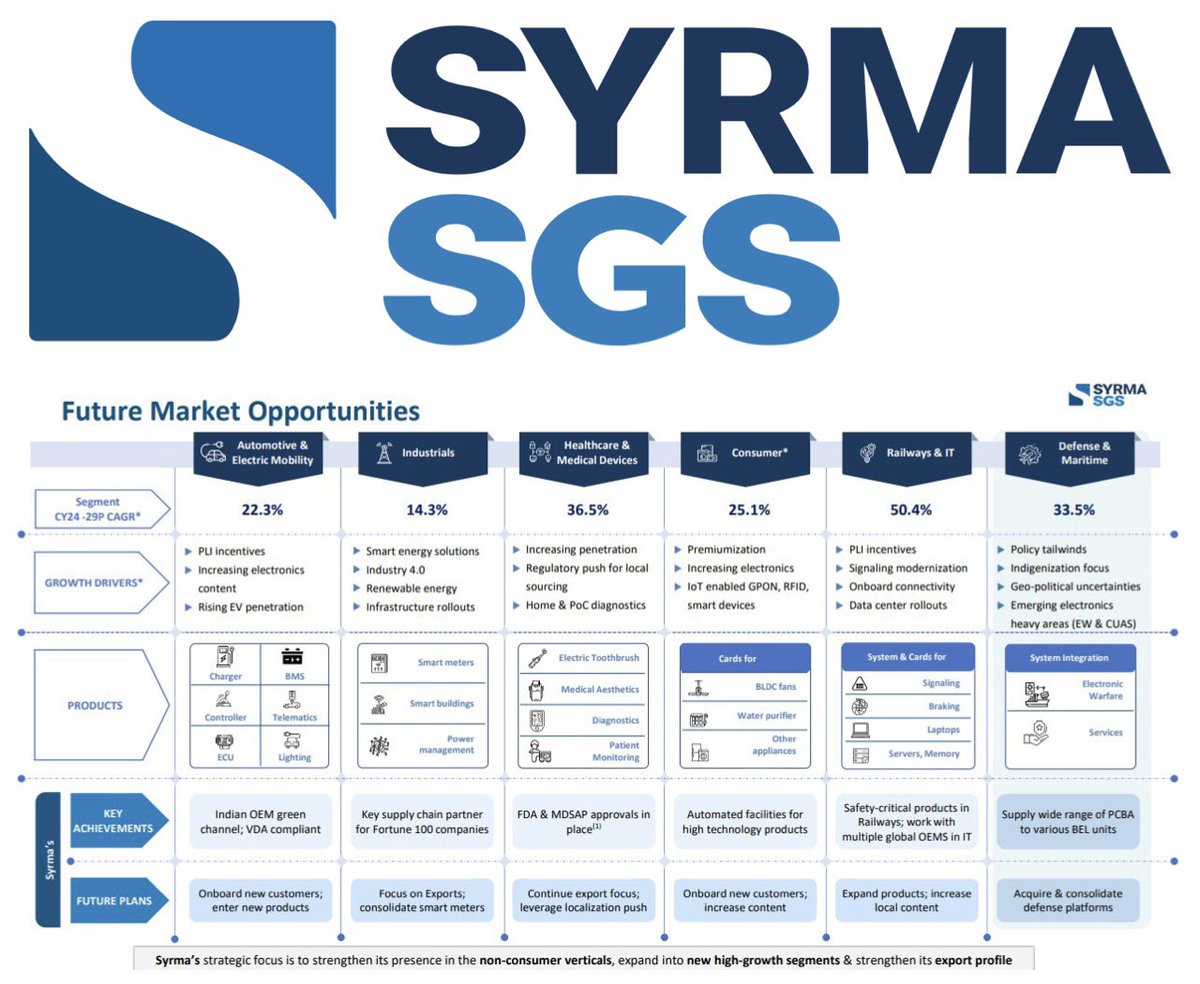
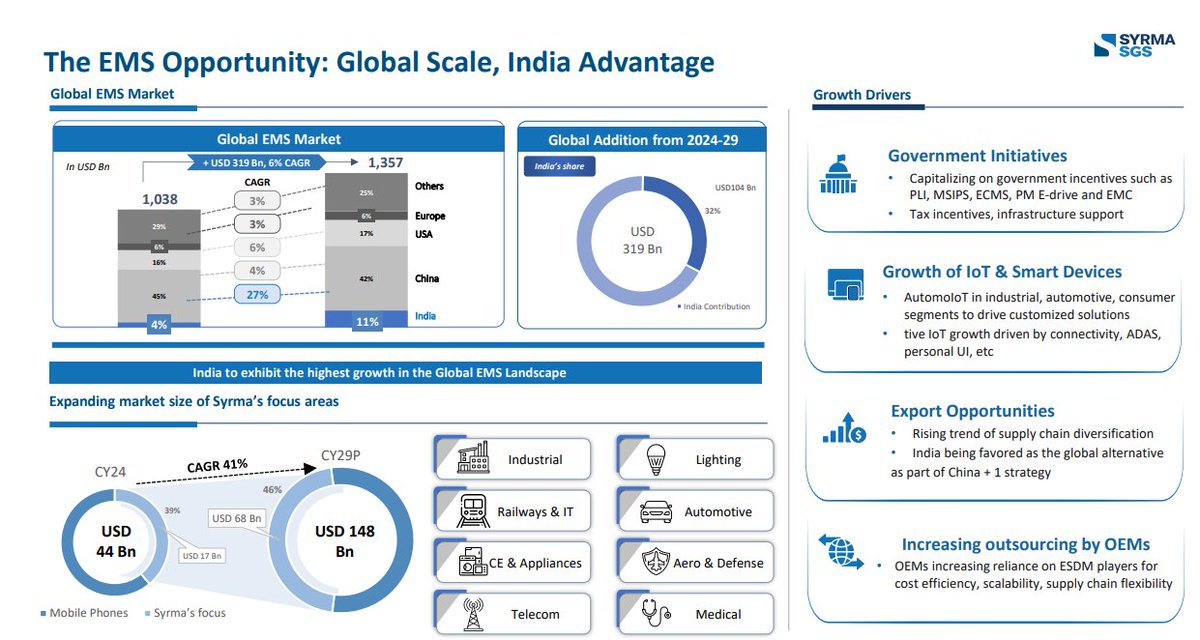
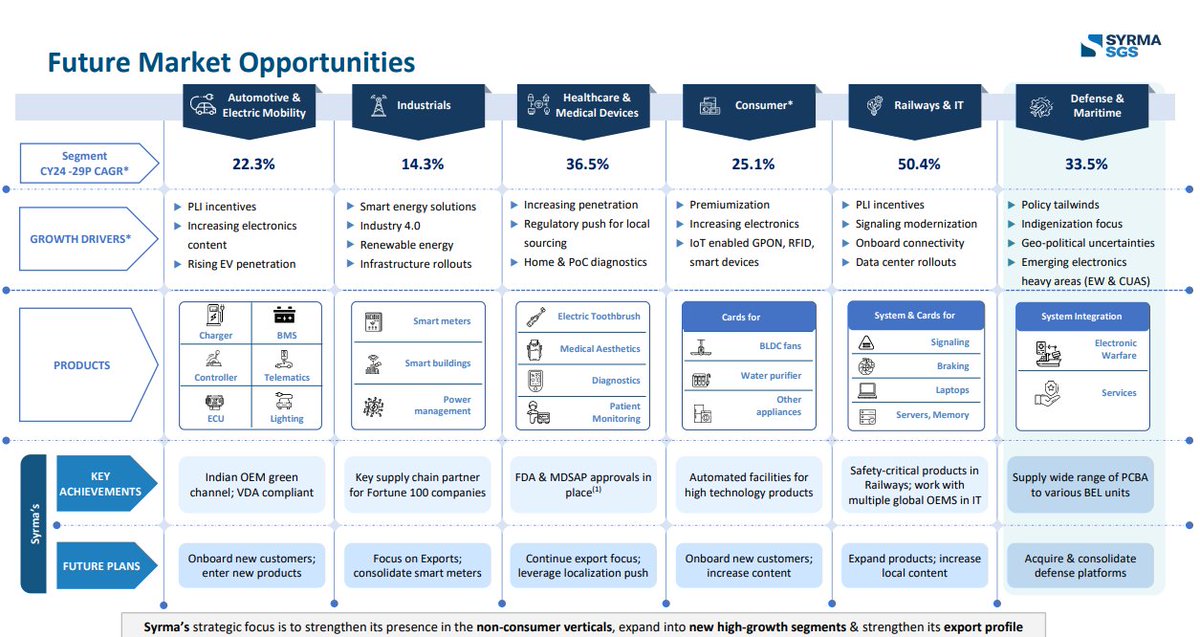
🖥️ Syrma SGS: Charging Up for the Global Electronics Supercycle 🔥
📊 Global & Indian EMS Boom
▪️ Trillion-Dollar Market: The global Electronic Manufacturing Services (EMS) market is projected to skyrocket from USD 1.04 trillion (CY24) to USD 1.36 trillion (CY29).
▪️ India's Massive Leap: India is set to be the fastest-growing geography globally with a 27% CAGR, expanding its global market share from 4% to 11%.
▪️ The $104 Billion Opportunity: India is poised to capture ~32% (USD 104 billion) of the incremental USD 319 billion global EMS growth.
🎯 Syrma SGS: Hyper-Growth Segments
▪️ Massive Addressable Market: Syrma’s specific focus segments are set to expand from USD 44 billion to USD 148 billion by CY29 - a staggering 41% CAGR.
▪️ Shift to High-Margins: Management is pivotally shifting away from commoditized segments toward high-barrier, sticky, and higher-margin sectors like Automotive/EV, Medical, Defense, and Aerospace.
▪️ Railways Leading the Pack: Railways and IT represent the fastest-growing target segment for Syrma, boasting a massive 50.4% CAGR driven by signaling modernization and localization.
▪️ High-Yield Medical Tech: Armed with FDA and MDSAP approvals, Syrma is executing an export-oriented strategy for medical devices (diagnostics, aesthetics), which command superior margins.
💼 Underappreciated Tailwinds & Exports
▪️ Hidden Defense Potential: Syrma's defense footprint is highly underappreciated; it already supplies PCBAs to defense programs and is set to ride the wave of indigenization, electronic warfare, and counter-UAS systems.
▪️ China 1 Beneficiary: As a diversified electronics manufacturing platform, Syrma is perfectly positioned to disproportionately gain from global supply chain diversification and OEM outsourcing.
▪️ Structural Evolution: Syrma is successfully transitioning from a traditional EMS player into a premium, diversified technology platform backed by export tailwinds and PLI incentives.
🚫 No Recommendation
Jun 12

Syrma SGS - EMS, China 1, and Electronic Manufacturing Boom
Global EMS market expected to grow from USD 1.04 trillion (CY24) to USD 1.36 trillion (CY29).
India's share expected to rise from 4% to 11%, the fastest-growing geography globally with 27% CAGR. India could contribute ~USD 104 billion (~32%) of the incremental USD 319 billion global EMS opportunity.
👉EMS players with export capabilities and diversified manufacturing footprints stand to gain disproportionately
Syrma's Addressable Market
Syrma's focus segments expected to expand from USD 44 billion (CY24) to USD 148 billion (CY29) implying a 41% CAGR. This indicates the company is targeting some of the fastest-growing electronics categories rather than competing in commoditized segments.
Strategic Shift towards High-margin Segments
Management is increasingly focusing on:
=> Automotive & EV
=> Industrial electronics
=> Medical devices
=> Railways & IT
=> Defense & Aerospace
=> Telecom
These segments offer higher entry barriers, longer product cycles, better margins, sticky customers and lower competitive intensity.
Target Segment - CY24-29 CAGR
=> Railways & IT: 50.4%
=> Healthcare & Medical: 36.5%
=> Defense & Maritime: 33.5%
=> Consumer: 25.1%
=> Automotive & EV: 22.3%
=> Industrial: 14.3%
Railways appear particularly attractive due to signaling modernization, onboard connectivity, data center infrastructure and increasing localization requirements
Defense Opportunity Still Underappreciated
Syrma already supplies PCBAs to multiple defense programs.
Growth drivers' indigenization push, import substitution, electronic warfare systems, counter-UAS system and rising defence electronics spending.
Medical Devices - Key Insights
=> FDA and MDSAP approvals already in place.
=> Export-oriented strategy.
=> Products include diagnostics, patient monitoring, electric toothbrushes and medical aesthetics.
👉Medical electronics typically command superior margins compared with traditional EMS businesses.
Export Story Remains Intact
Key tailwinds:
China 1 strategy
Global supply-chain diversification
OEM outsourcing trends
PLI incentive
Syrma is transitioning from a traditional EMS player into a diversified electronics manufacturing platform focused on Automotive, Railways, Medical and Defense.
Disclaimer: This post is for informational and educational purposes only.
@vishan_29 @Anvith_ @TrendSpark420 @InvestmentVeda @Dynamicinvstr @Saurabh_TyagiX
13
44
4,851
Jun 13
🏗️ Ashapura Minechem Limited | Q4 & FY26 Concall Highlights 📊
▪️ Blockbuster Financial Performance:
FY26 recorded the best year in the company’s history. Full-year consolidated revenue jumped 91% YoY to ₹5,237 crore. EBITDA surged to ₹674 crore, and PBT rose to ₹450 crore.
▪️ Spectacular Q4 Revenue Spike:
Q4 FY26 consolidated revenue stood at ₹1,969 crore, marking a massive 105% growth quarter-on-quarter (QoQ) compared to ₹960 crore in Q3 FY26.
▪️ Guinea as the Mega Growth Engine:
The Guinea bauxite operations were the primary growth driver for the company, contributing a staggering ₹4,200 crore to the total revenue and ₹561 crore to the consolidated EBITDA.
▪️ Bauxite Volume Surged:
Bauxite export volumes from Guinea nearly doubled to 8 million tons in FY26 (up from 3.5 million tons in FY25). Management has guided an aggressive target of 10–12 million tons for FY27, eyeing 15 million tons by FY28.
▪️ Near-Term Margin Headwinds:
Intense ocean freight inflation, higher fuel costs, and LME-linked Guinea taxes squeezed margins in Q4, compressing the bauxite EBITDA to $5.9 per ton. Management expects Q1 FY27 margins to remain under similar pressure before recovering later in the year.
▪️ Long-Term Freight Hedging:
To tackle spot freight volatility, the company benefited from long-term freight commitments with select shipping lines. Management is actively negotiating more long-term freight contracts to safeguard future margins.
▪️ Game-Changing Quota System Moat:
The upcoming Guinea government bauxite quota system will primarily cap ultra-large players. Combined with a 3-to-5-year freeze on new mining licenses, this acts as a powerful structural moat for established players like Ashapura.
▪️ Strategic Tax Shield Advantage:
Management confirmed that the company will enjoy a minimal to zero income tax bracket in Guinea for the next 1–2 years due to investment recovery clauses. Indian operations also have negligible tax outgo, maximizing free cash flow.
▪️ Massive India Expansion & Capex:
Ashapura is executing a ₹150 crore capex for its Indian operations over the next year. It also secured 7 new bentonite leases in Q4, securing backward integration for its dominant domestic position (35% market share, >40% export share).
▪️ Foraying into Iron Ore Value-Add:
The company is aggressively scaling its iron ore business. Over the next 3–4 quarters, it will establish a beneficiation plant to upgrade lower-grade ore to an export-ready 60% Fe grade, prioritizing direct commercialization before moving to pelletization.
▪️ Shareholder Reward:
Reflecting management's long-term business confidence, the board has recommended a 100% dividend for FY26.
🚫 No Recommendation. DYODD.
2
3
28
2,840
Jun 13
✈️ AFCOM HOLDINGS - H2 / FY26 CONCALL HIGHLIGHTS 📊
▪️ Stellar Financials (FY26):
Full-year Revenue jumped a massive 143.86% YoY to ₹587.72 Cr. Full-year PAT expanded exponentially by 230.05% YoY to ₹121.90 Cr, driven by robust volume growth.
▪️ Blockbuster Q4 Performance:
Q4 Revenue crossed ₹191.88 Cr (up 87.80% YoY), showing significant acceleration in the final quarter of the fiscal year.
▪️ Margin & EPS Expansion:
EBITDA margins improved dramatically to 40.52% for the full year. Annual EPS scaled to ₹48.65, reflecting strong bottom-line translation.
▪️ Aggressive Growth Guidance: Management has given a highly confident outlook for FY27, expecting next year's revenue to be "much more than double" the FY26 figures.
▪️ Massive Capacity Multiplier:
The company is introducing Boeing 777 wide-body aircraft to the fleet (the first one to be operational by Q4 FY27). Conservatively, a single wide-body 777 generates 3x the revenue of a narrow-body 737.
▪️ Fleet Timeline Visible:
The 4th and 5th narrow-body aircraft will operationalize before next quarter. The entire fleet of 9 aircraft is fully on track to be up and running by mid-calendar year 2027.
▪️ Growth Fully Funded:
The company is sufficiently funded for its immediate and wide-body expansion plans via recent fundraises (including a preferential issue and QIP closure in May 2026). No further fundraising is required.
▪️ Geopolitical Tailwind & Yields: Heightened geopolitical demand in the Middle East led to a surge in Q4 charters (415 out of 602 total trips). This tighter capacity pushed Q4 average yields up to $2.72 per kg (vs. $2.54 for the full year).
▪️ Full Margin Insulation:
Operating margins are highly protected from crude volatility. 100% of fuel price hikes are passed directly to customers via a dynamic fuel surcharge mechanism.
▪️ Strategic Network Firsts:
Afcom has successfully entered high-yield routes across Australia, the Pacific region, and the Middle East. Additionally, it will be the very first cargo airline to land at the upcoming Noida International Airport.
🚫 No Recommendation. DYODD.
May 3
Quality SME Stocks with Positive Operating Cash Flow (OCF) to Study and Research 🔥📊📖
Oriana Power
Bondada Engineering
Alpex Solar
Supreme Power
Afcom Holdings
V-Marc India
Sacheerome
TAC Infosec
KP Green Engineering
Msafe Equipments
Neetu Yoshi
Yash Highvoltage
OBSC Perfection
Systematic Industries
Influx Healthtech
Vivid Electromech
Grand Continent Hotels
RNFI Services
Accent Microcell
APS
PNGS Gargi
Systango Technologies
Remus Pharma
Tejas Cargo
Supershakti Metaliks
ABS Marine
Shri Ahimsa Naturals
Virtual Galaxy
Virtuoso Optoelectronics
Safe Enterprises
Goel Construction
MOS Utility
Swaraj Suiting
Sadhav Shipping
Neptune Petrochemicals
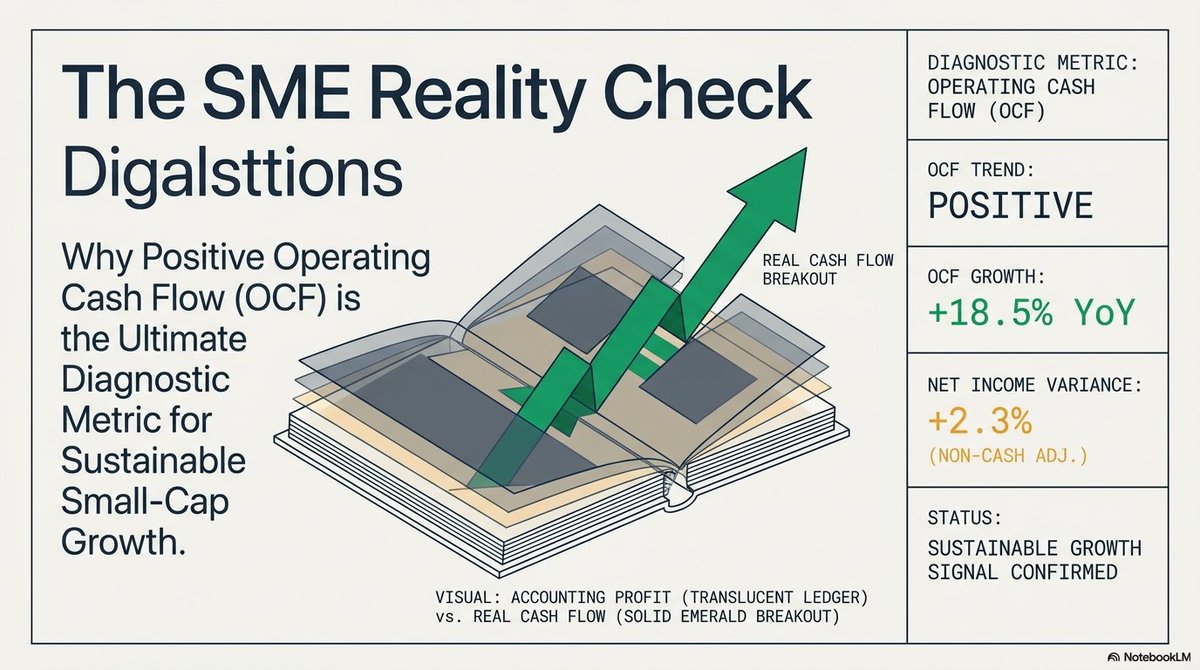
Why Positive Operating Cash Flow (OCF) Matters in SME Companies
In SME companies, operating cash flow is one of the most critical parameters to track because it reflects the real cash generated from the core business, not just accounting profits.
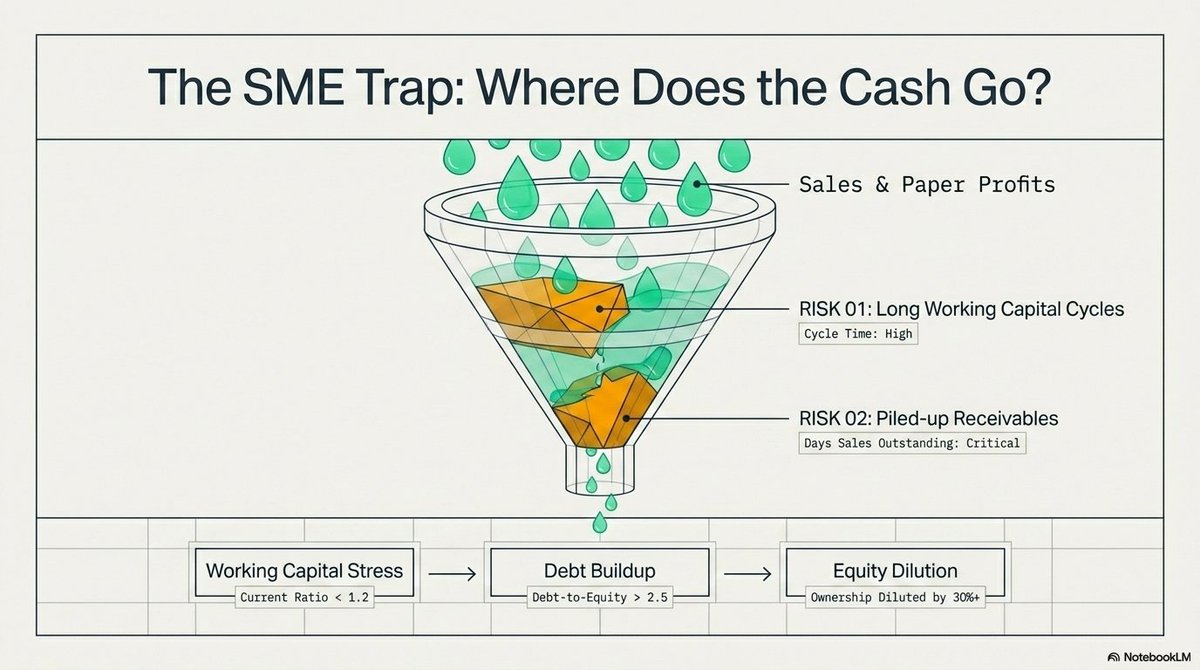
Many SMEs show strong revenue and profit growth, but if cash is not actually coming into the business, it can lead to serious risks like working capital stress, debt buildup, or even equity dilution.
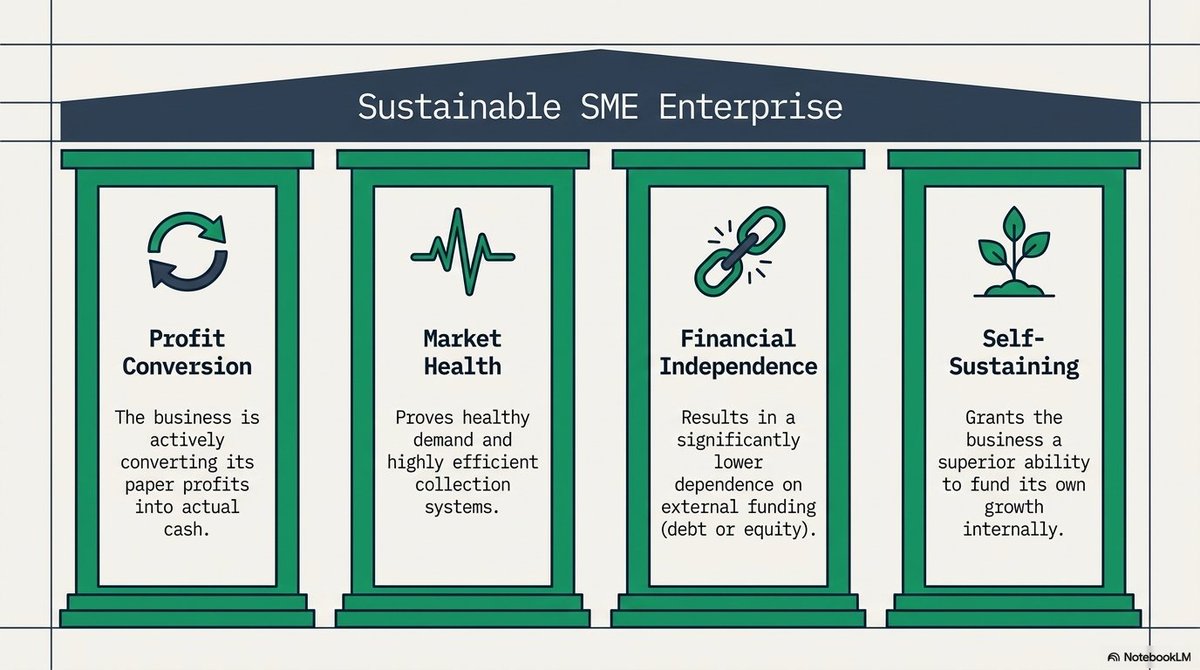
Positive OCF indicates:
The business is converting its profits into actual cash
There is healthy demand and efficient collections
Lower dependence on external funding (debt/equity)
Better ability to fund growth internally
In SMEs especially:
Working capital cycles can be long
Receivables can pile up
Growth can look strong on paper but weak in reality
That’s why:
👉 OCF acts as a reality check
Companies with consistent positive OCF tend to:
Be more financially stable
Survive downturns better
Scale sustainably without constant capital raising
For investors, focusing on SMEs with positive operating cash flow helps in avoiding weak or fragile businesses and identifying companies with real, sustainable growth potential.
Disclaimer: For educational purposes only. No recommendation. Please do your own research before investing.

3
18
2,591
The Indian Investor retweeted

Jun 12
25 SOLID SMALL CAP STOCKS TO STUDY, TRACK & RESEARCH 🔥📊🧾
▪ Vintage Coffee
▪ Aeroflex Industries
▪ KSH International
▪ Atlanta Electricals
▪ Quality Power
▪ TD Power Systems
▪ Vidya Wires
▪ POCL
▪ Sigma Advanced Systems
▪ Sedemac Mechatronics
▪ Yatharth Hospital
▪ Park Medi World
▪ Bhagyanagar India
▪ Krishna Defence
▪ Interarch Building
▪ KRN Heat Exchanger
▪ Nephrocare Health
▪ Belrise Industries
▪ Powerica
▪ Ashapura Minechem
▪ Apollo Micro Systems
▪ Senores Pharmaceuticals
▪ Astra Microwave
▪ Precision Wires India
▪ Anand Rathi Wealth
WHY TRACK QUALITY SMALL CAP BUSINESSES?
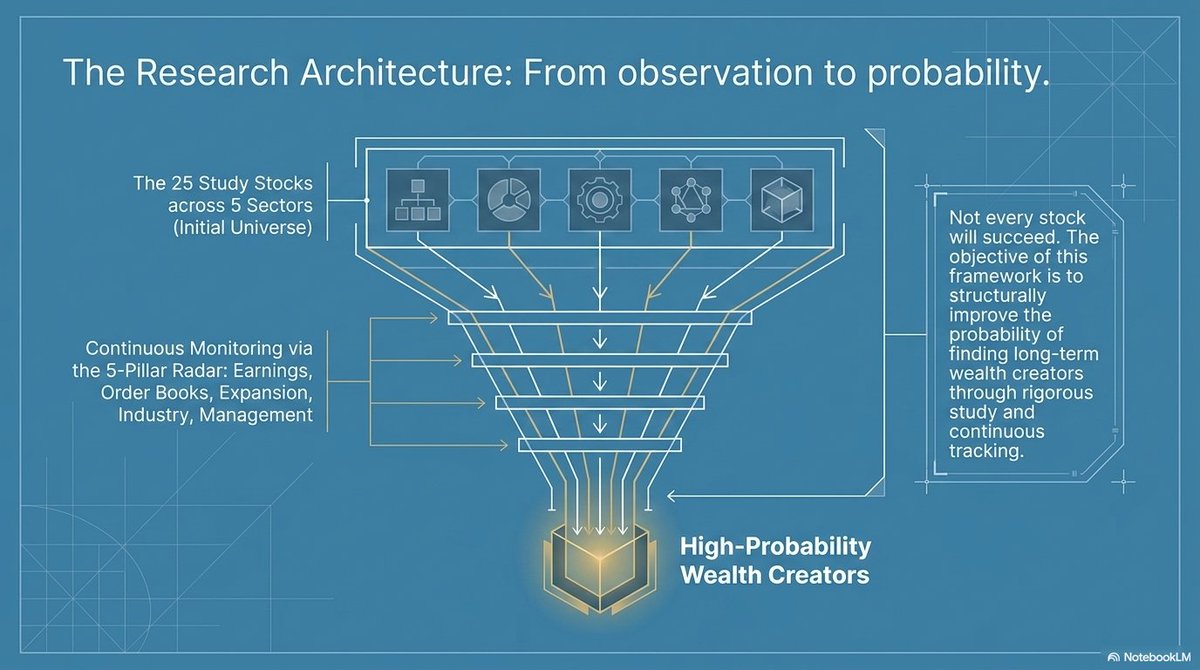
▪ Many of tomorrow's market leaders begin their journey as small-cap companies.
▪ Tracking quality businesses helps investors identify opportunities early before they become widely recognized by the market.
▪ Continuous monitoring of earnings, order books, expansion plans, industry developments, and management commentary provides valuable insights into a company's future potential.
▪ Not every stock will succeed, but studying quality businesses improves the probability of finding long-term wealth creators.
DISCLAIMER
The above list is prepared solely for educational, learning, research, and tracking purposes. This is not a buy, sell, or hold recommendation. Investors should conduct their own due diligence and assess risks before making any investment decisions.
Jun 10
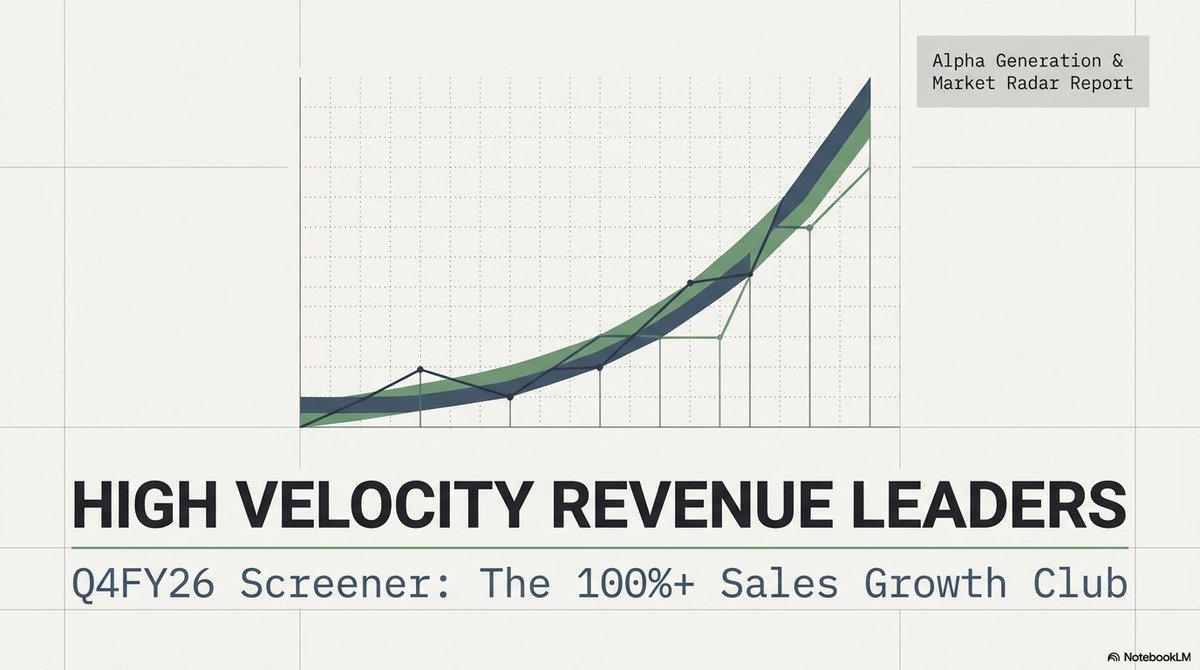
FINAL LIST OF 50 STOCKS THAT HAVE SHOWN MORE THAN 100% SALES GROWTH IN Q4FY26 🔥🔥🔥
Sigma Advanced Systems
Lloyds Metals
MCX
Neuland Labs
Waaree Energies
Waaree Renewable
HFCL
Cupid
P N Gadgil
Diamond Power
Kalpataru
Prestige Estates
Quality Power
Viyash Scientific
Sudarshan Chemical
Eternal
E2E Networks
Thangamayil Jewellery
Sun Pharma Advanced
Ashapura Minechem
SJVN
Rategain Travel
Tata Investment
Lloyds Engineering Works
Ganesh Green
Aayush Art
Virtual Galaxy
Hemant Surgical
Indo SMC
Rajputana Biodiesel
Petro Carbon
Prizor Viztech
Blue Water Logistics
Fidel Softech
Maxvolt Energy
Organic Recycling
Brandman Retail
Infinity Infoway
Apex Ecotech
Aelea Commodities
Sunita Tools
Aptus Pharma
Sunlite Recycling
ANB Metal Cast
Kesar India
Grand Continent Hotels
Desco Infratech
Alpex Solar
ACE Alpha Tech
Ideaforge Technology
WHY TRACK COMPANIES REPORTING 100% SALES GROWTH?
▪ Revenue growth is often the first sign of improving business momentum and increasing market demand.
▪ Companies delivering triple-digit sales growth usually attract investor attention, institutional interest, and market re-rating opportunities.
▪ Strong sales growth can indicate capacity expansion, new product success, market share gains, or favorable industry tailwinds.
▪ Tracking high-growth companies helps investors identify emerging businesses before they become widely recognized.
▪ While revenue growth alone is not enough, it serves as an excellent starting point for further research into profitability, margins, cash flows, and management quality.
▪ Many of the market's biggest wealth creators initially stand out through exceptional growth in their financial performance.
DISCLAIMER
The above list is shared purely for educational, research, and tracking purposes. This is not a buy, sell, or hold recommendation. Investors should conduct their own due diligence and evaluate business fundamentals, valuations, and risks before making any investment decisions.
1
31
167
35,005
The Indian Investor retweeted
Jun 11
MY ACTIVE SME WATCHLIST TO TRACK AND STUDY 🔥🔥🔥
▪ Influx Healthtech
▪ Q-Line Biotech
▪ KRM Ayurveda
▪ Cryogenic OGS
▪ Neochem Bio Solutions
▪ Neetu Yoshi
▪ PNGS Gargi Fashion Jewellery
▪ E To E Transportation Infra
▪ Zelio E-Mobility
▪ Apsis Aerocom
▪ Vilas Transcore
▪ Sunlite Recycling Industries
▪ Suba Hotels
▪ FlySBS Aviation
▪ Z-Tech India
▪ Macfos
▪ Remus Pharmaceuticals
▪ Hemant Surgical Industries
▪ Yash Optics & Lens
▪ Namo E-Waste Management
▪ Fabtech Technologies
▪ ABS Marine Services
▪ DSM Fresh Foods
▪ Shree Refrigerations
▪ Virtual Galaxy Infotech
▪ Taurian MPS
▪ Solex Energy
▪ OBSC Perfection
▪ Nisus Finance
▪ Ganesh Green Bharat
▪ Goel Construction Company
▪ Anondita Medicare
▪ Yash Highvoltage
▪ Sathlokhar Synergys E&C Global
▪ RR Kabel
▪ Adisoft Technologies
▪ Desco Infratech
▪ Anlon Technology Solutions
▪ Pondy Oxides & Chemicals
▪ Alpex Solar
▪ Petro Carbon & Chemicals
▪ Sugs Lloyd
▪ Cosmic CRF
▪ Garuda Construction & Engineering
▪ Paramount Communications
▪ Freshara Agro Exports
▪ Techd Cybersecurity
▪ Parmeshwar Metal
▪ Birla Cable
▪ Shri Ahimsa Naturals
▪ Indo SMC
▪ Sat Kartar Life Sciences
▪ Sahasra Electronic Solutions
▪ Avana Electrosystems
▪ Utssav CZ Gold Jewels
▪ H.M. Electro Mech
▪ GP Eco Solutions
▪ Highness Microelectronics
▪ Grand Continent Hotels
▪ JNK India
These are companies currently on my active SME watchlist for study, tracking, and monitoring purposes. The list spans multiple sectors including manufacturing, defence, healthcare, chemicals, renewable energy, cables, electronics, infrastructure, hospitality, and technology.
The objective is to continuously track business developments, financial performance, management commentary, industry trends, order inflows, and overall execution before making any investment decision.
DISCLAIMER
The above list is prepared solely for educational, learning, and tracking purposes. It should not be construed as a buy, sell, or hold recommendation. Please conduct your own research before making any investment decision.

Jun 4
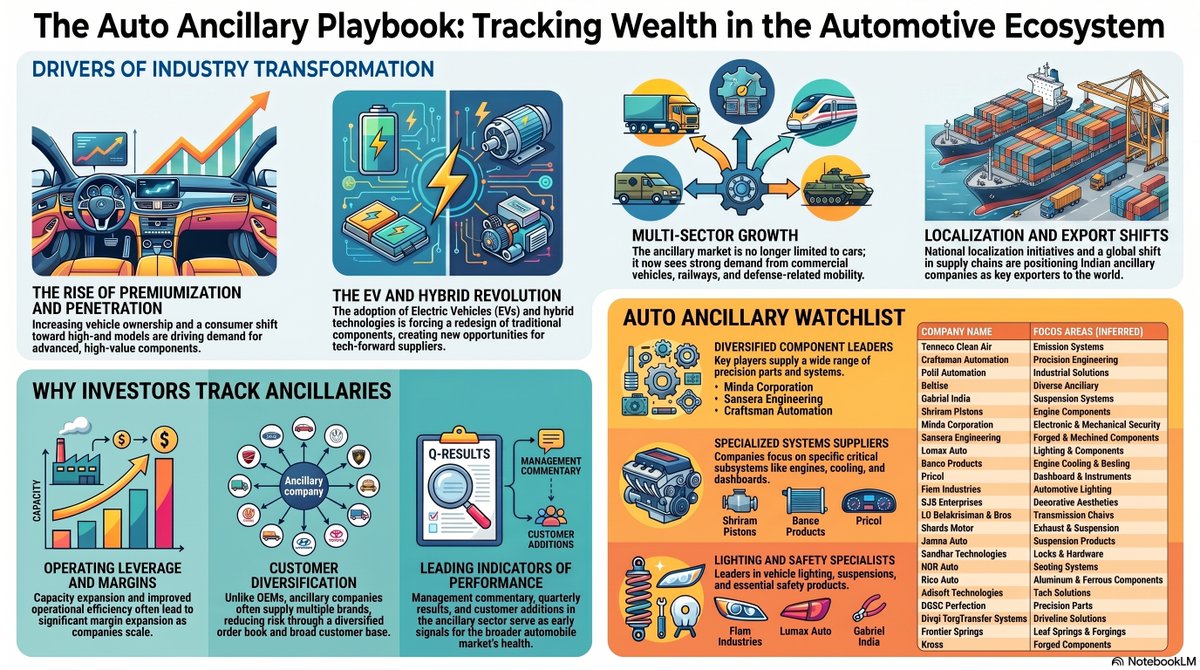
GOOD AUTO ANCILLARY STOCKS TO STUDY, RESEARCH & TRACK 🚗⚙️
Tenneco Clean Air
Craftsman Automation
Patil Automation
Belrise
Gabriel India
Shriram Pistons
Minda Corporation
Sansera Engineering
Lumax Auto
Banco Products
Pricol
Fiem Industries
SJS Enterprises
LG Balakrishnan & Bros
Sharda Motor
Jamna Auto
Sandhar Technologies
NDR Auto
Rico Auto
Adisoft Technologies
OBSC Perfection
Divgi TorqTransfer Systems
Frontier Springs
Kross
The Indian automobile industry is undergoing significant transformation driven by premiumization, increasing vehicle penetration, rising exports, EV adoption, localization initiatives, and strong growth in passenger vehicles, commercial vehicles, railways, and defence-related mobility segments.
While OEMs often receive most of the attention, a large portion of long-term wealth creation can happen in auto ancillary companies that supply critical components, systems, electronics, driveline products, braking systems, lighting solutions, suspensions, safety products, tyres, castings, forgings, and precision-engineered parts.
Studying auto ancillary companies helps investors understand:
▪ Growth of the overall automobile ecosystem
▪ EV and hybrid vehicle opportunities
▪ Export potential and global supply chain shifts
▪ Capacity expansion and localization trends
▪ Margin improvement through operating leverage
▪ Technological advancements and product innovation
▪ Customer diversification and order book growth
Many auto ancillary companies have historically generated substantial shareholder wealth by growing alongside leading automobile manufacturers. Continuous tracking of management commentary, quarterly results, capacity expansion plans, customer additions, and industry trends can provide valuable insights into future business performance.
Disclaimer:
Purely for educational and tracking purposes only.
Not a buy/sell recommendation. Please do your own research before investing.
9
13
67
20,133
The Indian Investor retweeted

Jun 11
Sai Life Sciences doubled profit in FY26. Now it's nearly doubling CapEx too.
FY26 was a strong year for the company. Revenue grew 29%, operating profit grew 56%, and net profit jumped 109%. Both the CRO (drug discovery) and CDMO (development and manufacturing) businesses contributed, with CDMO revenue growing 33%.
But the most important takeaway from the earnings call wasn't the growth. It was management's confidence in the long-term outsourcing opportunity from global pharma companies.
Revenue contribution from the top 19 global pharma customers has risen from 28% in FY22 to 49% in FY26.
Management says large pharma companies are increasingly looking for partners that can support a molecule from discovery all the way to commercial manufacturing, creating deeper and longer-term relationships.
The confidence is showing up in capital allocation.
Sai plans to spend ₹1,100–1,300 crore in FY27, nearly double FY26's ₹633 crore.
Most of this will go toward capacity expansion, while the rest will be invested in new capabilities, automation, AI, biology platforms, formulation development, and emerging technologies such as ADCs and peptides.
The expansion will be funded through a mix of internal cash generation and debt, though management said leverage is expected to remain at comfortable levels.
Analysts repeatedly questioned the sharp increase in CapEx. Management's response was simple: customer conversations are giving them better visibility into future pipelines and demand than ever before. Rather than waiting for project requests, they are increasingly working alongside customers on long-term development plans, giving them confidence to invest ahead of growth.
The pipeline also continues to strengthen.
The company ended FY26 with 34 commercial molecules and 11 molecules in Phase III or pre-registration. Management indicated that at least three recently commercialized molecules should start contributing meaningful revenue during FY27.
On the outlook, Sai reiterated its ambition to deliver 15–20% annual revenue growth while maintaining operating profit margins of 28–30% over the medium term. Management also expects the second half of FY27 to be stronger than the first as new capacities gradually come online.
FY26 was strong, but management is already focused on building capacity for what it believes could be a multi-year outsourcing cycle for India's CRDMO industry.
Disclaimer: This post is for educational purposes only. Not a buy or sell recommendation. Do your own research.
#SAILIFE #Q4FY26 #Concall

1
8
47
4,003
The Indian Investor retweeted
Jun 9
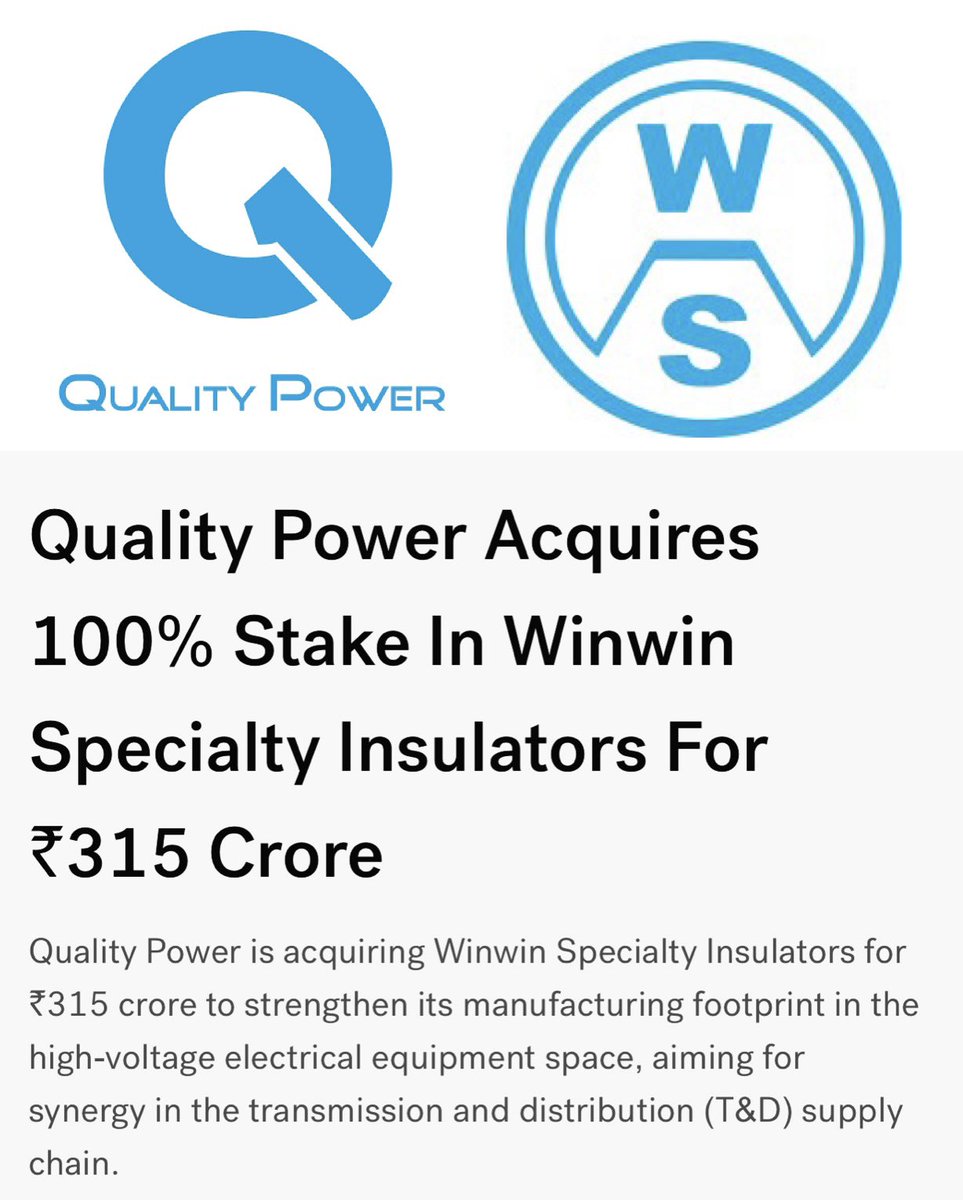
⚡️ Quality Power marks it entry into insulator segment through acquisition of 100% stake in Winwin Speciality Insulators Limited (WSIL) for ~₹315 Cr.
▪️ Winwin’s facility manufactures ceramic insulators (up to 1200kV, 18,000 MTPA capacity) & polymeric insulators (up to 400kV).
▪️ Includes 47.7-acre industrial land with direct access to Visakhapatnam & Gangavaram ports.
▪️ Facility located in Atchutapuram SEZ with European-origin automated tech.
▪️ Expands Quality Power’s high-voltage portfolio & supply chain integration.
▪️ Follows 2025 acquisitions of Mehru Electrical and Sukrut Electric.
🚫 No Recommendation
Mar 22
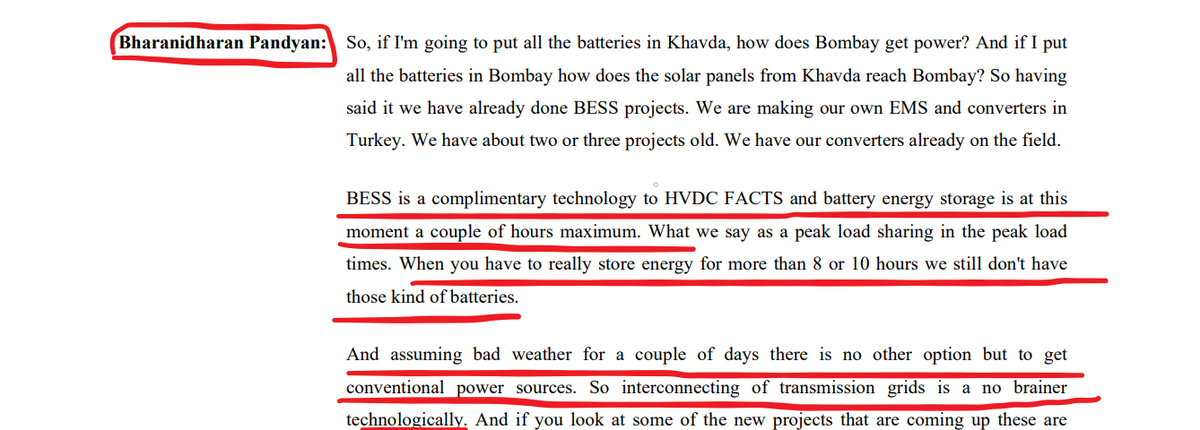
Quality Power Management on HVDC vs BESS ⚡
Management made a very important point in the latest concall 👇
BESS is not a replacement for transmission.
It is only a complementary technology used for short-term storage (a few hours).
Even today, for large-scale, reliable power transfer,
HVDC & transmission grids remain the backbone of the entire system.
You can store power for a few hours,
But you still need transmission to move energy from the source to the demand centers.
👉 Key Insight:
BESS = Support (backup / peak load)
HVDC = Core infrastructure (power flow backbone)
This clearly indicates where the long-term structural opportunity lies ✅✅
Question for you:
Where do you see the bigger opportunity ahead -
BESS or HVDC / Transmission? 👇
4
11
39
5,354
The Indian Investor retweeted
Jun 10
🚨 Choosing not to invest carries significant risk.
Inflation erodes the purchasing power of your savings over time, which can permanently hinder long-term generational wealth. In reality, knowing how to invest money is even more critical than simply earning and saving it.
🔁 Earn - Save - Invest - Repeat 🔁
💴 Compounding is a powerful concept.
A CAGR of approximately 26% is massive.
It can grow a 1 Cr portfolio to 10 crores in 10 years, and to 100 crores in 20 years.
20 Feb 2025

How to make 100 Cr by #Investing only 10 Lakhs !!
Start with 10 Lakh → Double every 3 years (26% CAGR) → 30 years → 100 Cr 🚀💰
10 yrs = 10x
20 yrs = 100x
30 yrs = 1000x
#Compounding is a powerful concept and it delivers unimaginable returns in longterm.
This exponential growth is why Ramesh Damani & Raamdeo Agrawal believe reaching ₹100 Cr is possible.
📚 Masterclass With Super-Investors 👇🏻

2
4
22
4,694
The Indian Investor retweeted
20 Feb 2025
How to make 100 Cr by #Investing only 10 Lakhs !!
Start with 10 Lakh → Double every 3 years (26% CAGR) → 30 years → 100 Cr 🚀💰
10 yrs = 10x
20 yrs = 100x
30 yrs = 1000x
#Compounding is a powerful concept and it delivers unimaginable returns in longterm.
This exponential growth is why Ramesh Damani & Raamdeo Agrawal believe reaching ₹100 Cr is possible.
📚 Masterclass With Super-Investors 👇🏻
32
35
187
71,816
The Indian Investor retweeted
Jun 10
Deep Dive: Analyzing Sunil Singhania's Abakkus Small Cap Fund (May 2026 Factsheet) 📊🔍
Abakkus Small Cap Mutual Fund is bullish on the following stocks with meaningful portfolio allocation in May 2026 👇
Industrial Products
Godawari Power & Ispat Ltd: 1.39%
Inox India Ltd: 1.70%
Jindal Saw Ltd: 1.70%
Kirloskar Oil Engines Ltd: 1.77%
Kirloskar Pneumatic Company Ltd: 1.30%
Welspun Corp Ltd: 1.96%
Pharmaceuticals & Biotechnology
Alembic Pharmaceuticals Ltd: 1.35%
Divi's Laboratories Ltd: 1.08%
Jubilant Pharmova Ltd: 1.42%
Neuland Laboratories Ltd: 1.80%
Sanofi Consumer Healthcare India Ltd: 1.13%
Sanofi India Ltd: 1.11%
Banks
Bank of Baroda: 1.23%
Equitas Small Finance Bank Ltd: 1.74%
HDFC Bank Ltd: 1.23%
Karur Vysya Bank Ltd: 1.72%
RBL Bank Ltd: 1.35%
State Bank of India: 1.06%
Auto Components
Gabriel India Ltd: 1.46%
Sansera Engineering Ltd: 1.77%
Shriram Pistons & Rings Ltd: 1.28%
ZF Commercial Vehicle Control Systems India Ltd: 1.75%
IT - Software
Intellect Design Arena Ltd: 1.35%
Oracle Financial Services Software Ltd: 1.10%
Rategain Travel Technologies Ltd: 1.85%
Tanla Platforms Ltd: 1.30%
Capital Markets
Canara Robeco AMC: 1.40%
CDSL: 1.60%
CAMS: 1.89%
Finance
Edelweiss Financial Services Ltd: 1.30%
IIFL Finance Ltd: 1.82%
PNB Housing Finance Ltd: 1.75%
Construction
Cemindia Projects Ltd: 1.97%
NCC Ltd: 1.33%
PNC Infratech Ltd: 1.09%
Retailing
Arvind Fashions Ltd: 1.63%
Urban Company Ltd: 1.43%
Vedant Fashions Ltd: 1.17%
Consumer Durables
Century Plyboards Ltd: 1.21%
Kajaria Ceramics Ltd: 1.43%
PG Electroplast Ltd: 1.33%
Healthcare Services
Dr Lal PathLabs Ltd: 1.77%
Rainbow Children's Medicare Ltd: 1.65%
Commercial Services & Supplies
International Gemological Institute (IGI): 1.72%
WeWork India Management Ltd: 1.64%
Electrical Equipment
Avalon Technologies Ltd: 1.89%
Emmvee Photovoltaic Power Ltd: 1.12%
Insurance
Star Health Insurance: 1.84%
Healthcare Equipment & Supplies
Q-Line Biotech Ltd: 1.72%
Textiles & Apparels
KPR Mill Ltd: 1.60%
Fertilizers & Agrochemicals
Rallis India Ltd: 1.50%
Chemicals & Petrochemicals
Aether Industries Ltd: 1.49%
Leisure Services
Leela Palaces Hotels & Resorts Ltd: 1.24%
Other Utilities
ION Exchange India Ltd: 1.20%
Industrial Manufacturing
The Anup Engineering Ltd: 1.18%
Transport Services
Container Corporation of India (CONCOR): 0.96%
Diversified Metals
Vedanta Ltd: 0.49%
Aerospace & Defence
Cyient DLM Ltd: 0.34%
Ferrous Metals
Vedanta Iron & Steel Ltd: 0.17%
Power
Talwandi Sabo Power Ltd: 0.17%
Non-Ferrous Metals
Vedanta Aluminium Metal Ltd: 0.17%
Oil
Malco Energy Ltd: 0.17%
Cash & Cash Equivalents
Cash & Cash Equivalents: 13.88%
Commercial Paper: 1.84%
Total Cash & Liquid Allocation: 15.72%
When tracking institutional smart money, the full factsheet reveals exactly how a veteran fund manager balances conviction, diversification, and risk management.
Fund Operations & Key Metrics
Month-end AUM: ₹1,088.92 Crores
Monthly Average AUM: ₹959.52 Crores
Active Share: 85.99%
Total Number of Stocks: 62
Analysis Takeaway:
An Active Share of nearly 86% indicates a highly active, high-conviction portfolio that differs significantly from the benchmark and reflects genuine stock-picking ability.
Market Cap Allocation
Small Cap: 74.85%
Mid Cap: 3.66%
Large Cap: 5.09%
Others (Cash & Equivalents): 16.40%
Analysis Takeaway:
The fund remains highly committed to its small-cap mandate while maintaining enough liquidity to capitalize on future opportunities.
Top Sectoral Allocation
Financial Services: 19.93%
Industrials: 18.74%
Consumer Discretionary: 17.30%
Healthcare: 13.03%
Information Technology: 5.60%
The portfolio clearly reflects a strong preference towards manufacturing, industrial growth, financialization, healthcare, and technology-led themes.
Portfolio Concentration
Top 5 Stocks: 9.56%
Top 10 Stocks: 18.56%
Top 20 Stocks: 35.78%
The portfolio remains well diversified despite being conviction-driven.
Why Has The Cash Allocation Fallen Sharply? 🔍
The most interesting development in this month's factsheet is the sharp decline in cash allocation.
April 2026 Cash Allocation: 24.57%
May 2026 Cash Allocation: 16.40%
At first glance, 16.40% cash may still appear elevated. However, context matters.
The fund was launched only on March 17, 2026. Deploying more than ₹1,000 Crores into small-cap companies overnight is practically impossible without creating impact costs and pushing stock prices higher.
As a result, fund managers typically deploy capital gradually while building positions in their highest-conviction ideas.
The latest factsheet clearly shows that this deployment process is underway.
Small-cap allocation has increased from 67.14% to 74.85%, while cash allocation has declined from 24.57% to 16.40%.
This suggests that Abakkus is actively accumulating positions across its preferred businesses and converting idle cash into productive equity exposure.
For investors tracking institutional smart money, this remains a fascinating portfolio to monitor because a large institutional buyer is still actively building positions in many of these companies.
Disclaimer: For educational and study purposes only. Data sourced from Abakkus Small Cap Fund Factsheet dated May 31, 2026.
May 22
Deep Dive: Analyzing Sunil Singhania’s Abakkus Small Cap Fund (April 2026 Factsheet) 📊🔍
Abakkus Small Cap Mutual Fund is bullish on the following stocks with 1.5% portfolio allocation in April 2026 👇
Industrial Products
Inox India Limited: 1.61%
Kirloskar Oil Engines Ltd: 1.87%
Jindal Saw Ltd: 1.58%
Welspun Corp Ltd: 1.83%
Pharmaceuticals & Biotechnology
Alembic Pharmaceuticals Ltd: 1.51%
Jubilant Pharmova Limited: 1.53%
Banks
Equitas Small Finance Bank Limited: 1.56%
Karur Vysya Bank Ltd: 1.62%
RBL Bank Limited: 1.52%
Auto Components
Sansera Engineering Limited: 1.54%
ZF Comm Vehicle Control Systems India Ltd: 1.71%
Capital Markets
Computer Age Management Services Limited: 1.81%
Central Depository Services (India) Limited: 1.87%
Consumer Durables
Kajaria Ceramics Limited: 1.60%
PG Electroplast Limited: 1.57%
Finance
IIFL Finance Limited: 1.69%
PNB Housing Finance Limited: 1.98%
Retailing
Urban Company Ltd: 1.67%
Construction
Cemindia Projects Ltd: 1.60%
Healthcare Services
Dr. Lal Pathlabs Limited: 1.67%
Rainbow Childrens Medicare Limited: 1.53%
Electrical Equipment
Avalon Technologies Limited: 1.53%
Insurance
Star Health and Allied Insurance Co Ltd: 1.74%
Cash & Cash Equivalents
TREPS/Reverse Repo: 20.93%
Certificate of Deposit: 1.84%
Commercial Paper: 1.83%
When tracking institutional smart money, the full factsheet reveals exactly how a veteran manager balances extreme conviction with risk management.
Here is the complete operational and portfolio data breakdown:
1. Fund Operations & Key Metrics ⚙️
Before looking at the stocks, the core fund structure reveals significant size growth and active management style:
Month-end AUM: ₹816.76 Crores (Monthly Avg. AUM: ₹622.35 Crores)
Net Asset Value (NAV): Regular Growth: ₹11.007 | Direct Growth: ₹11.0250
Total Expense Ratio (TER): Regular: 2.36% | Direct: 1.03%
Active Share: 86.28% (This proves it is a highly active, high-conviction alpha-seeking portfolio, completely detached from benchmark hugging).
Total Number of Stocks: 59
2. Market Cap Allocation: True to Style 🎯
The fund stays highly pure to its mandate while preserving a massive defensive buffer:
Small Cap: 67.14%
Mid Cap: 3.63%
Large Cap: 4.66%
Others (Cash & Cash Equivalents): 24.57%
Analysis Takeaway: Sitting on nearly ~25% cash equivalents via TREPS/Reverse Repo (20.93%), Certificate of Deposit (1.84%), and Commercial Paper (1.83%) gives the fund immense dry powder to capture sudden market mispricings.
3. Top Sectoral & Industry Allocations 🏗️🏦
The portfolio bets are heavily concentrated across structural capex, manufacturing, and financialization themes.
Top 5 Sectors:
Financial Services: 18.95%
Industrials: 18.00%
Consumer Discretionary: 17.12%
Healthcare: 10.93%
Commodities: 3.80%
4. Portfolio Concentration 🔝
The fund manages concentration risk exceptionally well. The Top 5 Stocks hold 9.36% of the weight, while the Top 20 Stocks account for 33.58%.
Why the Huge Cash Chunk? 🔍
The standout detail is the massive 24.57% allocation to cash and liquid equivalents (TREPS, CDs, and Commercial Paper). While this might look like a defensive bear-market stance at first glance, a look at the Allotment Date (March 17, 2026) explains the real story.
Since this factsheet is as of April 30, 2026, the fund was barely 1.5 months old when these numbers were processed.
When a brand-new small-cap fund launches, the fund manager cannot deploy ₹800 crores into thinly traded, illiquid small-cap stocks overnight without causing massive impact costs (spiking stock prices while buying). This huge cash runway simply shows staggered deployment. They are gradually scaling into their favorite ideas to avoid slippage and to protect the initial NAV from sudden volatility.
For individual trackers, this means a massive institutional buyer is still actively accumulating these 59 businesses in the open market. Tracking the chart structures of their top holdings as they build these positions can offer brilliant study setups.
Disclaimer: For educational and study purposes only. Data sourced strictly from Abakkus Mutual Fund Factsheet dated April 30, 2026.

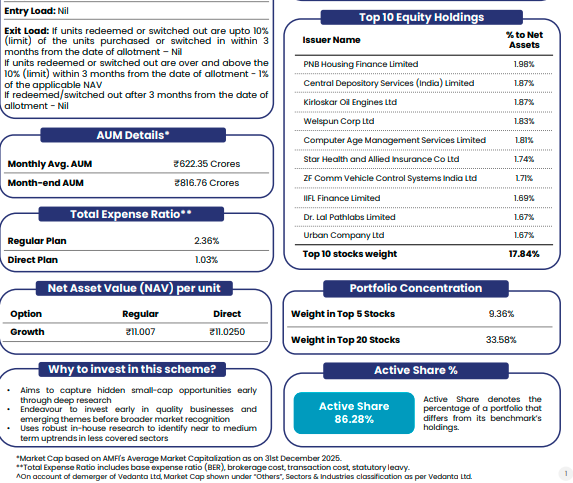
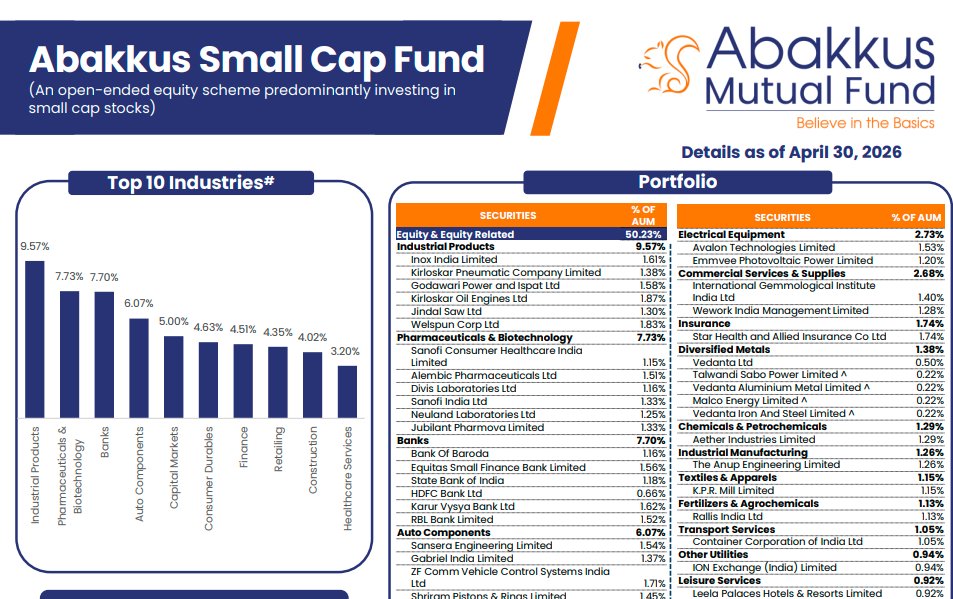
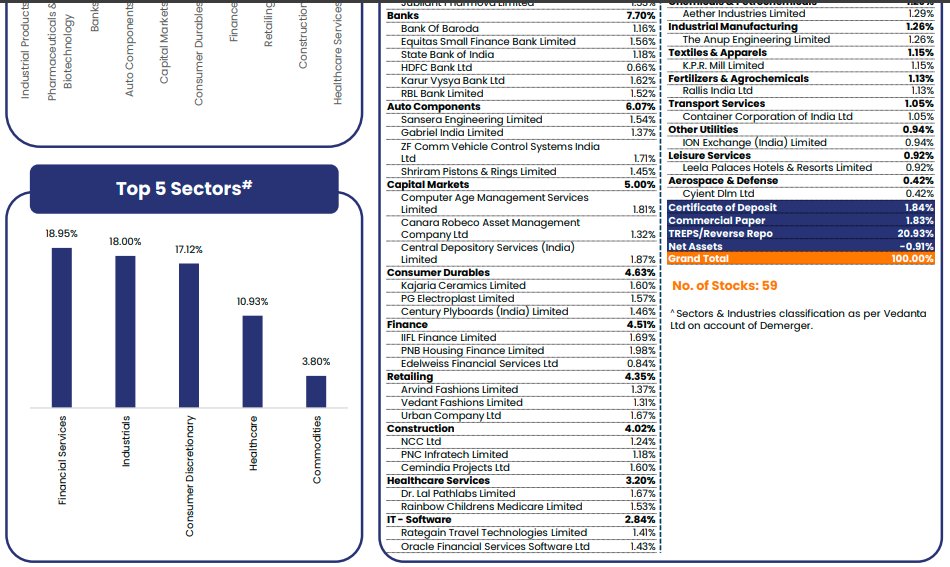
2
10
71
17,578
The Indian Investor retweeted
Jun 10
FINAL LIST OF 50 STOCKS THAT HAVE SHOWN MORE THAN 100% SALES GROWTH IN Q4FY26 🔥🔥🔥
Sigma Advanced Systems
Lloyds Metals
MCX
Neuland Labs
Waaree Energies
Waaree Renewable
HFCL
Cupid
P N Gadgil
Diamond Power
Kalpataru
Prestige Estates
Quality Power
Viyash Scientific
Sudarshan Chemical
Eternal
E2E Networks
Thangamayil Jewellery
Sun Pharma Advanced
Ashapura Minechem
SJVN
Rategain Travel
Tata Investment
Lloyds Engineering Works
Ganesh Green
Aayush Art
Virtual Galaxy
Hemant Surgical
Indo SMC
Rajputana Biodiesel
Petro Carbon
Prizor Viztech
Blue Water Logistics
Fidel Softech
Maxvolt Energy
Organic Recycling
Brandman Retail
Infinity Infoway
Apex Ecotech
Aelea Commodities
Sunita Tools
Aptus Pharma
Sunlite Recycling
ANB Metal Cast
Kesar India
Grand Continent Hotels
Desco Infratech
Alpex Solar
ACE Alpha Tech
Ideaforge Technology
WHY TRACK COMPANIES REPORTING 100% SALES GROWTH?
▪ Revenue growth is often the first sign of improving business momentum and increasing market demand.
▪ Companies delivering triple-digit sales growth usually attract investor attention, institutional interest, and market re-rating opportunities.
▪ Strong sales growth can indicate capacity expansion, new product success, market share gains, or favorable industry tailwinds.
▪ Tracking high-growth companies helps investors identify emerging businesses before they become widely recognized.
▪ While revenue growth alone is not enough, it serves as an excellent starting point for further research into profitability, margins, cash flows, and management quality.
▪ Many of the market's biggest wealth creators initially stand out through exceptional growth in their financial performance.
DISCLAIMER
The above list is shared purely for educational, research, and tracking purposes. This is not a buy, sell, or hold recommendation. Investors should conduct their own due diligence and evaluate business fundamentals, valuations, and risks before making any investment decisions.
Jun 8
FINAL LIST OF 70 LARGE CAP STOCKS THAT HAVE POSTED GOOD TO EXCELLENT Q4FY26 RESULTS 🔥🔥🔥
(SME, SMALL CAP & MID CAP LISTS ALREADY DISCUSSED & QUOTED BELOW)
▪ Lloyds Metals
▪ MCX
▪ Eternal
▪ Waaree Energies
▪ Jio Financial Services
▪ GROWW
▪ BSE
▪ Titan Company
▪ Muthoot Finance
▪ NMDC
▪ Hindustan Zinc
▪ Vedanta
▪ NTPC Green Energy
▪ Hitachi Energy India
▪ Lenskart Solutions
▪ Bajaj Auto
▪ Solar Industries India
▪ GMR Airports
▪ Bharat Heavy Electricals
▪ Lupin
▪ TVS Motor Company
▪ Hero MotoCorp
▪ Mahindra & Mahindra
▪ FSN E-Commerce Ventures
▪ Maruti Suzuki India
▪ Siemens Energy India
▪ Polycab India
▪ Adani Ports & SEZ
▪ Persistent Systems
▪ CG Power
▪ Jindal Steel & Power
▪ Coal India
▪ Nestle India
▪ Marico
▪ Cummins India
▪ Mazagon Dock Shipbuilders
▪ Hindalco Industries
▪ Cholamandalam Investment & Finance
▪ Tata Motors
▪ Trent
▪ Apollo Hospitals
▪ Bajaj Finance
▪ Varun Beverages
▪ Tata Consumer Products
▪ Fortis Healthcare
▪ AU Small Finance Bank
▪ Bharat Forge
▪ Ashok Leyland
▪ Samvardhana Motherson
▪ Zydus Lifesciences
▪ Eicher Motors
▪ Adani Total Gas
▪ Grasim Industries
▪ Siemens
▪ JSW Steel
▪ Pidilite Industries
▪ Indian Hotels Company
▪ Adani Green Energy
▪ Infosys
▪ Bosch
▪ Sun Pharma
▪ Tech Mahindra
▪ Tata Steel
▪ HCL Technologies
▪ Max Healthcare
▪ UltraTech Cement
▪ Mankind Pharma
▪ Bharat Electronics
▪ Lodha Developers
▪ Larsen & Toubro
WHY TRACK STRONG QUARTERLY PERFORMERS?
▪ Strong quarterly numbers often signal that a company is executing well and gaining momentum.
▪ Consistent growth in sales and profits is usually the first sign of a potential long-term winner.
▪ Earnings season helps investors spot emerging leaders before they become market favorites.
▪ Management commentary provides valuable insights into future growth, expansion plans, and industry trends.
▪ Companies delivering strong results quarter after quarter tend to attract institutional and smart-money interest.
▪ Following earnings closely helps investors separate fundamentally strong businesses from market noise.
▪ In the stock market, strong businesses eventually command strong valuations.
DISCLAIMER
The above list is shared purely for educational, research, and tracking purposes. This is not a buy, sell, or hold recommendation. Please conduct your own due diligence before making any investment decisions.
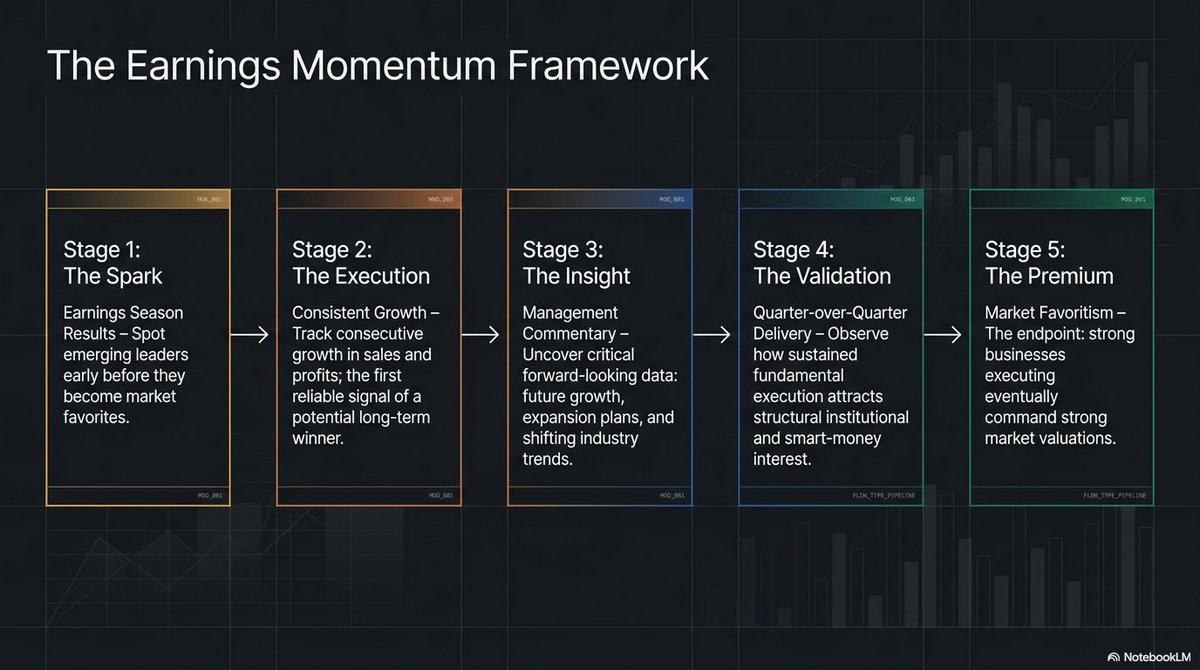

11
33
120
34,660
The Indian Investor retweeted
Jun 10
📚 Want to learn the Stock Market from Scratch to Advanced Level?
A complete step-by-step learning roadmap covering everything from basics to advanced concepts is available absolutely FREE.
If you are serious about becoming a better investor and trader, this is a golden opportunity to learn in a structured manner without paying for expensive courses.
Please check the post below for access to all classes and PDFs. 👇
Jun 7
Class No. 16 & Class No. 17 Uploaded Together ✅🔥📈
A couple of months ago, I took an initiative to teach the stock market completely FREE, starting from the absolute basics and gradually moving towards advanced concepts. I wanted to create something that could genuinely help people who are serious about learning but may not have access to expensive courses.
I am extremely happy to say that this initiative has been going very well.
With the completion of Class No. 17, we have now crossed more than 200 pages of educational content in our PDF series. What a journey it has been so far! 🔥
Over these months, many people have messaged me personally and shared how much these classes have helped them. Many are learning consistently, becoming more confident, improving their understanding of the markets, and growing as investors and traders.
Nothing gives me more happiness than seeing people benefit from something that is created with genuine love and passion. When you do something without expecting anything in return and then see others grow because of it, the satisfaction is truly unmatched.
Class No. 17 also marks the completion of the Candlestick Pattern section. We have now covered this topic in great depth, from basic patterns to advanced multi-candlestick formations.
The journey, however, is far from over.
From the next classes onwards, we will move into one of the most important topics in Price Action Trading — Support & Resistance.
Not only will we cover the basics, but we will also dive deep into advanced concepts related to support and resistance that can provide a significant edge in trading as well as investing.
And remember, we have only just started Price Action.
There is still a lot left to learn, and throughout 2026, I plan to teach every important aspect of the stock market in a structured manner so that anyone following these classes seriously can build a strong foundation and eventually become an independent investor and trader.
If you want to learn Price Action from scratch to an advanced level and access all the PDFs and future classes in a proper sequence, you can join our Telegram group using the link given below.
t.me/Microcap10X
Read. Learn. Practice. 📊📈
Because knowledge alone is not enough - consistent practice is what creates results 💚
Thank you everyone for your trust, patience, support, and love.
Let's continue this journey together. ❤️


3
10
2,312