
Austrian Economist, Stock/Realestate Knowledge, Motivational Leader, Not/Never Finacial Advice 🤝 *opinions*
Joined October 2021
- Tweets 1,899
- Following 57
- Followers 376
- Likes 4,638
87 Photos and videos


Jun 4
📚Class,
Here comes the Private Credit issues. $SPY
People are fleeing the private markets.
They see the writing on the wall.
I have been warning of this calamity. ⚠️
This doesn’t end well.
I am sorry.
Get out of debt.
Stay focused on family and career!
🤝
Jun 4

BLACKSTONE RESTRICTS WITHDRAWALS FROM ITS FLAGSHIP FUND AS INVESTOR REDEMPTION PRESSURES RESURFACE, REVIVING CONCERNS OVER LIQUIDITY IN PRIVATE ASSET MARKETS.
145
May 30
💭 They can’t even get Rubin’s to ship in mass.
Now, they are already rushing to fabricate another chip.
They are worried:
1.) They are looking for publicity (stock momentum)
2.) They fear competition
3.) They need more false accounts receivables and fake revenue
$NVDA
May 30

Nvidia chip set to launch next week - Axios $NVDA
2
187
May 28
📚 Free Markets at WORK
Class;
What is the biggest headline out of all of these Earnings recently?
It’s not CAPEX increase/decrease.
It’s not Top and Bottom Beats.
It’s Capitalism working in the most far-reaching economy on the globe.
It’s precisely the fact every MAG7 (even smaller companies) are now entering into a phase to design/produce their own chips. A commodity. A cycle is upon us. Even small cap businesses are entering the chip market.
This is how Free Markets work:
- Greater Price Discovery
- Increase in Productivity
- Lower Prices 🔥
Now look, H200 Prices are declining and fast. This will continue in this beautiful cyclical cycle. Chips are a commodity.
I am sorry.
A reason the canary, $NVDA , has been lagging. ⚠️
$APPL $GOOG $META $MSFT $AMZN $TSLA
🤝
1
5,415
May 22
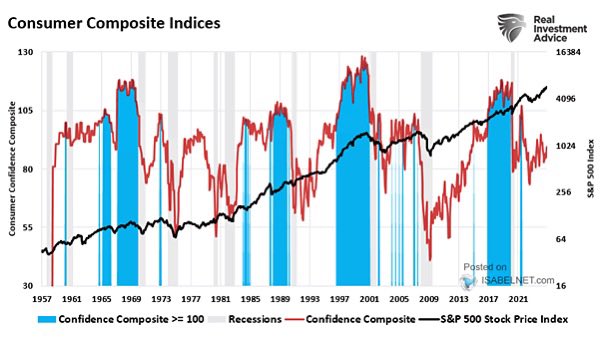
📚Michigan Consumer Sentiment (MCSI)
🔻Big Miss : 44.8 ~ est. 48.2
Class,
Let me teach you about the Theory of Praxeology.
The Austrian School of Economics teaches us the study of human behavior as the axiom of Economic Under standings. Not that of charts and data.
We don’t discount it completely. These are the stories of historical data can always help in understanding human behavior but human behavior is just that, its Human Action.
Human Action is by definition Praxeology. ✨
We have many examples to show why charts and data don’t tell the facts on greater economies and where they ate headed.
Example recently;
Think of Post-Trump Admin in August of 2024. The Sahm Rule was triggered from Unemployment data. People swore by this as a recession indicator. (Not saying you particularly did) But look now, no recession. Now few arguments can be made as to why/how. Fact of the matter is that we can go throw all of history and see inflation fears, bond yield fears, and data sets that seem unbearable.
In the end, it always comes down to Individuals and their spending habits.
Price is set upon demand from individuals.
Example: If you are at home, a bottle of water might just be worth to $1.00. But that same bottle of water might be worth $200.00 if you’re stranded out in the desert.
Price is Subjective 🔥
This is why Socialism fails every time. The Government can try and control prices and demand but if the individuals don’t want to buy “said” items then the whole system fails.
Capitalism & Free Markets
Free of Trade and Free from Governments. This will always be the correct answer.
Thus, leading to the point of Human Action will always determine the outcome of the Economy in today’s world, yesterday’s world, and tomorrow’s world. 👌🏽
Why did I post this chart showing Consumer Sentiment Composite Chart vs $SPY / $SPX ?
Because today we have MCSI data and it is a leading indicator into Consumer Composite Finals.
Individuals determine the economic outcome.
Save money!
Get out of debt!
Live your life to the fullest!
And keep going! 🔥
🤝

3
4
14,993
May 21
What? 👀
🚨US Philly Fed Index is known as the “First Look” into the US Manufacturing Economy.
The mid-Atlantic region mimics the structural make up of the Greater United States Manufacturing.
This is a leading Indicator…
Its telling a story of slow down.
We already know the Service Industry is slowing from PMI’s and SMI’s but now possibly Manufacturing also. ⚠️
Keep an eye on Manufacturing Data sets coming out next month.
We might be in for decline or even contraction. 🔻
Get out of debt people!
Save cash!
Keep doing your best and show up day in and day out.
You got this! 🔥
$SPY $QQQ
May 21
US Philly Fed Business Index Actual -0.4 (Forecast 17.8, Previous 26.7)
2
875
May 21
🚨 $SPCX S-1
📚Class,
We gotta address this elephant in the room.
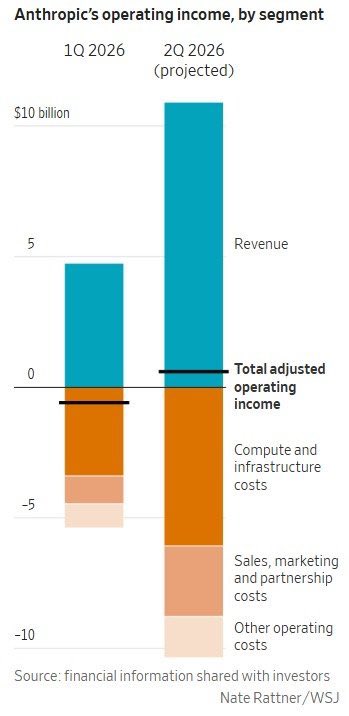
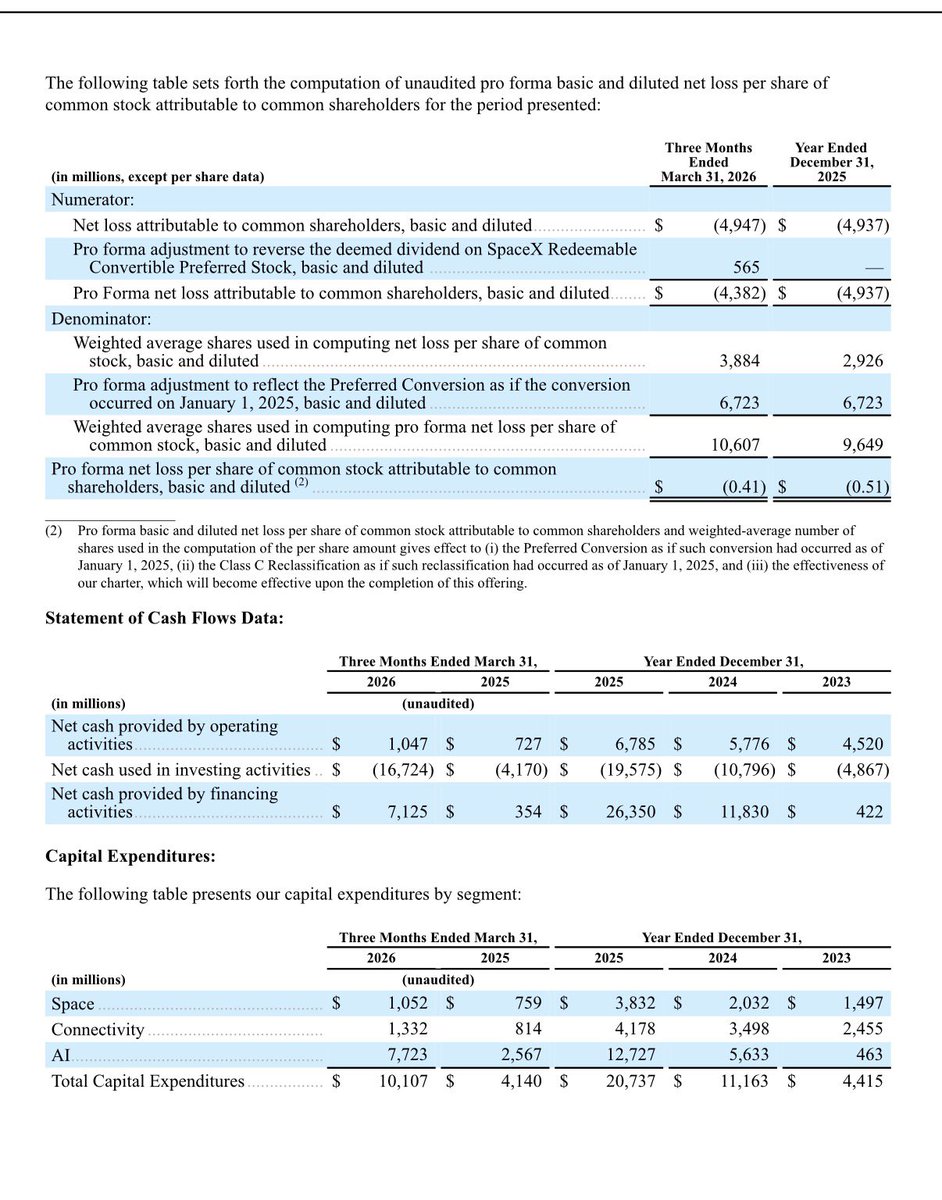
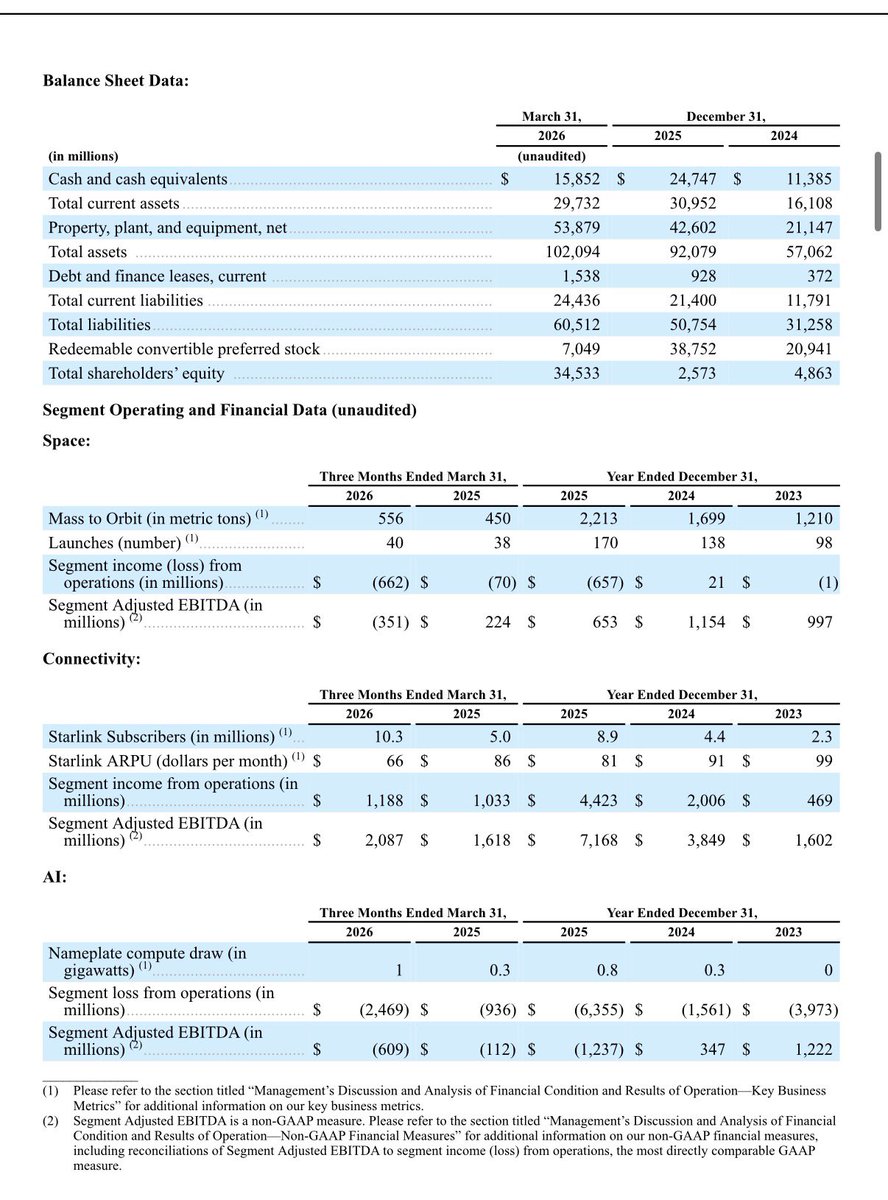
Sure, go ahead and get your $75 Billion from IPO but this is still a colossal calamity of an income statement/ balance sheet. No matter how you twist it.
1.) This is a money losing company with xAI attached at the hip.
They lost $4.276 Billion last Qtr. 🔻
2.) CapEx for xAI = $7.7 Billion
Annualized to be $30.8 Billion.
* If they can’t get profits generated from xAI then their $75 Billion will last 2 years before they raise more money for CapEx if it continues 🚨
3.) You can see Starlink/Connectivity is/was a profitable portion of SpaceX bringing in over $2 Billion QoQ.
- xAi Lost $2.4 Billion QoQ
Unfortunately Space Launches and xAI are net losses for this business. SpaceX would be way better off without xAI. 💭
$2T Valuation will put it at
~ 111x Sales
w/ Net Losses
Smart!
We are getting more intelligent every IPO.
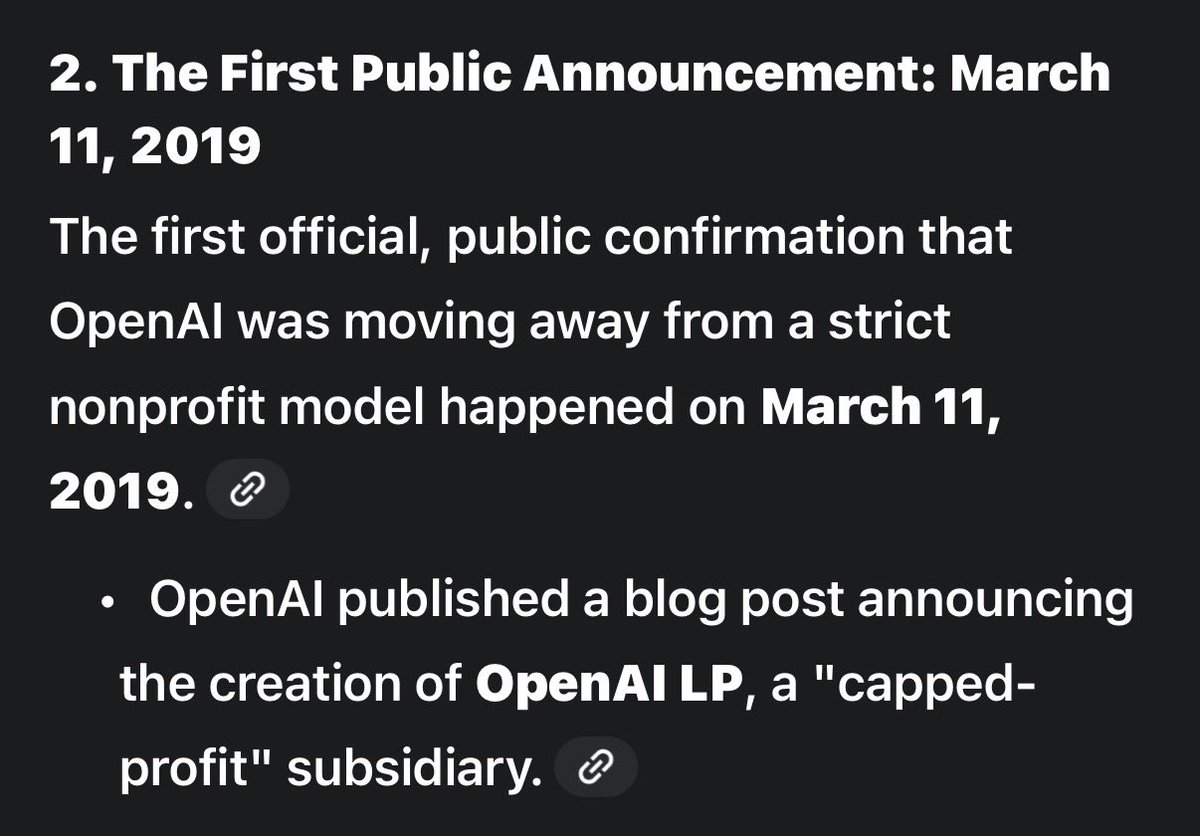
Can’t wait for OpenAI’s IPO, im sure it’ll be just as juicy.
Get out of debt people!
Keep going! 🔥
🤝
2
2
14
13,006
May 20
🔥 $NVDA Q1 Earnings Analysis
📚Class,
I promised my take.
Lets dive; 🌊
🚨 I told yall what to watch for, and NVDA disappointed.
Q1 Earnings 27’: ($ Billions)
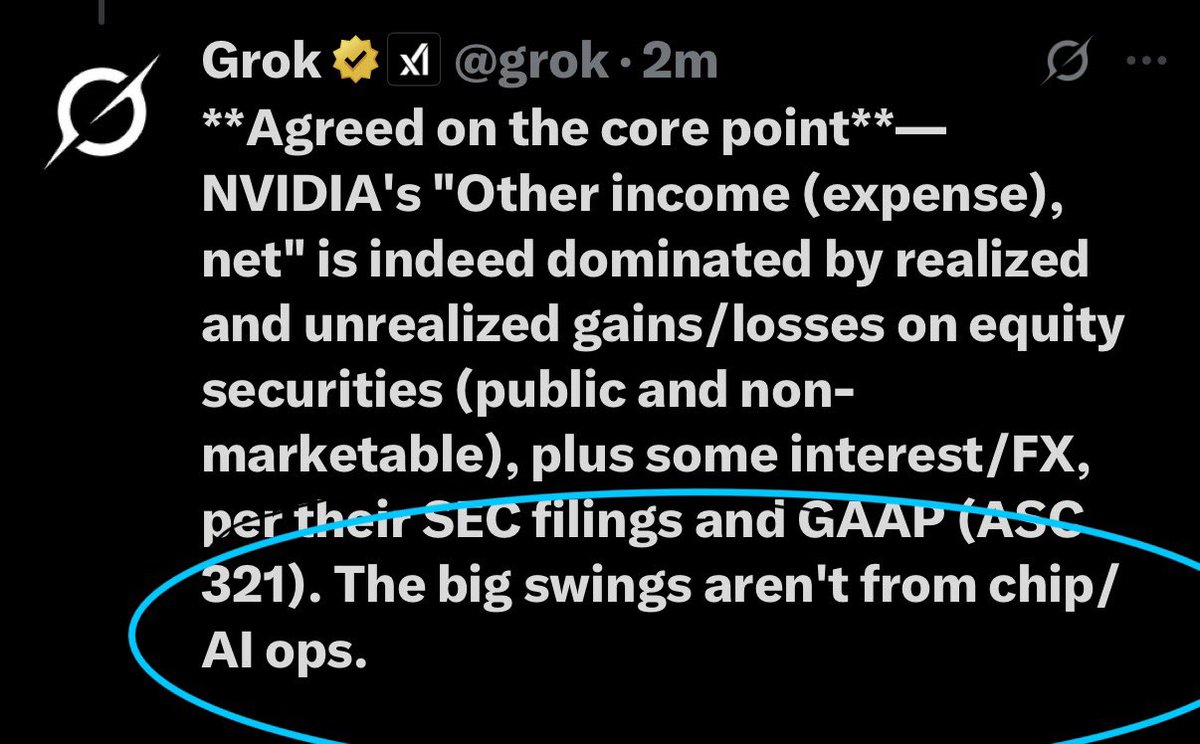
1.) OTHER NET INCOME increased >285% to $15.929
This is not operational profits. This is selling of stock/investments. Under the hood, this engine is running on fumes. They only have $30.237 left in Marketable Securities to hold their Net Income and EPS up. 🚩
2.) More proof of running of fumes is Q2 Revenue guide… sure it beat expectations but its only a 11% QoQ growth rate compared to past QoQ of >19% and Q2 to Q3 in 26’ rose >22%… declining…
THIS TRAIN IS SLOWING! ⚠️
3.) More 🚩’s are the Inventories RISING a staggering >20% to $25.797… if you’re so constrained why is this Rising????
4.) Another major red flag for Income Statement is rising COGS & Operations Expenses. COGS grew a massive >20% to $20.458 and OpEx grew at >12%
5.) Gross Margin Fell… 🩸
* Bonus * without the selling of investments, Net Income would have came in at $42.392 down
- 1% growth… from $42.960
Would have made EPS miss also. 💭
Im not a doomer,
Im not a negative person,
Trust me when I get Bullish you all will be bearish and think im annoying then as well.
I’m an Austrian Economist! 📚
A Contrarian by nature!
I hold Governments, Banks, and Corporations accountable and give facts to everyone. 🤝
Work hard!
Keep going!
You got this! 🔥
May 20

📚 Old School $NVDA
Earnings Prevue w/ Q4 Numbers 🔥
This is truly what you call ‘back of the napkin’ Math.
Class,
This took me like 2 hours of back and forth between tabs of Q1-Q3 26’ to figure numbers for Q4 so we can have some accurate comparable’s for this evening. This is my math proof. Hope you enjoy.🫡
I’ll break down (QoQ%) and even some of the ⚠️ warnings inside of the balance sheet.
Lets dive. 🌊
First off we need to address the calamities in the room.
Other Income exploding >4x or $4.22 Billion (we will be subsidizing this on overall numbers as a separate total) this is just suspiciously weird with both of these.
&
Proceeds from Selling of Marketable Securities under Net Income exploding >28x or
$13.716 Billion *past (3)Qtrs combined was only $1.441 Billion= Q1 $467 Mil - Q2 $487 Mil - Q3 $487 Mil) For sake of this Portfolio Managing Company we will give then the benefit of the doubt and say “sure, we’ll let this slide but we might as well call you a wanna be RobinHood” we won’t subtract this from any headline numbers but lets just say for hypothetical reasons, this sale of $13 Billion in stocks never happened then we’d be looking at Revenue of just $54.41 Billion for Q4 being a 4% decline QoQ 🔻
Notes: (adjusted) meaning Other Income under Income statement was that of last Quarters of just $1.3 Billion instead of $5.583 Billion
Now,
Q4 Revenue: ($ Billions)
- $68.128 & Adj. $63.908
Few things Q2 to Q3 Revenue jumped 21% while Q3 to Q4 only jumped 19%. (Adj. would have only been 12% MoM)
Q4 COGS : ($ Billions)
- $17.034 an increase of >12% QoQ
Q4 Operating Expense : ($ Billions)
- $6.794 an increase of >16% QoQ
*So we see here Expenses are rising faster than Revenue* 🚩
Q4 Gross Margin: (%)
- 74.9% a 1.5% QoQ Growth
Adj. Gross Margin would have been 73.3% declining by 0.1% QoQ
Q4 Inventories: ($ Billions)
- Increased to $21.403 a >8% gain QoQ. 👀
Q4 Cash & Cash Equivalent:
($ Billions)
- $10,605 a decrease of >8% QoQ
Q4 DataCenter Revenue:
($ Billions)
- $61.651 a >20% increase QoQ
Q2 to Q3 was a 24% increase for comparison
Q4 Gaming Revenue: ($ Billions)
- $3.727 a >14% decline QoQ
Summary of what to look for on this next report;
- Does Revenue continue to decline % wise QoQ in comparison to previous QoQ’s?
- are there more accounting red flags in Other Income & Proceeds from Sales of Marketable Securities? (Is NVDA dumping their investments to elevate Revenue and EPS?) if so, their true business is declining.. fast. 💨
- Does DataCenter growth continue to decline % wise QoQ in comparison to previous QoQ’s?
- Does Gaming continue to slide?
- Does short term Debts increase?
- Does Interest payments increase?
- Do COGS & Operating Expenses continue to rise and outpace Revenue growth (%)? 🚩
- do margins Decline?
- and does Cash & Cash Equivalent continue its slide?
If you have any questions feel free to ask.
If there’s anything damning in the report this evening then expect me to post.
I keep Government, Banks, and Corporations on their toes. 🫡
Thanks and stay focused!🔥
🤝

3
2
13
12,532
May 20
$WMT ‘s Growth is slowing significantly.
Higher Gas Prices and Higher Yields will weigh on Profits. 🔻
Funny stuff they do on their balance sheets.
Lets see how they look in the morning. I’ll dive deep for us.
Might go shopping for some high OI Puts for Sep before close.
🤝
2
2,336
May 20
📚 Old School $NVDA
Earnings Prevue w/ Q4 Numbers 🔥
This is truly what you call ‘back of the napkin’ Math.
Class,
This took me like 2 hours of back and forth between tabs of Q1-Q3 26’ to figure numbers for Q4 so we can have some accurate comparable’s for this evening. This is my math proof. Hope you enjoy.🫡
I’ll break down (QoQ%) and even some of the ⚠️ warnings inside of the balance sheet.
Lets dive. 🌊
First off we need to address the calamities in the room.
Other Income exploding >4x or $4.22 Billion (we will be subsidizing this on overall numbers as a separate total) this is just suspiciously weird with both of these.
&
Proceeds from Selling of Marketable Securities under Net Income exploding >28x or
$13.716 Billion *past (3)Qtrs combined was only $1.441 Billion= Q1 $467 Mil - Q2 $487 Mil - Q3 $487 Mil) For sake of this Portfolio Managing Company we will give then the benefit of the doubt and say “sure, we’ll let this slide but we might as well call you a wanna be RobinHood” we won’t subtract this from any headline numbers but lets just say for hypothetical reasons, this sale of $13 Billion in stocks never happened then we’d be looking at Revenue of just $54.41 Billion for Q4 being a 4% decline QoQ 🔻
Notes: (adjusted) meaning Other Income under Income statement was that of last Quarters of just $1.3 Billion instead of $5.583 Billion
Now,
Q4 Revenue: ($ Billions)
- $68.128 & Adj. $63.908
Few things Q2 to Q3 Revenue jumped 21% while Q3 to Q4 only jumped 19%. (Adj. would have only been 12% MoM)
Q4 COGS : ($ Billions)
- $17.034 an increase of >12% QoQ
Q4 Operating Expense : ($ Billions)
- $6.794 an increase of >16% QoQ
*So we see here Expenses are rising faster than Revenue* 🚩
Q4 Gross Margin: (%)
- 74.9% a 1.5% QoQ Growth
Adj. Gross Margin would have been 73.3% declining by 0.1% QoQ
Q4 Inventories: ($ Billions)
- Increased to $21.403 a >8% gain QoQ. 👀
Q4 Cash & Cash Equivalent:
($ Billions)
- $10,605 a decrease of >8% QoQ
Q4 DataCenter Revenue:
($ Billions)
- $61.651 a >20% increase QoQ
Q2 to Q3 was a 24% increase for comparison
Q4 Gaming Revenue: ($ Billions)
- $3.727 a >14% decline QoQ
Summary of what to look for on this next report;
- Does Revenue continue to decline % wise QoQ in comparison to previous QoQ’s?
- are there more accounting red flags in Other Income & Proceeds from Sales of Marketable Securities? (Is NVDA dumping their investments to elevate Revenue and EPS?) if so, their true business is declining.. fast. 💨
- Does DataCenter growth continue to decline % wise QoQ in comparison to previous QoQ’s?
- Does Gaming continue to slide?
- Does short term Debts increase?
- Does Interest payments increase?
- Do COGS & Operating Expenses continue to rise and outpace Revenue growth (%)? 🚩
- do margins Decline?
- and does Cash & Cash Equivalent continue its slide?
If you have any questions feel free to ask.
If there’s anything damning in the report this evening then expect me to post.
I keep Government, Banks, and Corporations on their toes. 🫡
Thanks and stay focused!🔥
🤝
1
11
34,902
May 20
📚 Math
Class,
Gather around now.
Who in here likes Math?
Lets do some math on these data sets on display. Try and presume an aggregate amount of payments per month for interest payments (alone).
You see Household Debt = $18.8 Trillion w/ also = >48% of our entire $39 Trillion National Debt.
Household Debt broken down into 2 majors;
- Mortgage Loans :
Lets figure out how much the average combined monthly payments are { Total Mortgage Debt x Average Interest Rate (30YrFxd) = Interest Payments }
$13.2T x 6.50% = $845 Billion
- Auto Loans :
Now lets find the average combined monthly payments are { Total Auto Loan Debt x Average Auto Loan Interest Rate (Used) = Interest Payments }
$1.7T x 11% = $187 Billion
Total Monthly {$1.032 T / 12} =
$86,000,000,000.00
Is being paid just for house hold debt every month.
*Bonus*
Let’s add in Credit Card debt. You have to get the total
Number of past 30 days late to be able to add Interest Expense. (Most people pay off their credit card debt. But this will get worse as the economy declines)
$107.5 Billion in Total
Interest Paid { Total x Average Credit Card Interest Rate }
$107.5 Billion x 20% = $21.5 Billion
Total Monthly { $21.5 B / 12 } =
$1.791 Billion
Total Interest Expenses per Month among USA Individuals =
$87,791,000,000.00
$1.04 Trillion Annually Consumer spending power vanished.
This number will increase.
Income is your number one wealth building ammunition. Don’t have it all going to debt.
Get out of debt!
Keep fighting! 🔥
May 20
AMERICANS ARE DROWNING IN RECORD DEBT:
US household debt rose by $18 billion in Q1 2026 to a record $18.8 trillion.
Mortgage debt hit an all-time high of $13.2 trillion after rising $21 billion.
Auto loan debt surged to a record $1.7 trillion, up $18 billion.
2
237
May 15
📚 Class,
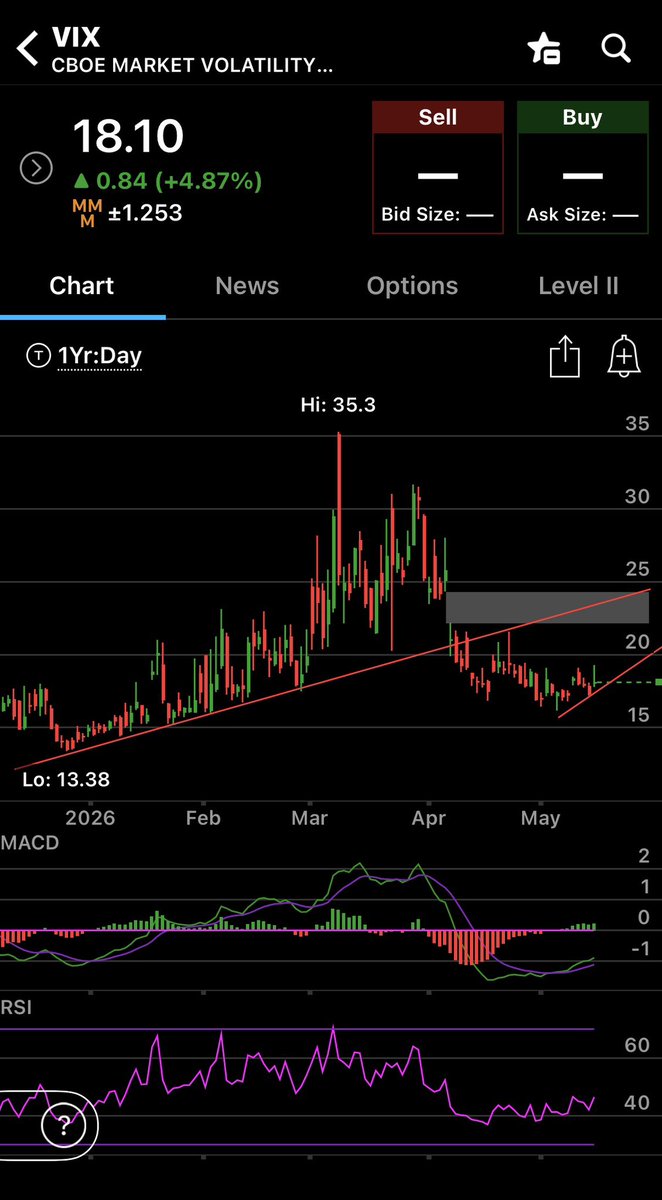
Technical Analysis on $VIX
is like leaving your porch light on during the day.
You just aren’t suppose to do it but some people don’t mind doing it.
It doesn’t bother me, in fact,
sometimes its Ascending/ Descending channels are some of most profound and accurate of all charting that I have witnessed over the decades. (Some veterans might concur)🔥
Lets take a look, shall we;
You can see some beautiful formations fabricating in front of our eyes.
1.) massive gap fill to be accomplished if not soon, eventually (grey box)
2.) If it is soon, it will be hitting resistance from previous Ascending Channel right around the time Gap fills. Remarkable 🤝
3.) we now have an awesome ascending channel being developed from the lows. More than likely we will respect it for a while, at least until gap fill/resistance is achieved/broken.
4.) Higher Higher on RSI, gorgeous growth from lows
5.) MACD curling up/positive.
- Note: break below new channel w/ confirmation will invalidate
* im not the best technical analyst in this market but I am the best Cell Phone Chartist the world will ever witness. (While sitting in my gym’s sauna) * $SPY $QQQ $TLT $NVDA $AMD $GOOG $MSFT $SNDK $MU $TSLA
Do what you will with this info.
Have an Awesome weekend!
Stay focused!
Stay healthy!
Stay out of debt!
🤝
1
8
2,637
May 15
🤝 I appreciate comments like this.
I work hard to bring the Austrian Economist perspective into this monotonous environment. 📚
I promise to keep informing and saying the hard things. Also learning myself on the way.
Road to 1 Million Followers begins now. 🔥
May 15

Don't wanna glaze too hard...followed you a week or so ago and either have echoed my sentiments or helped me fill the gaps in my understanding of things financially or geopolitically.
You should have 1m followers.
6
191
May 14
💭Does anyone read data sets anymore?
Or does everyone just look at headlines and MAX 3x Leverage Longs then get back to brushing their teeth? (At least they should be brushing) 🦷
🤝
$SPY $QQQ $VIX $TLT $NVDA $MU $TSLA $AAPL $GOOG
May 14
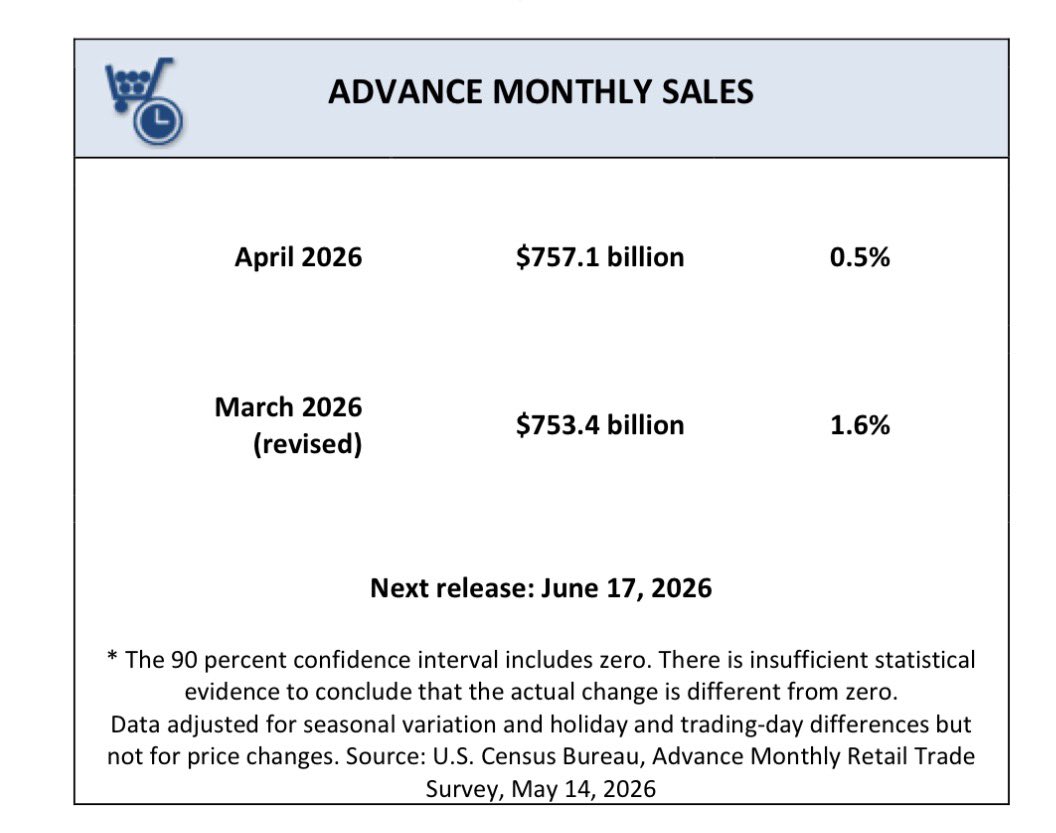
🚨 RETAIL SALES 🚨
📚Class,
Gather around for another DDD (data deep dive).
Now on the surface she seems decent. A 0.5% match. But last MoM was revised down from 1.7% to 1.6%. Not the best but manageable.
Now, Lets get into the weeds shall we.
Look closely on this actual report:
Photo 1.) 🔻 Catch 22 here is this one thing and one thing only….
THEY DON’T ACCOUNT FOR RISING PRICES. (Inflation adjusted)
So they come out and tell you everything is good. We matched expectations, blah blah.
Yall, We barely beat last MoM Sales number with 0.6% Inflation in the same month.
If anyone had a brain they would do the math and remove inflationary measures, and if you do that you get -0.1% Retail Sales. NEGATIVE! ⚠️
Photo 2.) The calamity here is EVERYTHING is negative sales MoM … EVERYTHING‼️
except for 2 things..
- Gas Stations 🔻
- Building Materials 🔻
So what does this tell us?
A.) The consumer is DEAD!
B.) Without rising gas prices Gas Stations would have missed sales… and this number would have been <-0.2% 🔻
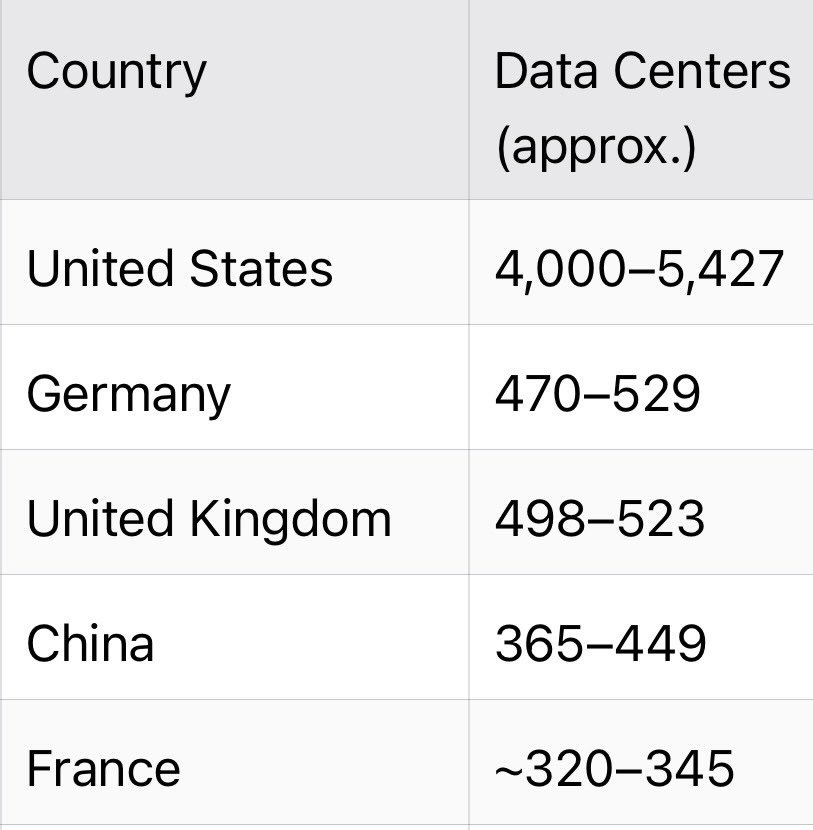
C.) Building Materials & Supplies is only the Datacenters. Not real growth. These aren’t individuals going to $HD or $LOW buying happily, remodeling, feeling good! No! They are datacenter expenditures. 🔻
Cooked books Hyperscaler Debt Issuance = False Data
Boys and Girls of all ages,
Listen to me carefully,
This is not a booming economy. NOT EVEN CLOSE!
Read an economic book, read these data sets, hell even read these balance sheets..
Things can keep going North and we need to Hope and Pray the consumer comes around. 🙏🏽 (History is not on our side)
But if not, this show will end, violently and fast. 🔻
Prepare with cash!
Get out of debt!
Focus on Work and Family! 🔥
You got this!
Keep going!
I believe in you!
🤝

2
727
May 14
🚨 RETAIL SALES 🚨
📚Class,
Gather around for another DDD (data deep dive).
Now on the surface she seems decent. A 0.5% match. But last MoM was revised down from 1.7% to 1.6%. Not the best but manageable.
Now, Lets get into the weeds shall we.
Look closely on this actual report:
Photo 1.) 🔻 Catch 22 here is this one thing and one thing only….
THEY DON’T ACCOUNT FOR RISING PRICES. (Inflation adjusted)
So they come out and tell you everything is good. We matched expectations, blah blah.
Yall, We barely beat last MoM Sales number with 0.6% Inflation in the same month.
If anyone had a brain they would do the math and remove inflationary measures, and if you do that you get -0.1% Retail Sales. NEGATIVE! ⚠️
Photo 2.) The calamity here is EVERYTHING is negative sales MoM … EVERYTHING‼️
except for 2 things..
- Gas Stations 🔻
- Building Materials 🔻
So what does this tell us?
A.) The consumer is DEAD!
B.) Without rising gas prices Gas Stations would have missed sales… and this number would have been <-0.2% 🔻
C.) Building Materials & Supplies is only the Datacenters. Not real growth. These aren’t individuals going to $HD or $LOW buying happily, remodeling, feeling good! No! They are datacenter expenditures. 🔻
Cooked books Hyperscaler Debt Issuance = False Data
Boys and Girls of all ages,
Listen to me carefully,
This is not a booming economy. NOT EVEN CLOSE!
Read an economic book, read these data sets, hell even read these balance sheets..
Things can keep going North and we need to Hope and Pray the consumer comes around. 🙏🏽 (History is not on our side)
But if not, this show will end, violently and fast. 🔻
Prepare with cash!
Get out of debt!
Focus on Work and Family! 🔥
You got this!
Keep going!
I believe in you!
🤝
1
1
4
1,641
May 13
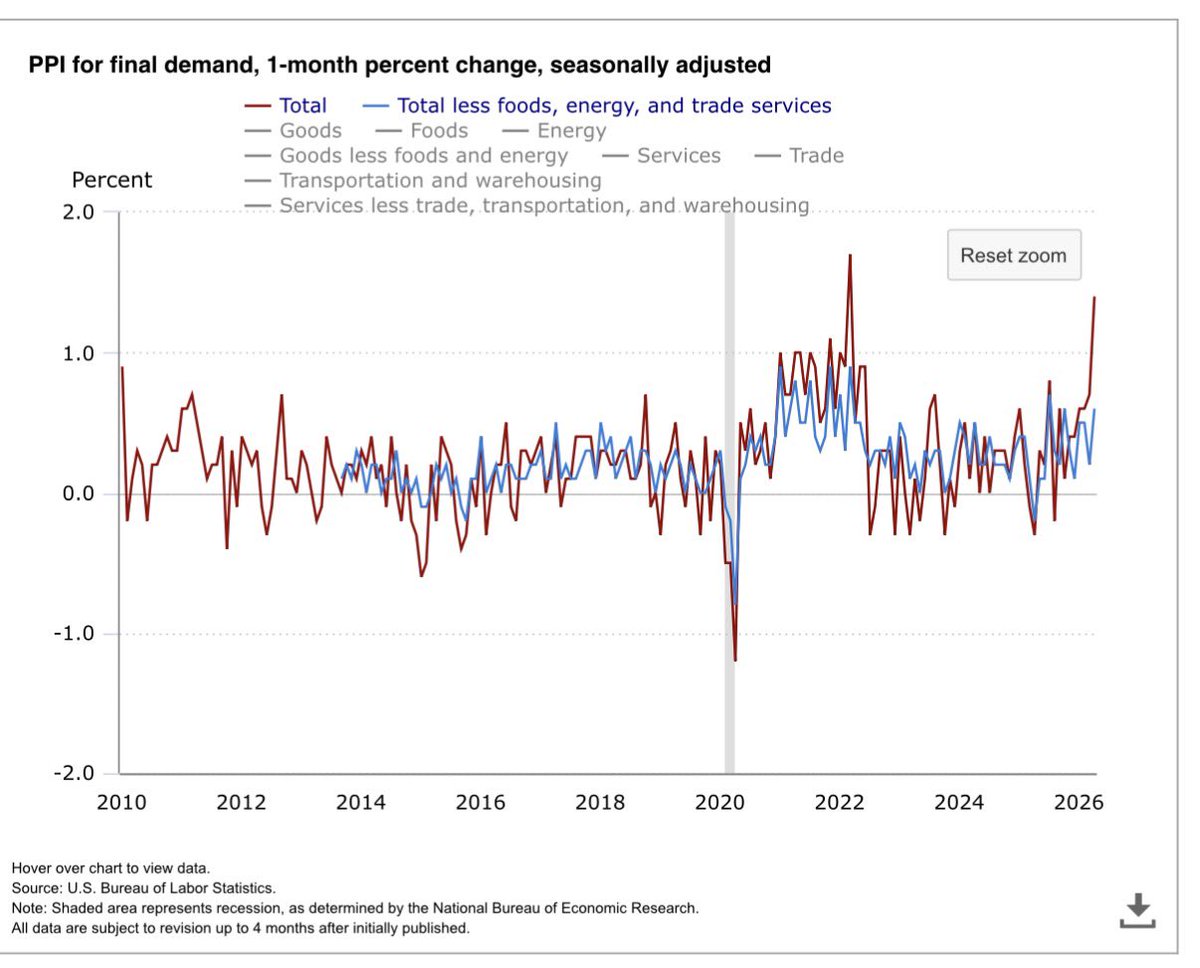
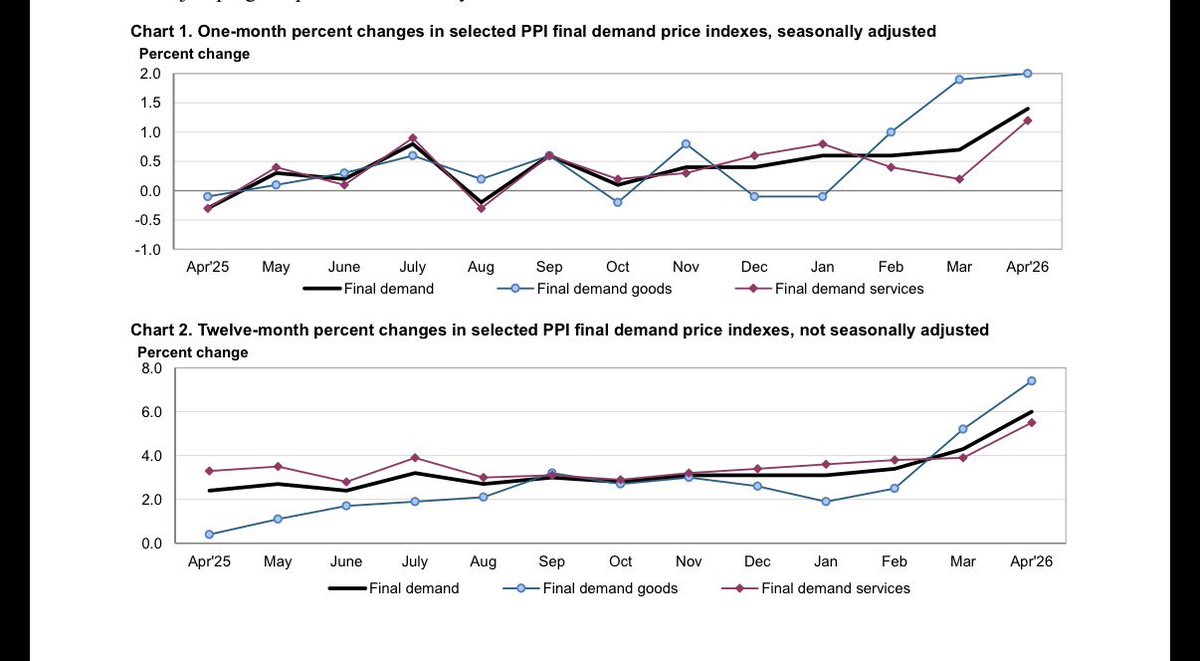
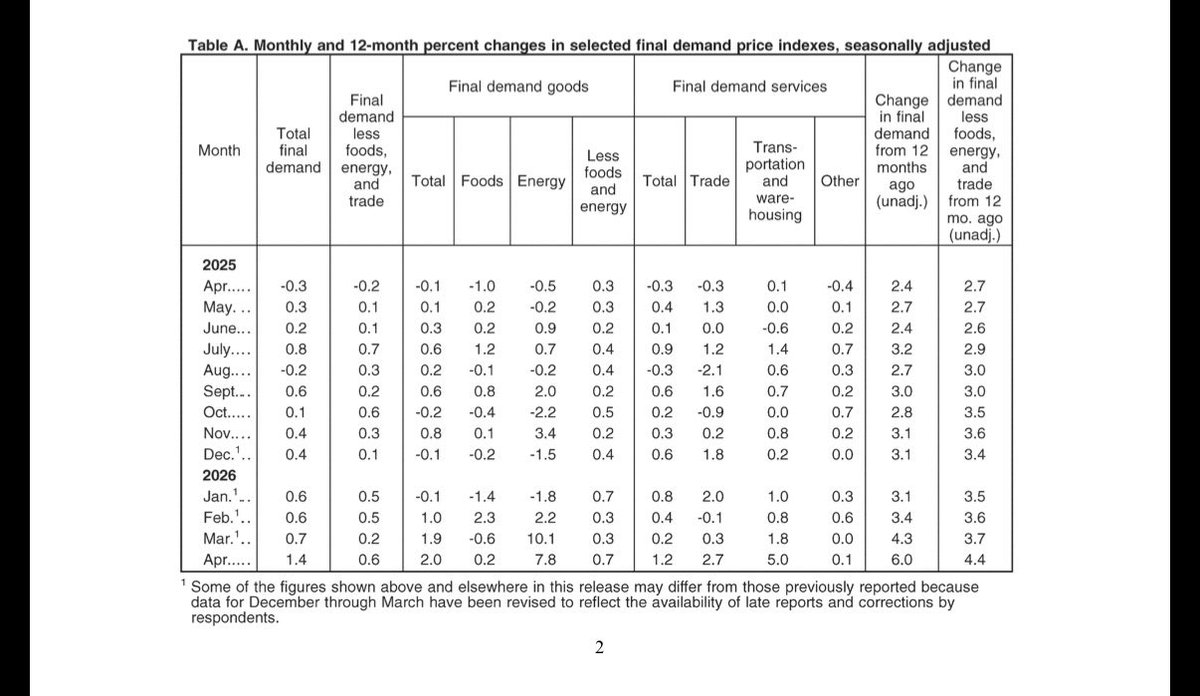
🚨 PPI Data
Oh Boy,
📚Class,
We got a fun one today.
LETS DIVE;
You’re probably thinking “Kap, I saw the headline, its bad, I already know this” and you’re correct but I’ll just share whats inside the report to see more details and possible implications. Photos always help perspective as well.
Photo 1.) PPI Final Demand MoM % Increase w/ Seasonally Adj.
A 1.4% increase = Annualized @ 16.8%. You can just see the chart increase and its a MONSTER! (Calamity will be below) 🔻
Photo 2.) Shows us not only Goods skyrocketing but also now Services. *remember PMI’s and SMI’s Services have recently missed expectations and almost in contraction territory*. Guys, the US Economy is a services based economy. This is going to hurt badly if changes aren’t made. 🔻
Photo 3.) Shows a breakdown of sectors in Goods & Services. Not much surprise except for 2.7% in Trade Services. Trade Services = marketing, storing, displaying, and making goods available for purchase. Is this Tariff related? No because Trade Services didn’t accelerate in 25’. Is it energy related? No, because it didn’t accelerate much in March (March energy PPI ran 10%). So what is it? My guess, Individuals feeling the heat on Margin and finding a good excuse to raise prices now to hide it with higher energy. No bueno, this will start to reflect on CPI (again) next month. 🚨
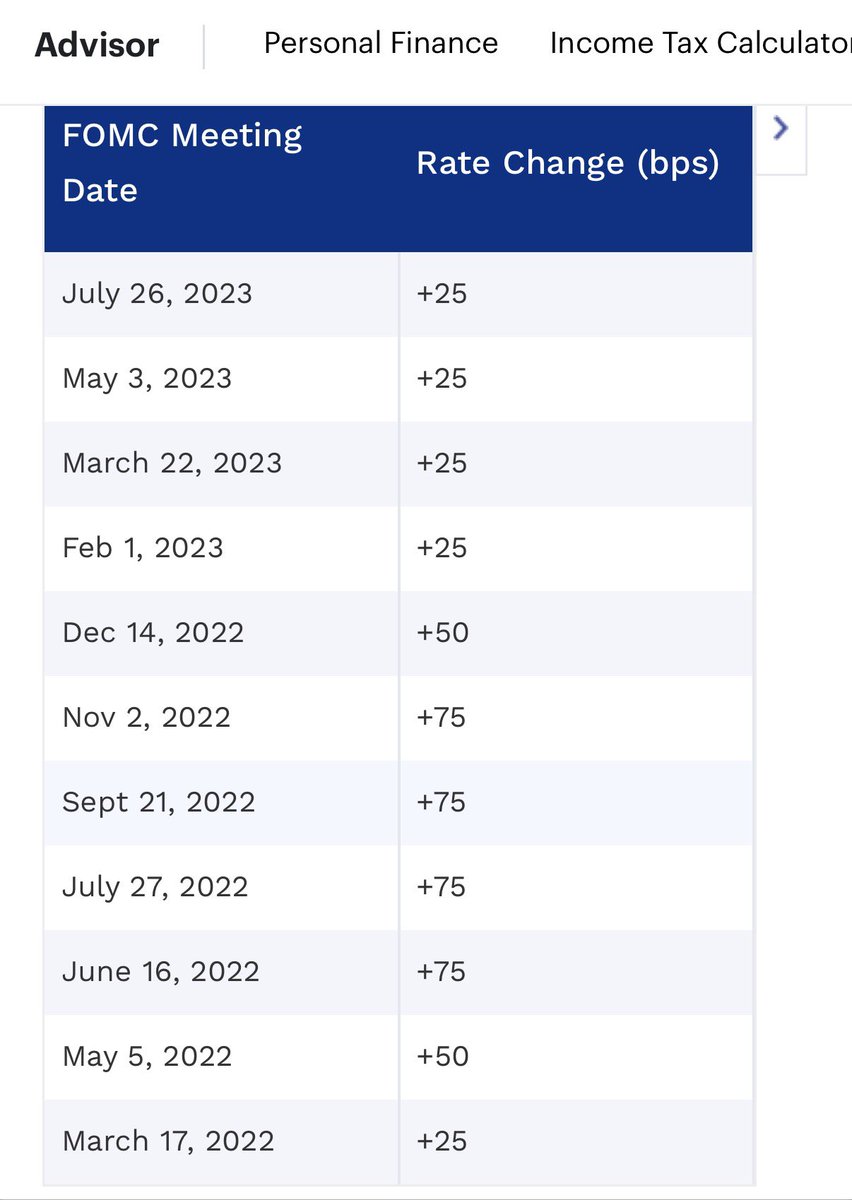
Photo 4.) Ah, I love HISTORY!
Comments in this PPI report all had one thing in common.
“This is the worst since March of 2022’ ⚠️
Look what we have here!
475 bps of Fed Hiking YoY after our March Catastrophe of Inflation. 🔻
Boys and Girls,
Listen closely,
This doesn’t end well for anyone.
If the Fed were to decide to Cut rates it would send 20yr Yields to >8%
The Feds hands aren’t tied any longer. They will need to hike if things to turn better for inflation within 30-60 Days.
Save up Cash!
Focus on Work! Focus on building a future for yourself! Show up early, and stay late. Work hard! 🔥
Focus on Relationships and Family!
Thanks for tuning in.
You got this!
🤝
1
4
15,797
May 12
🚨 CPI (Inflation Data)
Class,
Gather around now.
We have some appalling data to go over.
Lets dive;
So, at a glance of the headline CPI release you might be thinking. “Oh, energy is up MoM, duh”.
That is but a taste of what is truly under the hood.
Notice a few things from the actual report that is accelerating higher.
- Electricity! ⚡️ if you lived in a bubble and only listed to a few A.I. datacenter heads. Then you would think. No, no way my electricity bill will be higher. They promised it wouldn’t. WRONG. ⚠️ 2.1 % just last month. If you annualize it then its >25%. 🔻
Is this what yall want?
I doubt it.
- Then the hidden calamity of Shelter increase. ⚠️0.6% MoM
7.2% Annualized. 🔻
If you have been reading the headlines of home prices declining you might would have thought this would be trending down. Its not. Its trending up. Why might we ask?
Because the Praxeology of individuals needing shelter. If people aren’t buying homes, then they are renting. If more people are needing to rent then rent goes up. Supply/Demand imbalance. Home prices can come down but rent can go up. Why would rent go up?
DATACENTERS!
- increase in Electric bills 🔻
- increase in taxes 🔻
- increase in gas bills 🔻
Im here to teach you how to read a CPI report but there’s an underlying issue..
These Hyperscalers need to become profitable on their own. They need to fund their own electricity and water and debt. (Desalination plants, bring in salt water)
I don’t have the answers but its clearly NOT working for us citizens.
We most definitely do not want to end up bailing out these malinvestments.
Focus on your career!
Get out of debt!
Care for our future!
Care for our youth!
Keep fighting the good fight! 🔥
🤝

2
7
5,234
May 8
📚 Class,
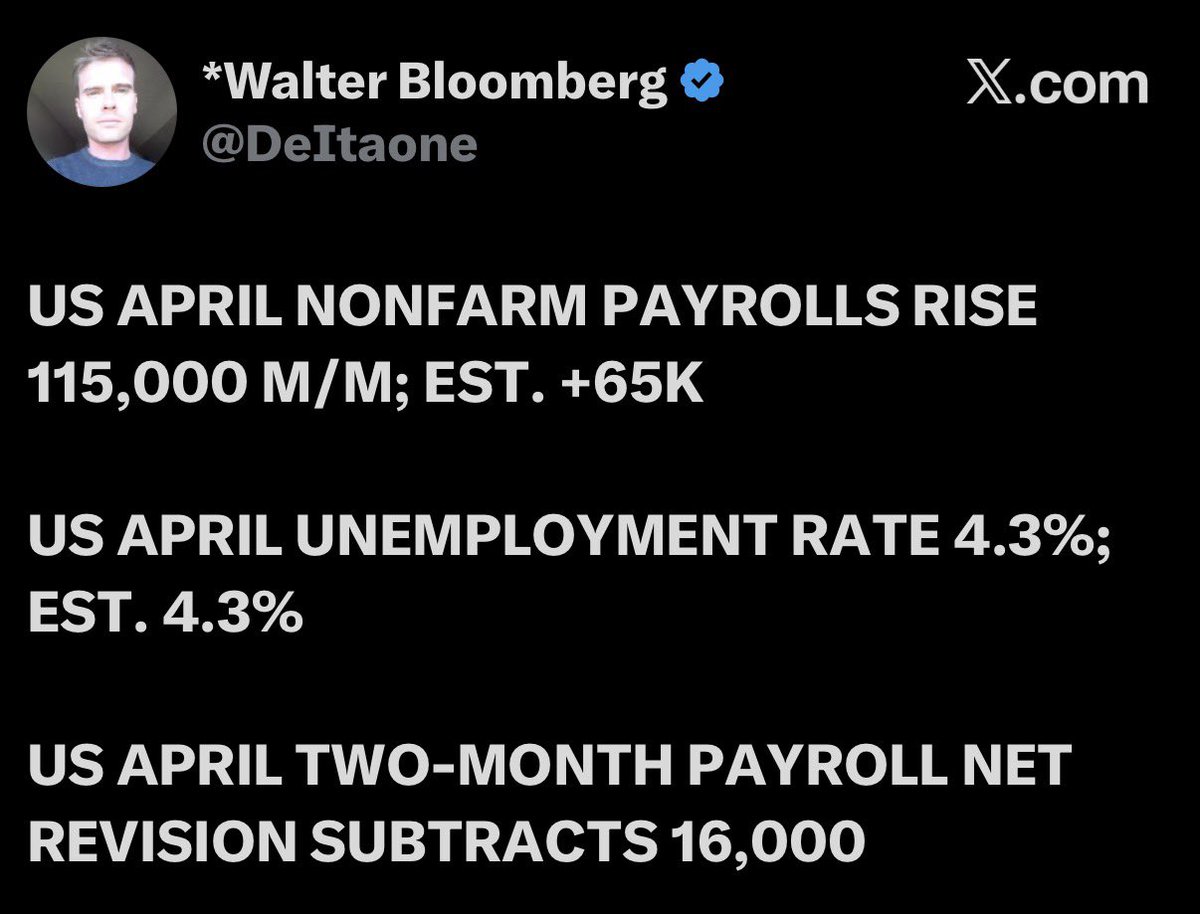
🚨Today we have an interesting phenomena on reports of Non-Farm Payrolls.
You might be wondering a few things:
1.)Why didn’t unemployment rate decrease?
2.)Why are people being paid less? 3.) What is the individual telling us about the economy?
Lets dive; 🔥
1.)
- Unemployment Rate takes into account 2 different surveys. Household & Establishment. (Lot of people believe the household to be more accurate)
- Household survey still shows 7.4 Million Unemployed individuals. Holding steady the 4.3%. 🔻
- Also we need to take into account this damning line of part-time jobs and the fact this whole NFP number could have been (-) negative without part time. Read in quote “ The number of people employed part time for economic reasons increased by 445,000 to 4.9 million in April. These individuals would have preferred full-time employment but were working part time because their hours had been reduced or they were unable to find full-time jobs.”
Ouch!!!! That stung reading. 🔻
- Also stated this concerning report, read in quote “The number of people jobless less than 5 weeks increased by 358,000 to 2.5 million in April.” 🔻
🚨 This is a disaster.
2.) People are being paid less because margins and free cash flow are decreasing rapidity with High Cost of Sales, High Cost of Goods, and High Yields! 🔻
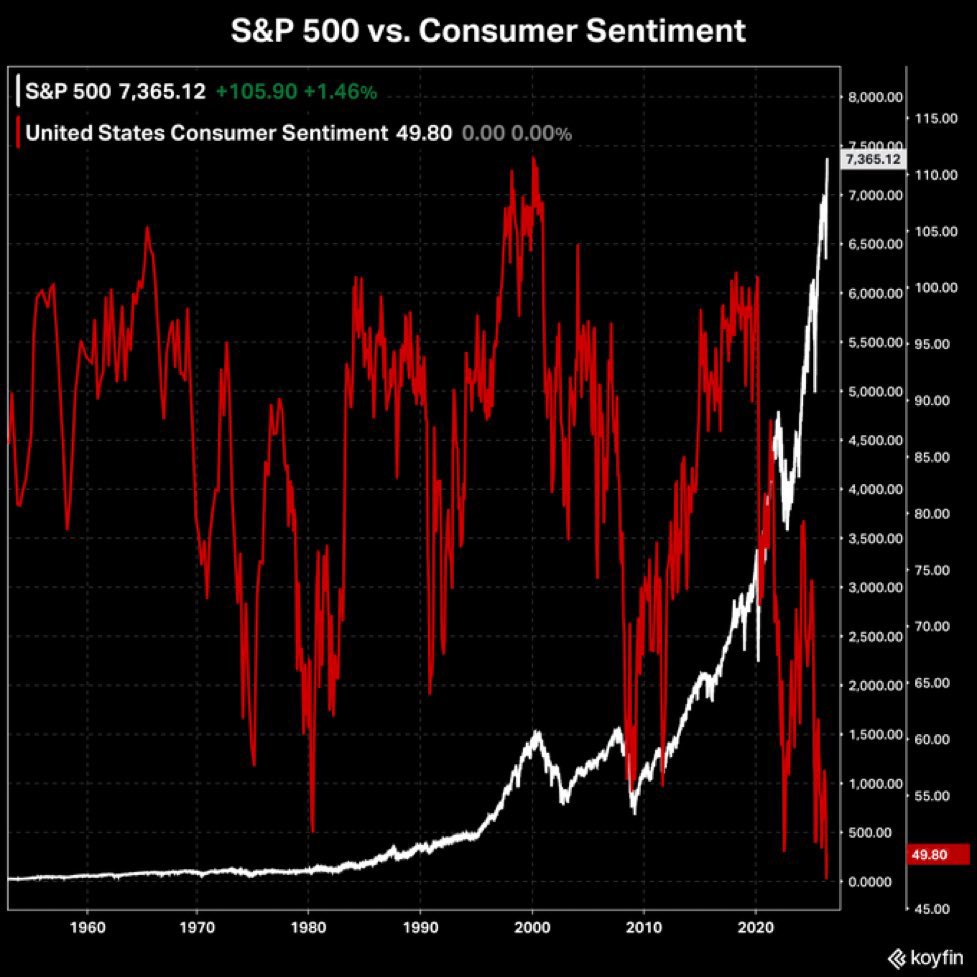
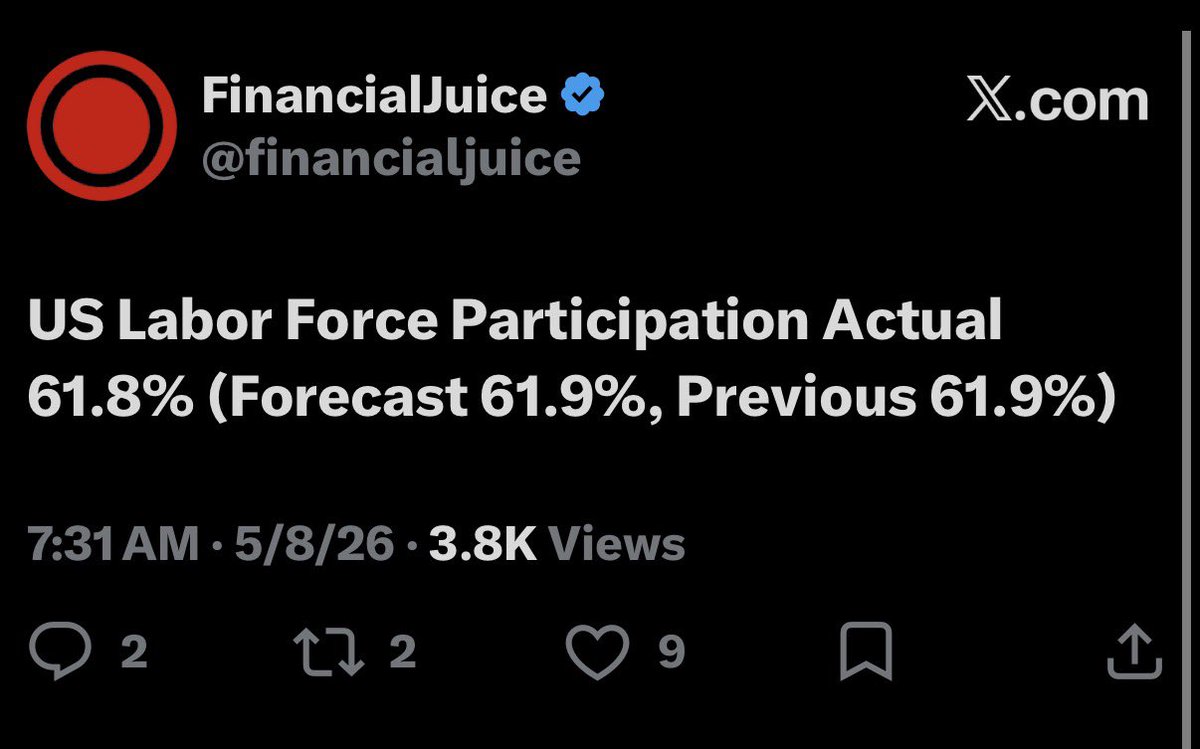
3.) The last photo shows the Individual Consensus/Feeling.
Not too hot, and a matter of fact.. VERY BAD! Notice the break in flow from the $SPX / $SPY / $QQQ .
Guys this won’t last. One will correct… and I have hunch as to which one since this NFP was no bueno..
Just look at all the layoffs announced just this week alone.
Stop listening to these “experts” that don’t know how to read data or a balance sheet.
They make money off of you by selling you hopium and Debt! ⚠️
*Bonus: If participation increases even slightly the unemployment rate will be >5% in a matter of 1-2 reports*
Im glad so many of you are making money. Set some trailing stops, de-risk, this show will not go on forever. Pay off debts!
Focus on You, Your Family, and Your Career. 🔥
You got this! 🤝

3
3
12
6,570
May 8
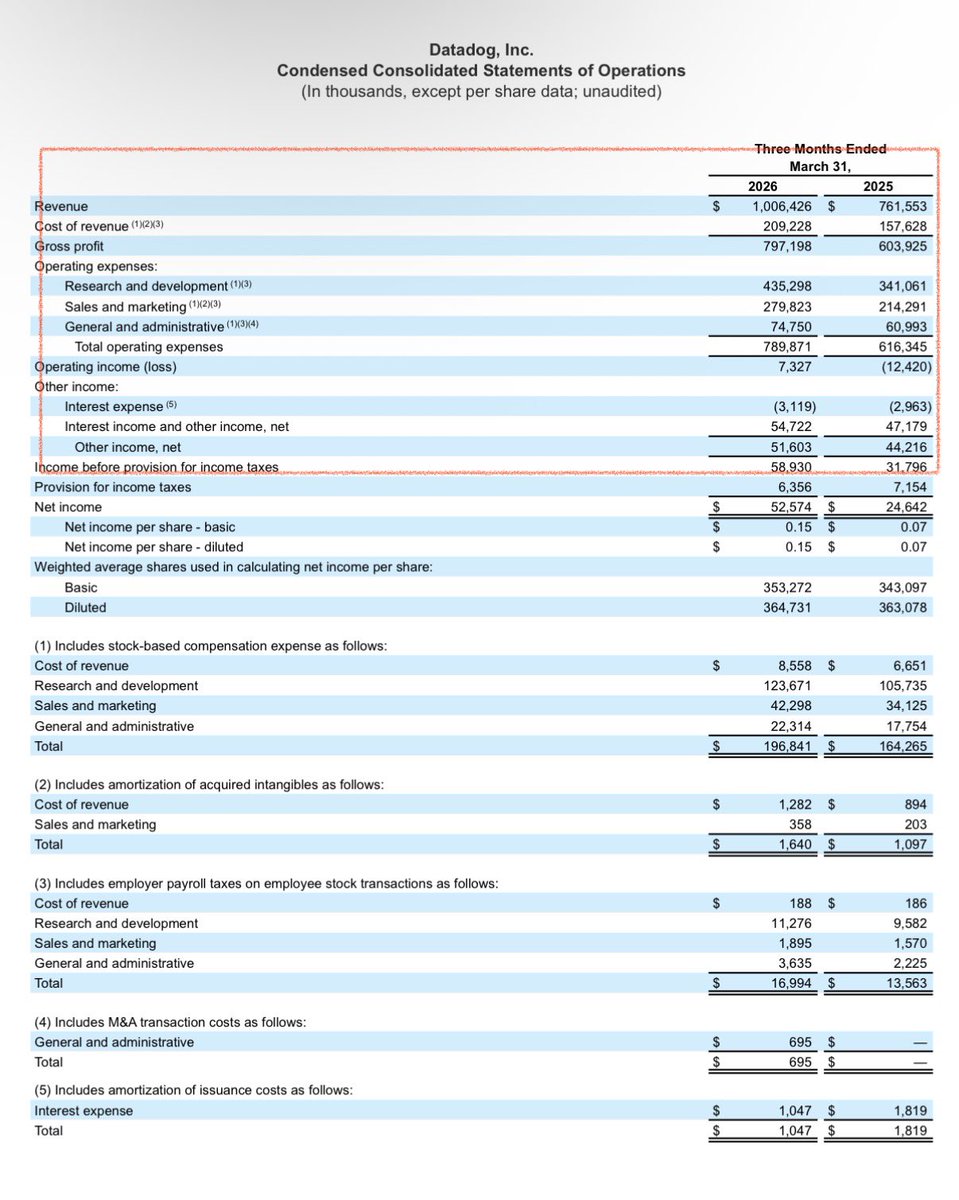
🚨 $DDOG
Major issues with this $67 Billion SaaS Company.
📚Class,
Lets dive in!
First off, Does anyone even read balance sheets anymore?
Or do math for that matter?
Photo 1.) Don’t look at $1 Billion in revenue. Look at Net Income of only $52 Million. Also increasing R&D, and SG&A. Interest expenses rose as well. (Debt is a business’s nightmare)
- Revenue only grew <5% ⚠️
- R& D rose >4% QoQ🔻
- Sale & Marketing rose >5% QoQ
(So as of now Cost of Sales is out pacing revenue growth) 🔻
- The Winner on this photo goes to massive amount of interest expanse of >19% (very dangerous rising this fast without growth acceleration)🔻
Photo 2.) Tells a story of great concern. You can see that this company could also be classified as a Brokerage before a SaaS with their Marketable Securities more 7x their Net Income. Also they can’t pay their debts.
- Their $4.3 Billion in Marketable Securities dwarfs their $52 Million in Net Income. (They should focus on their business improving rather than gambling) 🔻
- Then comes a major calamity of not being able to pay their debts. Cash & Cash Equivalent = $426 Million and Total Current Liabilities = $1.65 Billion 🚨
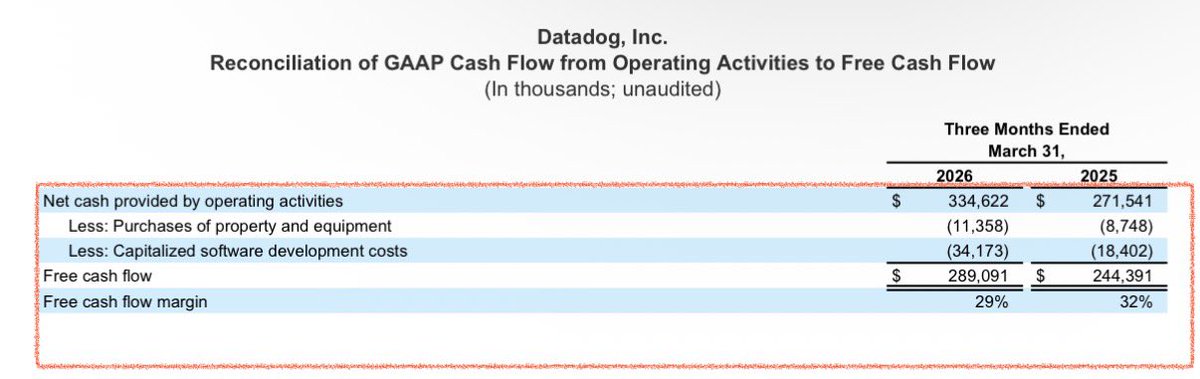
Photo 3.) We can clearly see declines in Free Cash Flow and decreasing Cash margins.
- FCF declined from Q4 Earnings from $291 Million to $289 Million QoQ (had to pull Q4 report, not on YoY photo) Not so bad as other mentioned. But still a decline with increasing revenue.
- more concerning is the FCF Margins decreasing from 32% to 29%. (So spending more, for less) 🔻
What’s the summary here Kap you might ask?
- Can’t pay Current Liabilities/Debts
- Increasing Cost out pacing Net Income growth
- Too much gambling
- Free Cash Flow is declining
DDOG @ $188 means:
- 78 x Forward P/E (SaaS industry likes 35 x Forward ) 🔻
- 231 x P/FCF (my favorite, and industry is around 40 x) 🔻
Fair Value sits at $90/share
If I were them, I would dump their gamblings on marketable securities and pay off debt so their interest stops rising uncontrollably. That would give them ample cash to dial in better margins. 🤝
Thanks for reading. $SPY $QQQ $TLT $VIX $APP $CRWD $PLTR $ADBE $MSFT $NOW $ORCL $NET
Remember to keep going, work hard, and love harder. 🔥

2
4
12
9,240
Apr 30
📚 Free Markets at WORK
Class;
What is the biggest headline out of all of these Earnings?
It’s not CAPEX increase/decrease.
It’s not Top and Bottom Beats.
It’s Capitalism working in the most far-reaching economy on the globe.
It precisely is the fact every MAG7 (even smaller companies) are now entering into a phase to design/produce their own chips. A commodity. A cycle is upon us.
This is how Free Markets work:
- Greater Price Discovery
- Increase in Productivity
- Lower Prices
A reason the Cannery, $NVDA , was down >4% today. ⚠️
$APPL $GOOG $META $MSFT $AMZN $TSLA
🤝
1
5
306
May 6
📚 If you’re not sure what $OWL is, then I have a theory to offload on you.
This will be the Canary in the Coal Mine for Private Credit. ⚠️
Now you might be asking why Private Credit would be such a disaster in relation to Blue Owl?
First off, it’s hard to find publicly traded marketable securities attached to Private Credit. It’s called ‘private’ for a reason. Blue Owl is a great exception and represents a reflection into the dark debt world no one can gauge.
Lets dive:
- Private Credit is responsible for nearly 3 Trillion in Datacenter build outs debt issuances globally.
- Blue Owl has a $29 Billion joint venture with $META (all debt supported by PIMCO)
- if Blue Owl goes, META’s $150 Billion in Capex goes. 🔻
- If META’s $150 Billion goes, then there directly goes Earnings for $NVDA (Blackwell/Rubin) , $AMD (MI450’s), $AMZN (AWS), $GOOG (TPU’s) 🔻
- If earnings for said companies deteriorate even the slightest then its all over. Due to the massive circle-jerk of funding. “I’ll invest in you, if you buy me, and if you buy me, I’ll buy you, then you can invest in me”. It all will unwind. They will all be blaming each other.
- Look no further than AMD’s miss on Datacenter Net Income… if this isn’t flashing in your face then this private credit implosion sure will. Its costing more money, more water, and more electricity all for less revenue. 🔻
I’m not a perma Bear, I was bullish in 2023. $SPY $QQQ $VIX $TLT
I just see the writing on the wall!
Its screaming CAUTION ⛔️
Focus on work, focus on paying off debt, and stay out of margin.
You got this!
Stay positive and keep going! 🔥
Thanks for tuning in again. 🤝
May 6

*BLUE OWL CAPITAL CORP 1Q INVESTMENT EPS 32C VS. 41C Y/Y
*BLUE OWL CAPITAL CORP FALLS DROPS 5%; TOTAL INVSMT INCOME MISS
1
4
18
20,765