
Bitcoin, the bank is coming
Joined April 2020
- Tweets 3,098
- Following 296
- Followers 1,263
- Likes 763
431 Photos and videos


Pinned Tweet

May 13
🚨 BGeometrics Signals updates are now also published on:
📢 Telegram
t.me/bgeometrics_signals
⚡ Nostr
primal.net/p/npub1hvuxjwcnlp…
We will share Bitcoin on-chain alerts, market signals, and advanced blockchain metrics in real time.
2
215
Jun 11
The countdown for BIP-110 is live as signaling officially starts. 🛠️
Check out the blog for the full scoop: bgeometrics.com/blog/2026-06…
Stay on top of node consensus and miner activation metrics with daily updates from API BGeometrics.
33
Jun 10
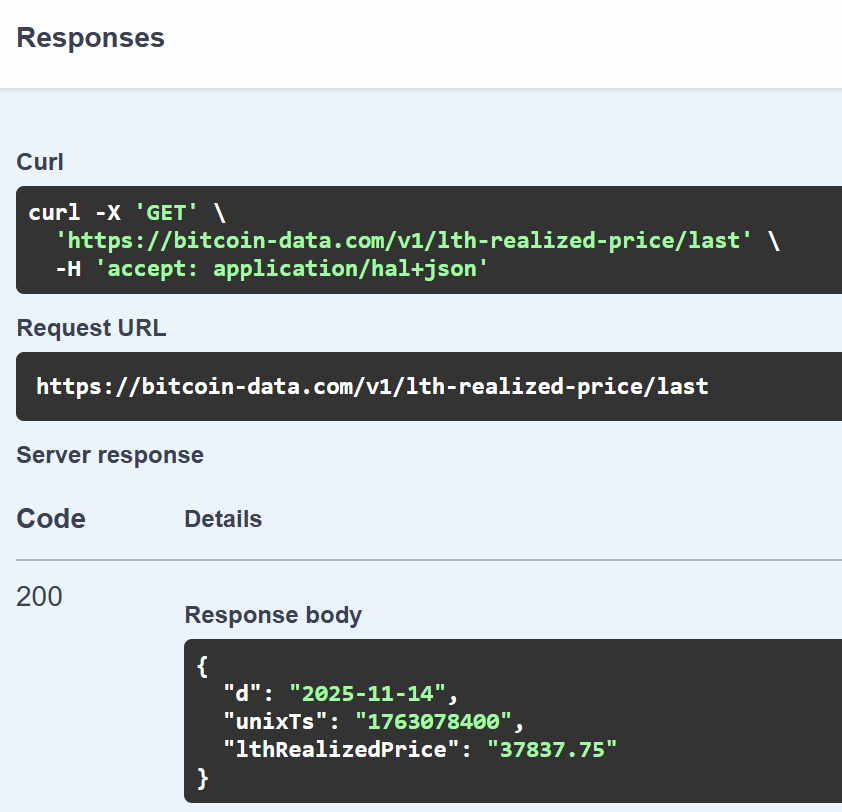
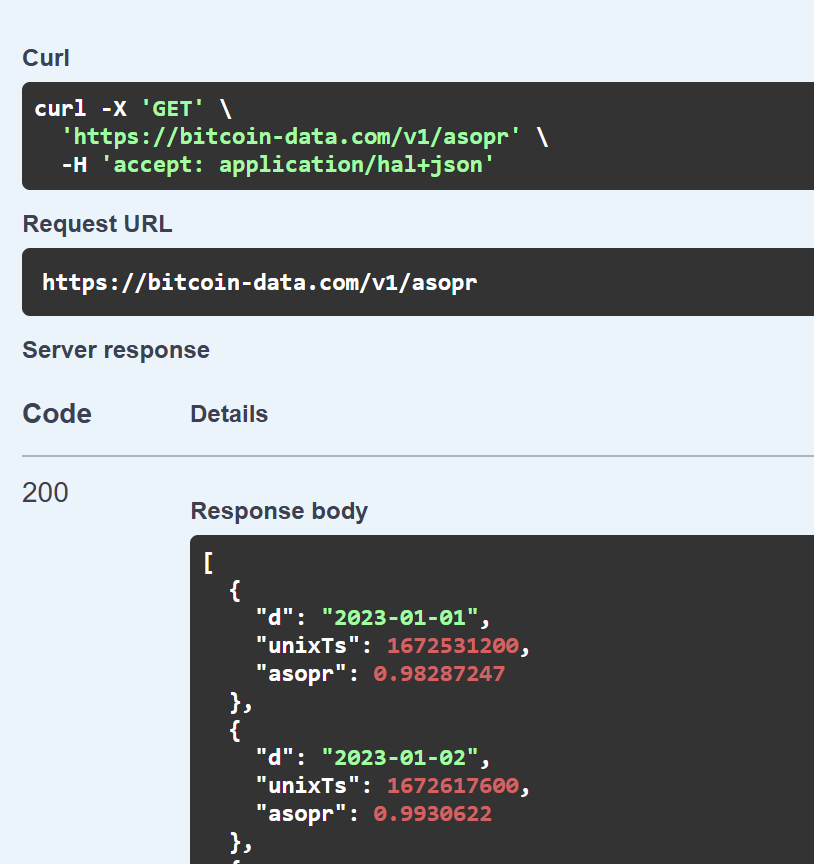
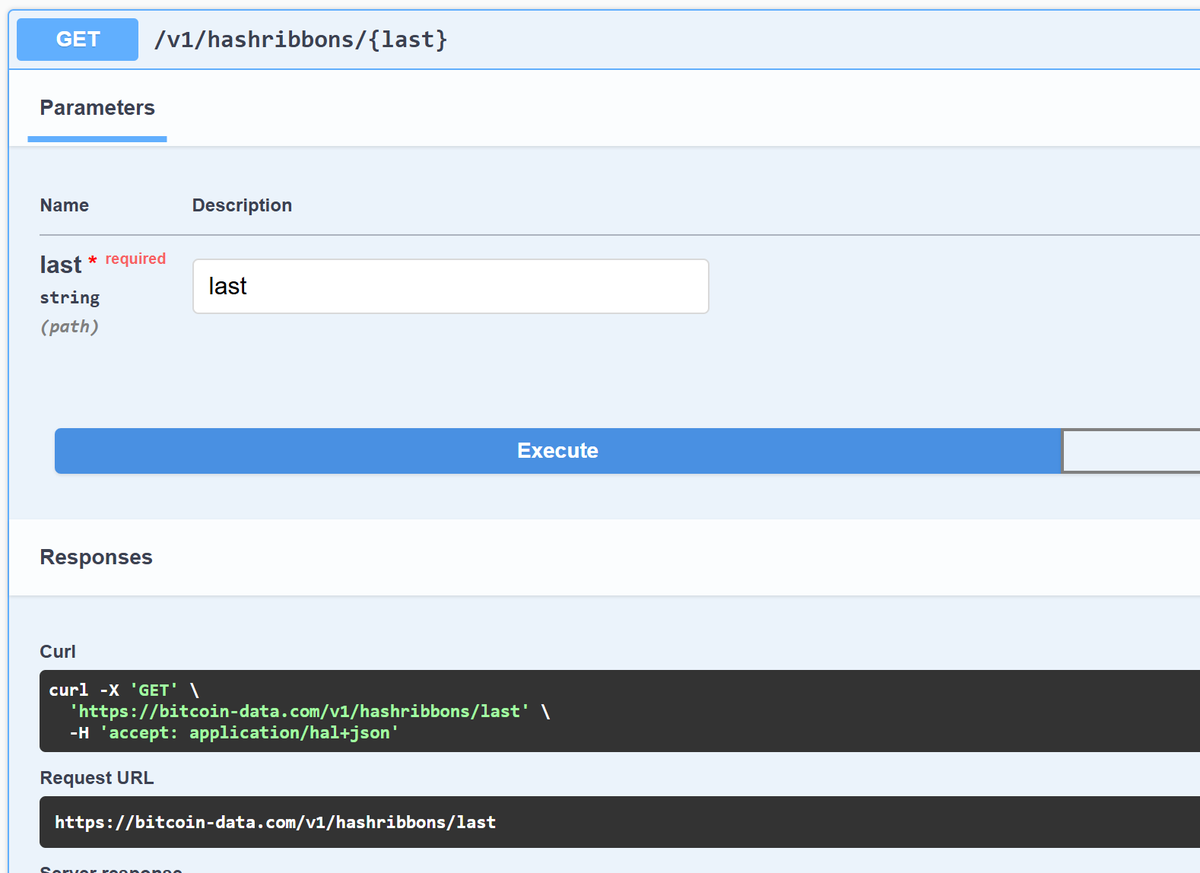
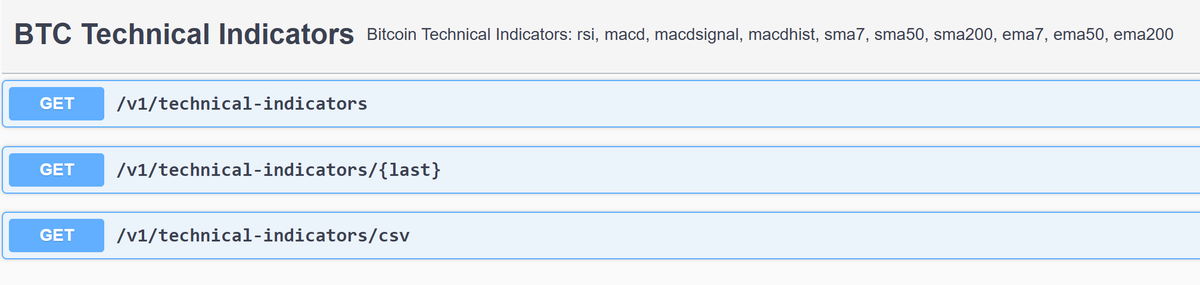
📊 New BGeometrics API endpoint now available!
Track the daily number of Bitcoin blocks signaling #BIP110 directly from our API.
🔗 Endpoint:
api.bitcoin-data.com/v1/bip-…
Perfect for monitoring miner signaling trends and following BIP-110 adoption in real time.
#Bitcoin #BitcoinKnots #BIP110 #OnChainData #API #BGeometrics
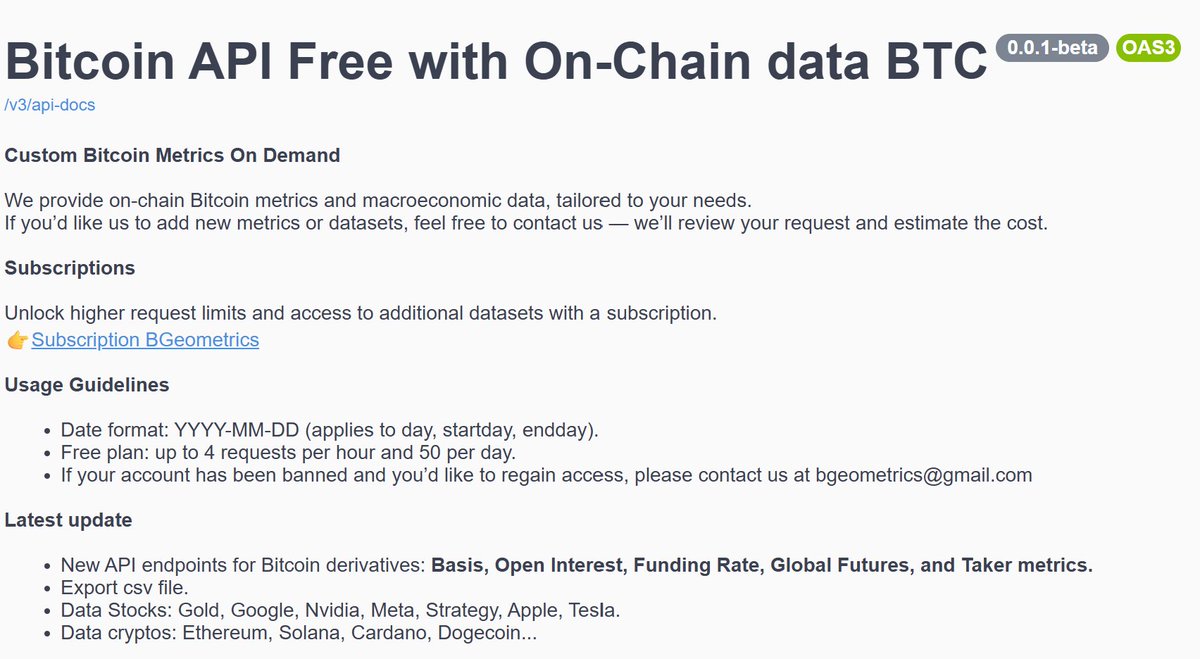
API api.bgeometrics.com/scalar.h…
1
1
64
Jun 9
📊 New AI Report Powered by BGeometrics Data
This report provides an in-depth analysis of the Value Days Destroyed (VDD) Multiple and its behavior over the last 12 months, with insights integrated throughout every section of the report.
Discover how long-term holder activity has evolved and what it may reveal about Bitcoin market cycles.
🔗 portal.bitcoin-data.com/bgus…
#Bitcoin #BTC #OnChain #BGeometrics #VDD #CryptoAnalytics #BitcoinData
1
54
Jun 8
What happened on-chain during the last 7 days of Bitcoin activity? 👀
We used AI and our proprietary Bitcoin on-chain API to analyze the latest blockchain data and identify the most important signals affecting the market.
From holder behavior and profitability metrics to network activity and sentiment indicators, the report provides a data-driven view of Bitcoin's current state.
📈 Full report:
portal.bgeometrics.com/bguse…
#Bitcoin #BTC #OnChainAnalytics #Crypto #Blockchain #DataScience
1
1
1
73
Jun 8
Bitcoin Weekly Report — 01 Jun–07 Jun 2026
BTC $63,290 ▼ 11.4%
NUPL 0.160 — Fear
MVRV 1.190
SOPR 1.003 (above 1.0)
Fear & Greed 12 — Extreme Fear
• NUPL transitioned from Hope → Fear
• SOPR crossed above 1.0 (0.988 → 1.003) — sellers in profit
bgeometrics.com/reports/week…
56
Jun 7
🚨 Alert Open Interest Futures! Open Interest ($29355088150.4701) is at its lowest level in the last 30 days.
🔹Potential bearish signal.
#Bitcoin #OnChain
charts.bgeometrics.com/open_…
1
69
Jun 5
📊 New Bitcoin On-Chain Report Available
This analysis puts a special focus on two key market drivers:
🔹 BTC Price Dynamics
🔹 Fear & Greed Index Evolution
portal.bgeometrics.com/bguse…
Discover how market sentiment and price action interact, identify potential turning points, and gain deeper insight into the current Bitcoin cycle using on-chain data.
#Bitcoin #BTC #OnChain #FearAndGreed #CryptoAnalysis #BitcoinAnalysis
68
Jun 3
🚨 Fear and Greed Index Alert! Fear and Greed Index BTC (11) is at its lowest level in the last 30 days. 🔹Potential bearish signal in the short term.
#Bitcoin #OnChain
charts.bgeometrics.com/fear_…
1
67
Jun 2
📊 New Bitcoin Report: Miner Sell Pressure (Last 3 Months)
How much BTC have miners been selling relative to their reserves over the past quarter?
Our latest report analyzes miner behavior, reserve dynamics, and potential implications for Bitcoin's market structure.
🔍 Key insights:
• Miner sell pressure trends
• Reserve accumulation/distribution
• Historical context
• Market impact assessment
Read the full report 👇
portal.bgeometrics.com/bguse…
2
60
JSimon retweeted

May 29
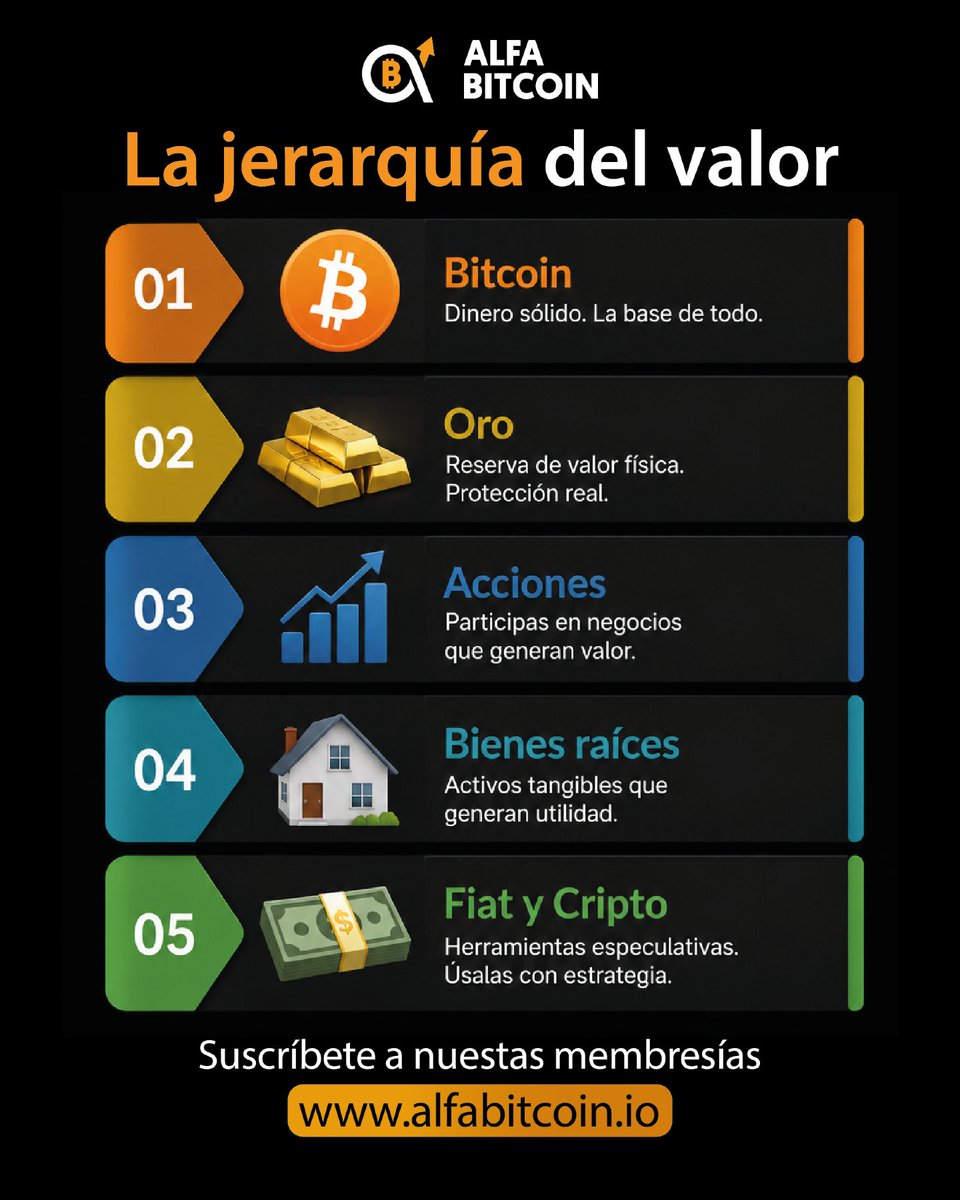
🚨 No todos los activos sirven para lo mismo.
Construir patrimonio no es solo comprar cosas que suben… es entender qué función cumple cada una. 👀
Los que entienden esa diferencia suelen jugar un juego distinto. ₿📈
2
7
25
774
May 31
📊 New Bitcoin reports are now available on BGeometrics.
Daily, weekly and monthly on-chain reports including:
🔹 NUPL
🔹 SOPR
🔹 MVRV
🔹 VDD Multiple
🔹 Market sentiment zones
🔹 Bitcoin price performance
A quick way to monitor Bitcoin market structure and on-chain trends in a single report.
Read the reports here:
portal.bgeometrics.com/publi…
2
67
JSimon retweeted

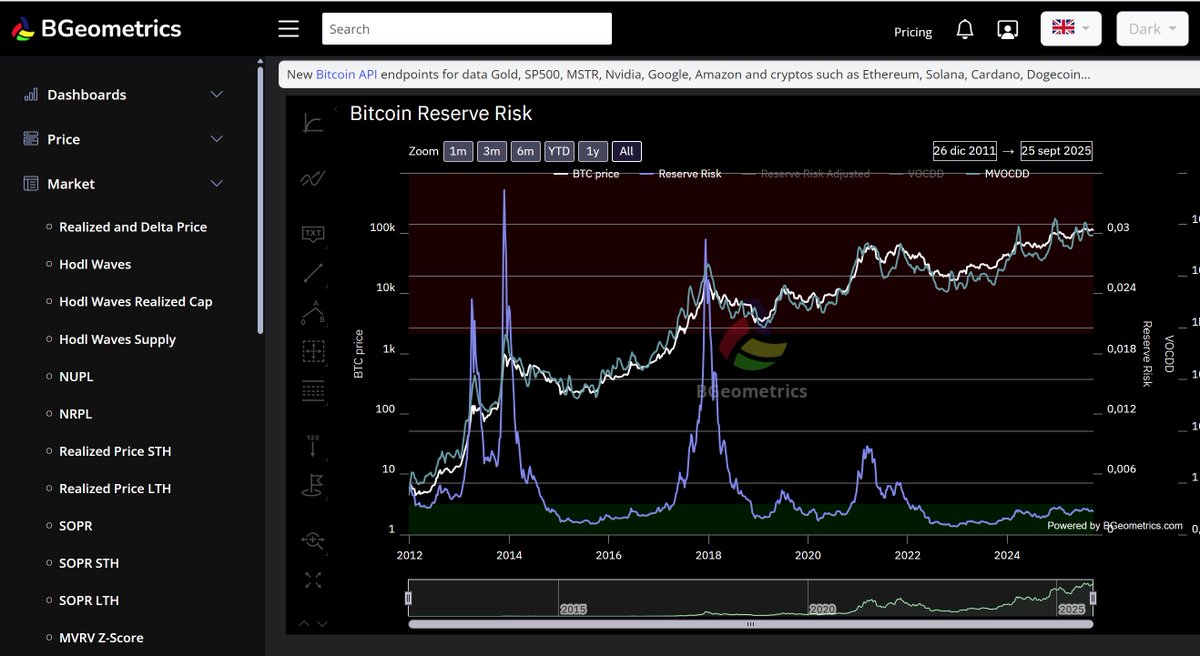
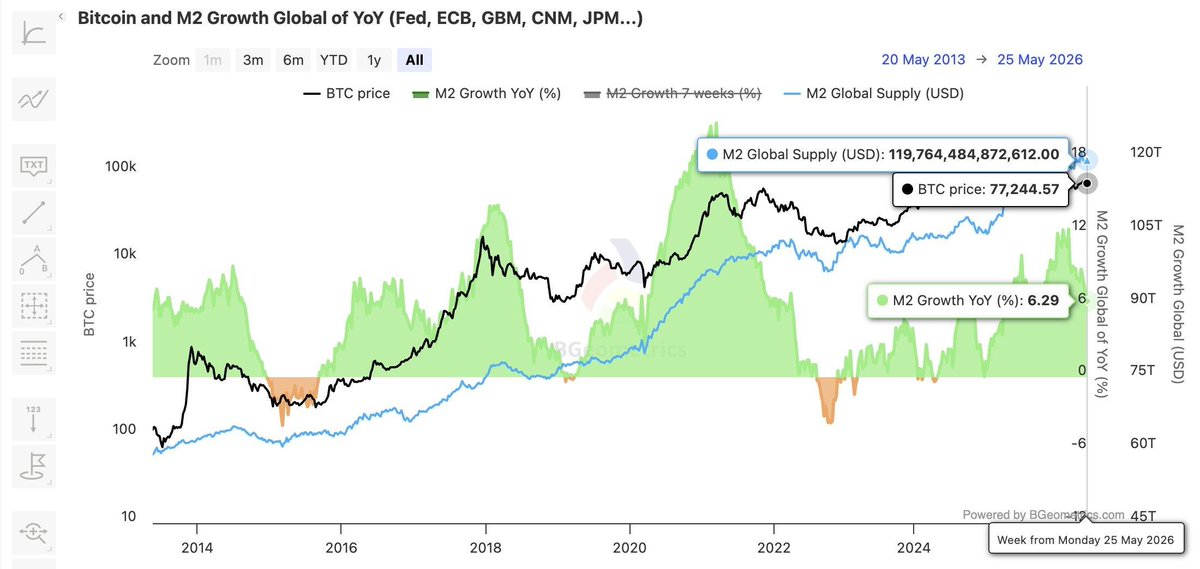
📊 MACRO CRYPTO / LIQUIDEZ GLOBAL
El argumento que está circulando es claro:
> “Las criptomonedas están bajo rendimiento porque han perdido sus dos principales motores: el oro y la IA.”
Pero cuando lo descomponemos, la realidad es más matizada.
⚫ EL ARGUMENTO DEL ARTÍCULO
▪️ Se afirma que BTC ya no captura el “trade de devaluación monetaria”
→ ese flujo habría migrado al oro
▪️ El “trade de crecimiento/innovación”
→ habría migrado a infraestructura de IA (Nvidia, chips, cloud, etc.)
▪️ M2 global en máximos (~120T$ según estimaciones citadas)
▪️ BTC alrededor de ~75.000$ sin reaccionar proporcionalmente a la expansión de liquidez
⚫ VERIFICACIÓN REAL (IMPORTANTE)
1️⃣ M2 global
▪️ No existe una cifra única y universal de M2 global en tiempo real
▪️ Los ~119T$ dependen de agregaciones privadas y conversiones USD ✔️ Tendencia correcta: expansión monetaria global en máximos históricos
❌ Precisión exacta: discutible según metodología
2️⃣ BTC vs liquidez
▪️ Es cierto que en este ciclo la correlación con M2 es menos directa a corto plazo
▪️ Pero históricamente la transmisión de liquidez a BTC va con delay (meses, no días)
3️⃣ Rotación hacia oro e IA ✔️ Parcialmente correcto:
▪️ Oro ha capturado flujo macro como hedge geopolítico
▪️ IA ha absorbido el “risk-on growth trade” ❌ Pero no es una “pérdida estructural” de crypto, sino una rotación de narrativa temporal
⚫ LECTURA MÁS PRECISA (LO QUE REALMENTE ESTÁ PASANDO)
1️⃣ La liquidez NO ha desaparecido
→ se ha fragmentado entre múltiples “vehículos de narrativa”
2️⃣ Crypto no pierde capital global
→ pierde prioridad marginal en el flujo especulativo institucional
3️⃣ BTC está pasando de:
▪️ activo “high beta liquidity trade” → a activo macro más lento y más estructural
⚫ CONCLUSIÓN ESTRATÉGICA
El error es asumir que los “trades macro” son exclusivos.
En realidad:
▪️ Oro, IA y BTC compiten en diferentes horizontes de tiempo
▪️ La liquidez global no se ha ido de crypto
▪️ Se ha redistribuido por narrativa, no por desaparición
🧠 LECTURA FINAL
No es que crypto haya perdido sus motores.
Es que ahora compite con más narrativas macro simultáneas que en ciclos anteriores.
Y eso cambia la velocidad, no el destino.
¿Crees que BTC está perdiendo relevancia macro o simplemente entrando en una fase más lenta de absorción de liquidez?
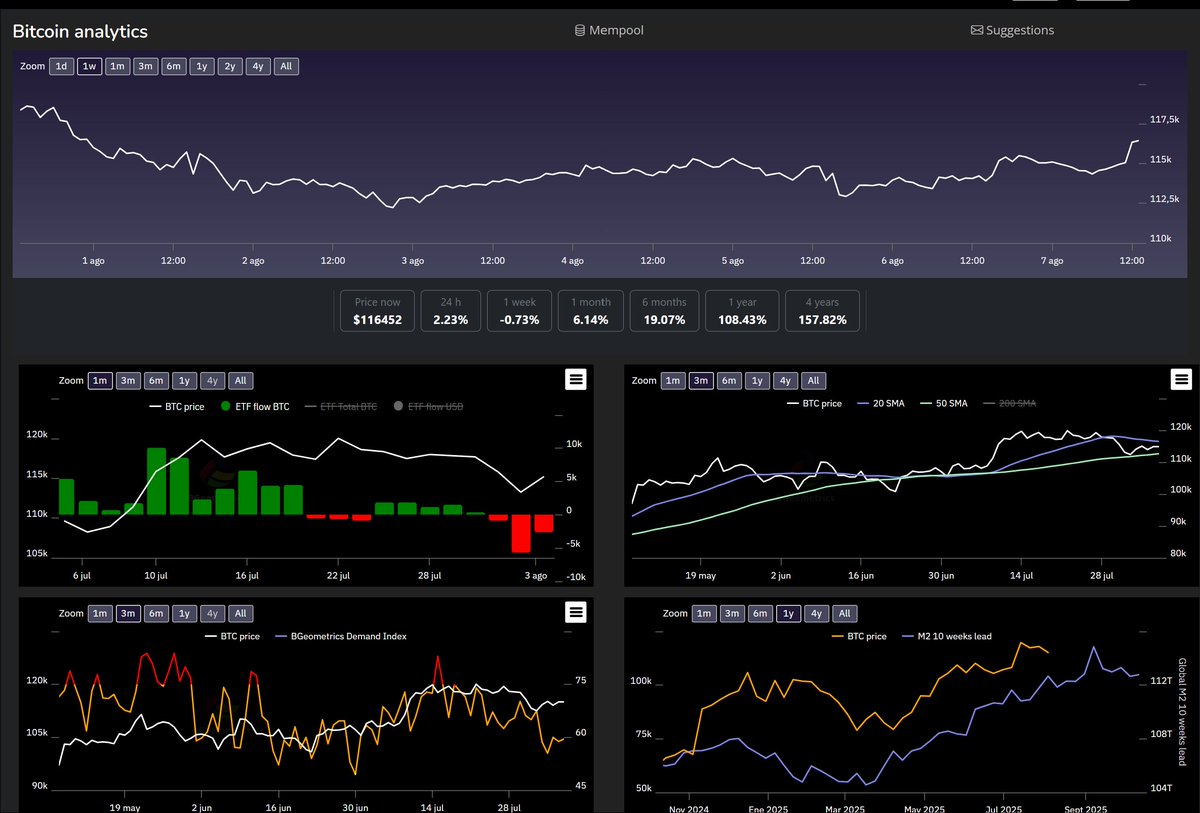
PD. El gráfico es de @BGeometrics por si quereis ojeando, está bastante bien la web.
#Bitcoin #Crypto #Macro #Liquidity #Gold #AI #Markets
1
5
105
JSimon retweeted

May 30
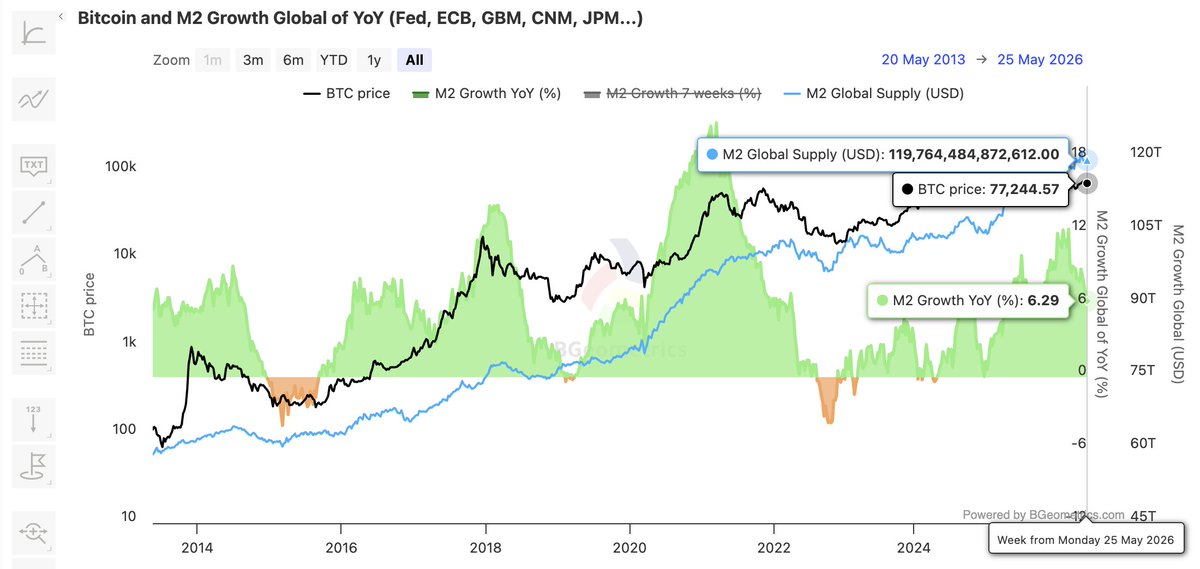
The crypto underperformance debate keeps missing the actual mechanism. It's not just less liquidity. It's that crypto lost both trades it used to own.
1. The monetary debasement trade went to gold
2. The growth/innovation trade went to AI infra
Global M2 supply just hit a record $119.76T while bitcoin:native is sitting at ~$75K, which is nowhere near where past M2 expansions would have dragged it.
The liquidity has showed up but it just got expressed in other markets. Crypto is being bypassed because the trades it used to win are now being run elsewhere.
h/t to @BGeometrics for the data
11
1
24
868
May 27
🚨 Fear and Greed Index Alert! Fear and Greed Index BTC (25) is at its lowest level in the last 30 days. 🔹Potential bearish signal in the short term.
#Bitcoin #OnChain charts.bgeometrics.com/fear_…
1
56
May 25
🦐 Shrimp Alert! Coins in addresses with < 1 BTC.
1,402,920 BTC is at its highest level in the last 365 days.
🔹Possible accumulation
🔹Change last day: 0.0031%
🔹Change last week: 0.0395%
🔹Price bitcoin: $76,951
#Bitcoin #OnChain
charts.bgeometrics.com/bitco…
charts.bgeometrics.com/distr…
1
63
May 25
📊 Bitcoin Weekly Report — 18 May–24 May 2026
BTC $77,088 ▲ 0.1%
NUPL 0.303 — Hope
MVRV 1.435
SOPR 1.000
Fear & Greed 25 — Fear
• SOPR crossed above 1.0 (0.994 → 1.000) — sellers in profit
• SOPR STH crossed above 1.0 (0.996 → 1.001) — sellers in profit
bgeometrics.com/reports/week…
1
60
May 25
🚨 BGeometrics Demand Index Alert! (40.67) is at its lowest level in the last 30 days.
🔹Potential bearish signal in the short term.
#Bitcoin #OnChain
charts.bgeometrics.com/dashb…
1
49
May 21
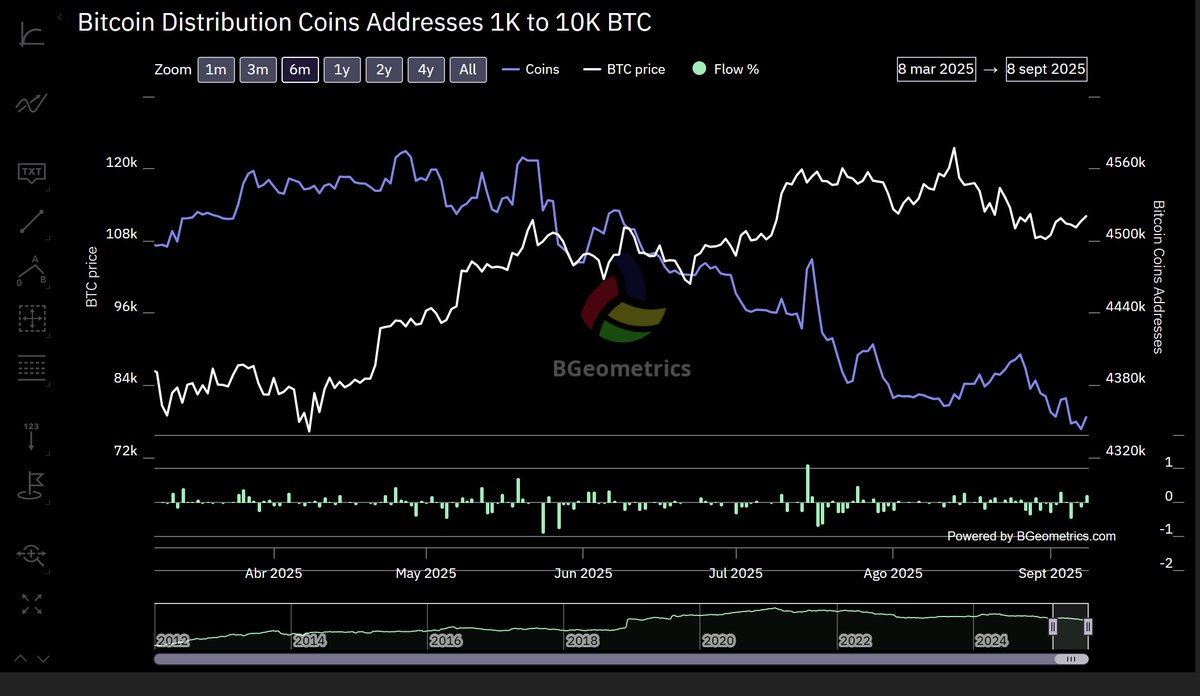
🐋 Whale Alert! Coins in addresses with 1k to 10K BTC.
4,184,705 BTC is at its lowest level in the last 100 days.
🔹Possible distribution
🔹Change last day: -0.0531%
🔹Change last week: -0.5642%
🔹Price bitcoin: $76,807
#Bitcoin #OnChain #WhaleAlert
charts.bgeometrics.com/distr…
charts.bgeometrics.com/bitco…
59
May 18
Bitcoin Weekly Report — 11 May–17 May 2026
BTC $77,764 ▼ 4.8%
NUPL 0.309 — Hope
MVRV 1.446
SOPR 1.000 (above 1.0)
Fear & Greed 27 — Fear
• SOPR LTH crossed above 1.0 (0.988 → 1.175) — sellers in profit
• SOPR STH crossed below 1.0 (1.003 → 1.000) — sellers at loss
bgeometrics.com/reports/week…
64