#BTC #Bitcoin
オーダーブックを見る限り、上昇を止める大きな売り壁は64.9k付近に集中しています👀
逆に言えば、
✅ 64.9kまでの売り圧は比較的薄い
✅ 買いが継続すれば到達しやすい環境
✅ 64.9k突破でショートカバー発生の可能性
という状況。
ただし注意点は、大口の売り板は直前で移動したり取り消されたりすることも多く、見えている壁が必ず機能するとは限りません。
今の相場は
📈 OI増加
📈 Fundingマイナス圏
📈 売り板が薄い
と、需給面では強気寄り。
64.9kを明確に突破できれば65k台回復、さらにショートスクイーズの展開も期待できそうです🚀
一方で64.9kで何度も跳ね返されるようなら、短期勢の利確による調整には警戒したいところ。
#仮想通貨 #BTC分析 #Crypto #BitcoinAnalysis #ショートスクイーズ

$BTC Thin ask side while price is grinding up, easy to push higher. The only large sell wall is still sitting at 64.9k on binance spot.

59
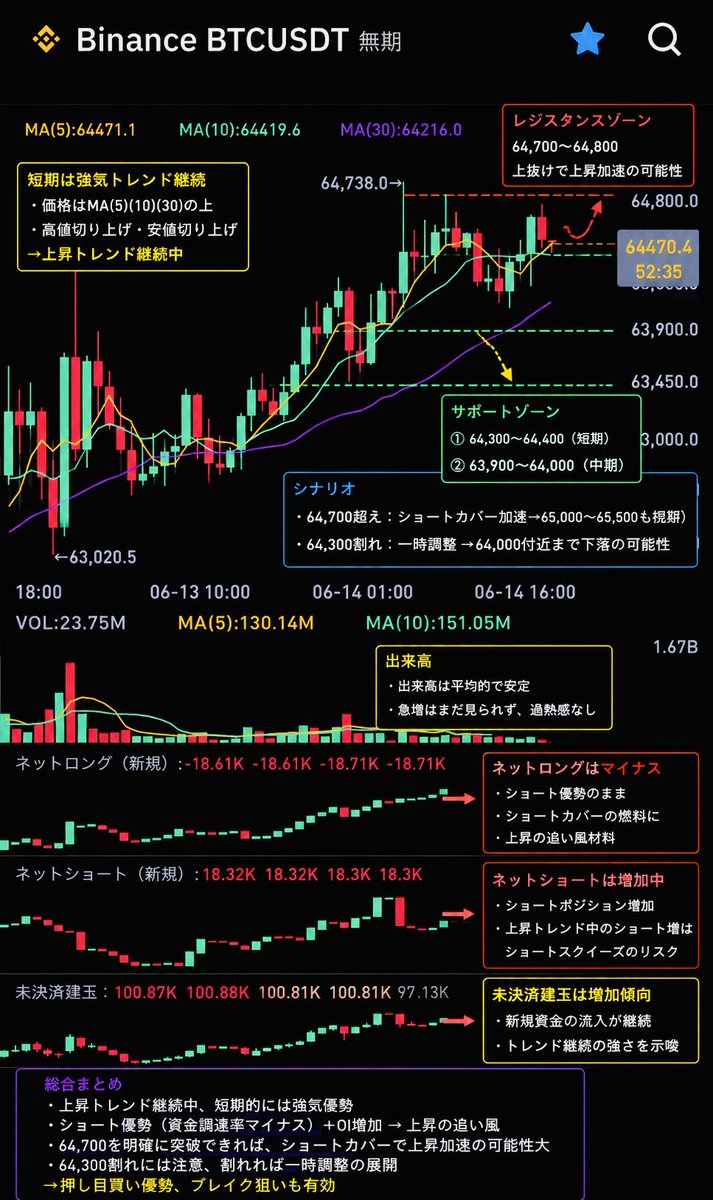
#BTC #Bitcoin
OI(未決済建玉)が増加しながら資金調達率(Funding Rate)がマイナス。
この組み合わせは市場参加者の多くがショート寄りなのに、価格は下がらず上昇している状態を示しています👀
つまり、
✅ 新規資金が流入
✅ ショート優勢のまま価格上昇
✅ ショートカバー発生の可能性
✅ 上抜け時は踏み上げ加速も
という強気シナリオが意識されやすい状況です。
特に64,800ドル付近を明確に突破できれば、ショート勢の損切りを巻き込みながら上値を試す展開もありそう🚀
ただしOI増加は両刃の剣。
ロングが積み上がり過ぎると逆に急落の燃料にもなるため、出来高と資金調達率の変化は引き続き要監視です📊
#仮想通貨 #BTC分析 #Crypto #BitcoinAnalysis


1
104
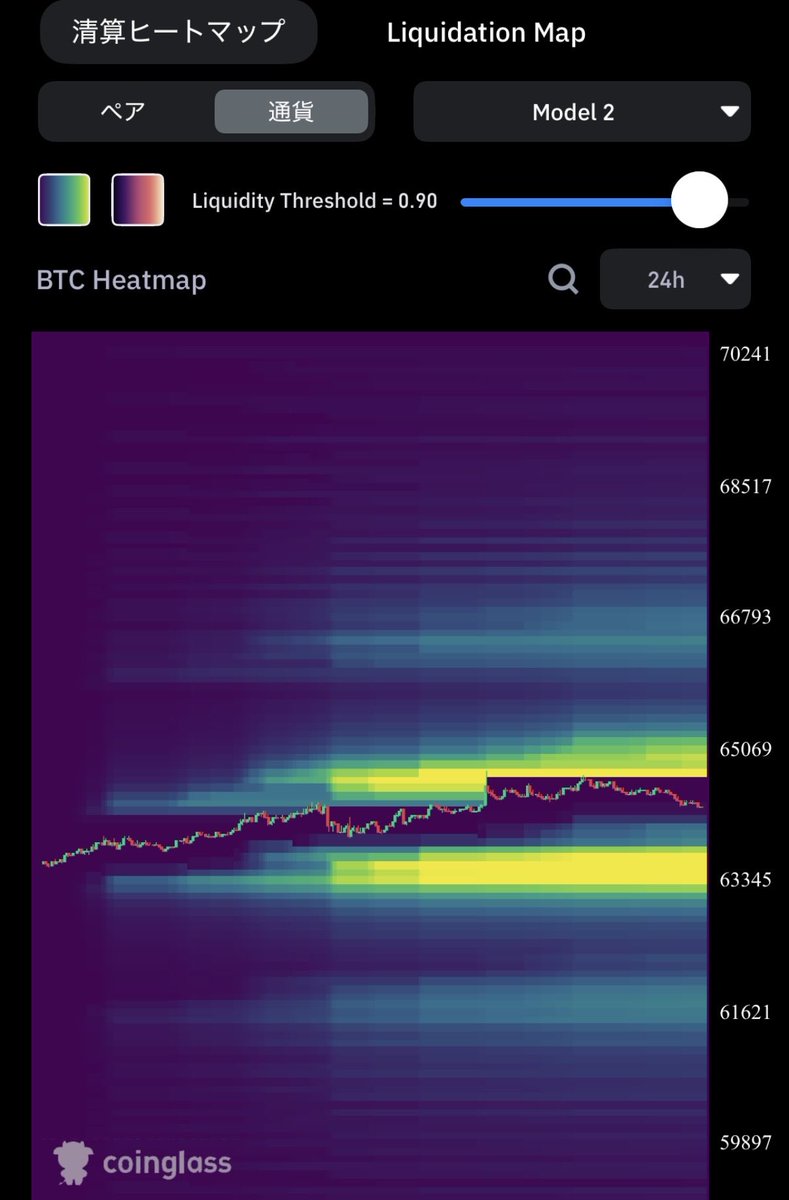
🚨 BTC Liquidation Heatmap Analysis
Current price is hovering around $64.3K, right between major liquidity zones.
🟢 Key Support:
• $63.3K–$63.8K holds a large liquidity cluster
• Strong buying interest may emerge if tested
🔵 Secondary Support:
• $61.2K–$61.8K contains another significant liquidity pool
• A breakdown below $63K could accelerate moves toward this area
🔴 Major Resistance:
• Heavy liquidation liquidity sits around $66.8K–$68.5K
• A breakout above $65.5K could trigger a short squeeze and fuel further upside
📊 What I’m Watching:
✅ Support at $63K
✅ Liquidity buildup above current price
✅ Potential short-squeeze setup toward $67K
The market often moves where liquidity is concentrated.
Right now, BTC is sitting at a key decision point. 👀
#Bitcoin #BTC #Crypto #Trading #LiquidationMap #CryptoTrading #BitcoinAnalysis #CryptoMarket
84

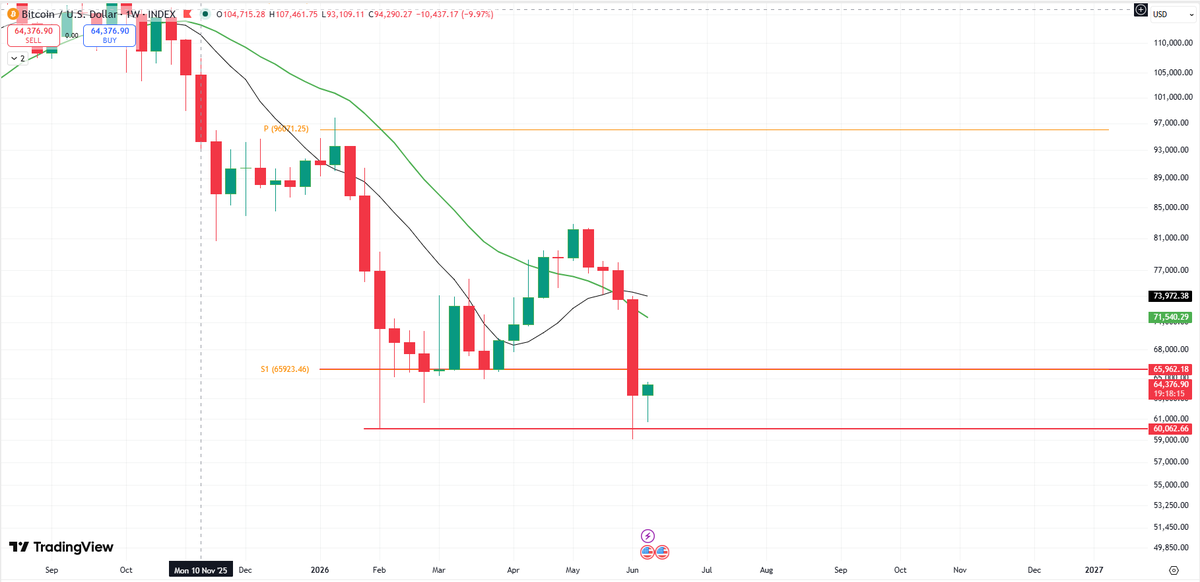
🚨 BTCUSD WEEKLY UPDATE 🚨
📊 Key Levels
🔹 Support Zone: 59,000
🔹 Resistance Zone: 65,950
📈 If BTC sustains above the 66,000 level, the probability of a strong bullish trend increases, with potential upside targets in the 96,000 – 117,000 range.
📉 On the downside, a breakdown below the 59,000 support zone could trigger fresh selling pressure, with the next major support around 44,300.
⚠️ Bitcoin remains at a crucial decision point. A breakout above resistance may signal the start of a new bull phase, while a breakdown below support could extend the bearish trend.
#BTCUSD #Bitcoin #BTC #Crypto #Cryptocurrency #BitcoinAnalysis #CryptoTrading #TechnicalAnalysis #TradingView #CryptoMarket #BTCUpdate #WeeklyAnalysis #Bullish #Bearish #PriceAction 🚀📉
2
69

14h
Bitcoin hat es im 1 Stunden Chart geschafft, über den Widerstand sowie die 200er EMA auszubrechen. Jetzt muss weiteres Momentum in den Markt kommen, damit sich das Ascending Triangle vollständig nach oben hin ausspielen kann.
Sollte sich dieser Ausbruch bestätigen und die Stärke anhalten, rückt als nächstes die 800er EMA in den Fokus.
Damit bleibt das Szenario einer Bewegung in Richtung 70.000 $ weiterhin intakt genau das Ziel, das wir bereits seit längerer Zeit im Blick haben.
#Bitcoin #BTC #Crypto #Trading #TechnicalAnalysis #ChartAnalysis #PriceAction #AscendingTriangle #MarketStructure #Liquidity #BTCUSD #CryptoTrading #BitcoinAnalysis #Trader #CryptoMarkets

6
3
756

BTCUSD Today | Turtle Soup Liquidity Grab CRT Entry Setup | Forex & Crypto Analysis | EP-01
youtu.be/L6YacHetlSg?si=A1Z5…
#BTCUSD #BitcoinTrading #BitcoinAnalysis #BTCUSDAnalysis #BTCUSDForecast
#CRTTrading #CRTStrategy #TurtleSoup #TurtleSoupStrategy
#SmartMoneyConcept #SMCTrading
24

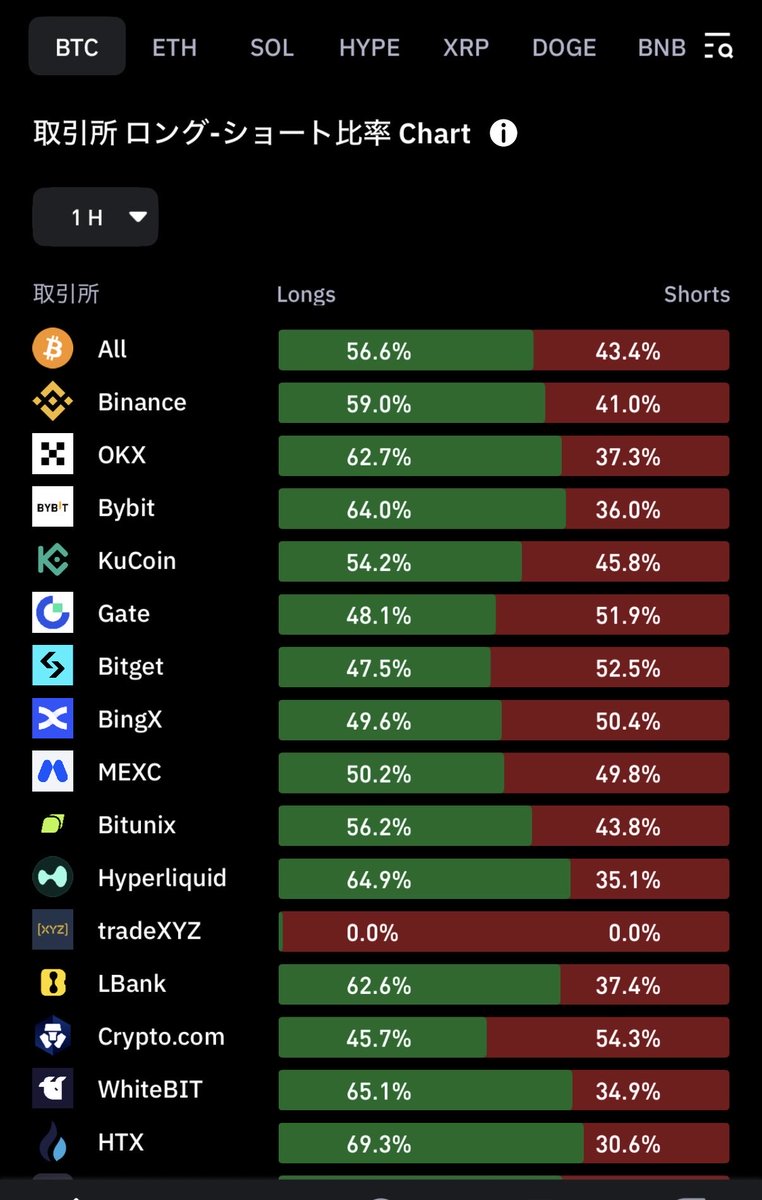
#BTC #Bitcoin
ロング・ショート比率を見ると、市場全体ではロング56.6% vs ショート43.4%。
一見するとロング優勢ですが、Bybit・OKX・Hyperliquidなど主要デリバティブ取引所ではロング比率が60%超まで偏っています。📈
ただ、市場は「多数派が勝つ」とは限りません。
このままBTCが65,000ドルを突破できれば、上に積み上がったショートの清算を巻き込みながらショートスクイーズが発生する可能性があります。🚀
一方で、ロング比率の高さは下落時のロング清算リスクも意味するため、過度な楽観は禁物。
現在はロング優勢+未決済建玉増加の状態。
次の大きな値動きに向けてエネルギーが溜まっているように見えます。🔥
#Crypto #BTCUSD #仮想通貨 #暗号資産 #ショートスクイーズ #ロング比率 #BitcoinAnalysis #BTC 🚀📊🐂
1
101

Jun 13
A new video has been posted on YouTube
Watch it now here:
👉 youtu.be/7xDhyyPbjaM
Trade with care,
Alain M(Coach)
#forexanalysis #goldanalysis #eurusd #bitcoinanalysis

24

Jun 13
BTC/USD OUTLOOK (13 June 2026)
⚡ EXECUTIVE SUMMARY
Bitcoin is currently trading at $63,788.34, showing a minor daily change. The sentiment over the past 24 hours leans towards neutral as the market digests recent developments. We are observing a period of consolidation following recent volatility. 📉
🌍 FUNDAMENTAL DRIVERS
Over the weekend, geopolitical tensions in Eastern Europe remained a focal point, with continued reports of diplomatic efforts but no significant resolution. This lingering uncertainty generally supports a cautious approach from risk assets.
In Asia, the Nikkei 225 opened slightly lower, reflecting broader global economic concerns and a strengthening yen. Chinese markets also saw a mixed performance, with some sectors exhibiting resilience while others pulled back.
The focus for the upcoming week will be on major inflation data releases from key economies, particularly the United States. These figures will be critical in shaping expectations for future monetary policy decisions from the Federal Reserve and other central banks.
📈 TECHNICAL ANALYSIS
The 200-day Simple Moving Average (SMA) is currently acting as a significant support level around the $60,000 mark. Bitcoin is trading well above this key long-term indicator, suggesting underlying bullish strength.
The Relative Strength Index (RSI) is hovering in the mid-50s, indicating a balanced market that is neither overbought nor oversold. This suggests room for further price discovery in either direction without immediate correctional pressure.
Immediate support can be identified around the $62,500 to $63,000 range, a level that has been tested and held in recent trading sessions. Resistance is now firmly placed at the $65,000 psychological level, with a break above this potentially opening the door for further upside.
🚀 OUTLOOK
For the next 24-48 hours, we anticipate a continuation of the current consolidation phase. Bitcoin is likely to trade within a defined range, testing the upper resistance at $65,000 and the lower support around $62,500.
A decisive break above $65,000, especially on increased volume, could signal a move towards higher targets in the $67,000 to $68,000 region. Conversely, a breach below $62,500 might lead to a test of the $60,000 SMA support.
The market sentiment remains sensitive to incoming economic data, particularly inflation reports. Any surprises in these figures could trigger a more significant directional move.
🤖 TRADER’S NOTE
Pro-Tip: Consider waiting for confirmation of a breakout above $65,000 before initiating long positions, or looking for potential retests of the $62,500 support for a more conservative entry. Volatility is expected to increase ahead of key economic data.
ℹ️ WEBSITE & BLOG
Check my bio links for more tips 😉
#BTCUSD #BitcoinAnalysis #CryptoMarket


1
62
Jun 13
BTC/USD OUTLOOK (13 June 2026)
⚡ EXECUTIVE SUMMARY
Bitcoin is currently trading at $63,788.34, showing a minor daily change. The sentiment over the past 24 hours leans towards neutral as the market digests recent developments. We are observing a period of consolidation following recent volatility. 📉
🌍 FUNDAMENTAL DRIVERS
Over the weekend, geopolitical tensions in Eastern Europe remained a focal point, with continued reports of diplomatic efforts but no significant resolution. This lingering uncertainty generally supports a cautious approach from risk assets.
In Asia, the Nikkei 225 opened slightly lower, reflecting broader global economic concerns and a strengthening yen. Chinese markets also saw a mixed performance, with some sectors exhibiting resilience while others pulled back.
The focus for the upcoming week will be on major inflation data releases from key economies, particularly the United States. These figures will be critical in shaping expectations for future monetary policy decisions from the Federal Reserve and other central banks.
📈 TECHNICAL ANALYSIS
The 200-day Simple Moving Average (SMA) is currently acting as a significant support level around the $60,000 mark. Bitcoin is trading well above this key long-term indicator, suggesting underlying bullish strength.
The Relative Strength Index (RSI) is hovering in the mid-50s, indicating a balanced market that is neither overbought nor oversold. This suggests room for further price discovery in either direction without immediate correctional pressure.
Immediate support can be identified around the $62,500 to $63,000 range, a level that has been tested and held in recent trading sessions. Resistance is now firmly placed at the $65,000 psychological level, with a break above this potentially opening the door for further upside.
🚀 OUTLOOK
For the next 24-48 hours, we anticipate a continuation of the current consolidation phase. Bitcoin is likely to trade within a defined range, testing the upper resistance at $65,000 and the lower support around $62,500.
A decisive break above $65,000, especially on increased volume, could signal a move towards higher targets in the $67,000 to $68,000 region. Conversely, a breach below $62,500 might lead to a test of the $60,000 SMA support.
The market sentiment remains sensitive to incoming economic data, particularly inflation reports. Any surprises in these figures could trigger a more significant directional move.
🤖 TRADER’S NOTE
Pro-Tip: Consider waiting for confirmation of a breakout above $65,000 before initiating long positions, or looking for potential retests of the $62,500 support for a more conservative entry. Volatility is expected to increase ahead of key economic data.
ℹ️ WEBSITE & BLOG
Check my bio links for more tips 😉
#BTCUSD #BitcoinAnalysis #CryptoMarket
1
1
1,031

Jun 13
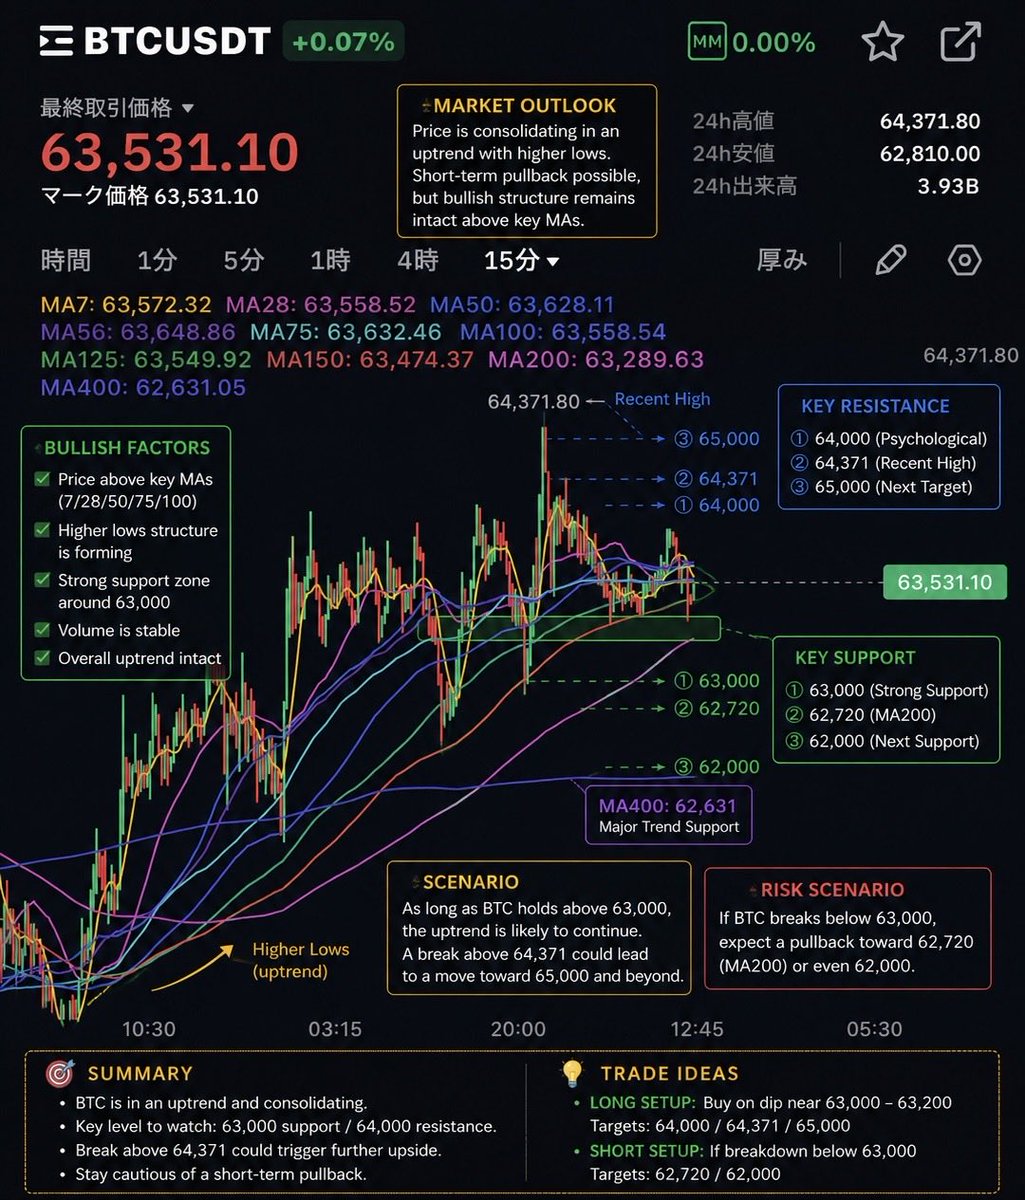
#BTC #Bitcoin #BTCUSDT
📊 BTC Market Update
Bitcoin continues to consolidate above key support while maintaining a bullish structure on lower timeframes.
✅ Holding above $63,000 support
✅ Higher lows continue to form
✅ Most major moving averages remain supportive
✅ Bullish trend structure still intact
👀 Key levels to watch:
🔹 Support: $63,000
🔹 Resistance: $64,000 - $64,371
🔹 Breakout Target: $65,000
As long as BTC stays above $63K, bulls remain in control.
A decisive break above $64,371 could trigger fresh momentum and potentially open the path toward the $65K liquidity zone.
⚠️ Risk scenario:
A loss of $63K support may lead to a retest of the $62.7K–$62K area before the next move higher.
For now, this looks more like healthy consolidation than trend weakness.
Stay patient. The next major move is getting closer. 🚀
#BitcoinAnalysis #BTC #Crypto #TechnicalAnalysis #Trading #BullMarket #CryptoTrading #HODL #Investing #BTCUSDT 📈🔥🚀
77

Jun 12
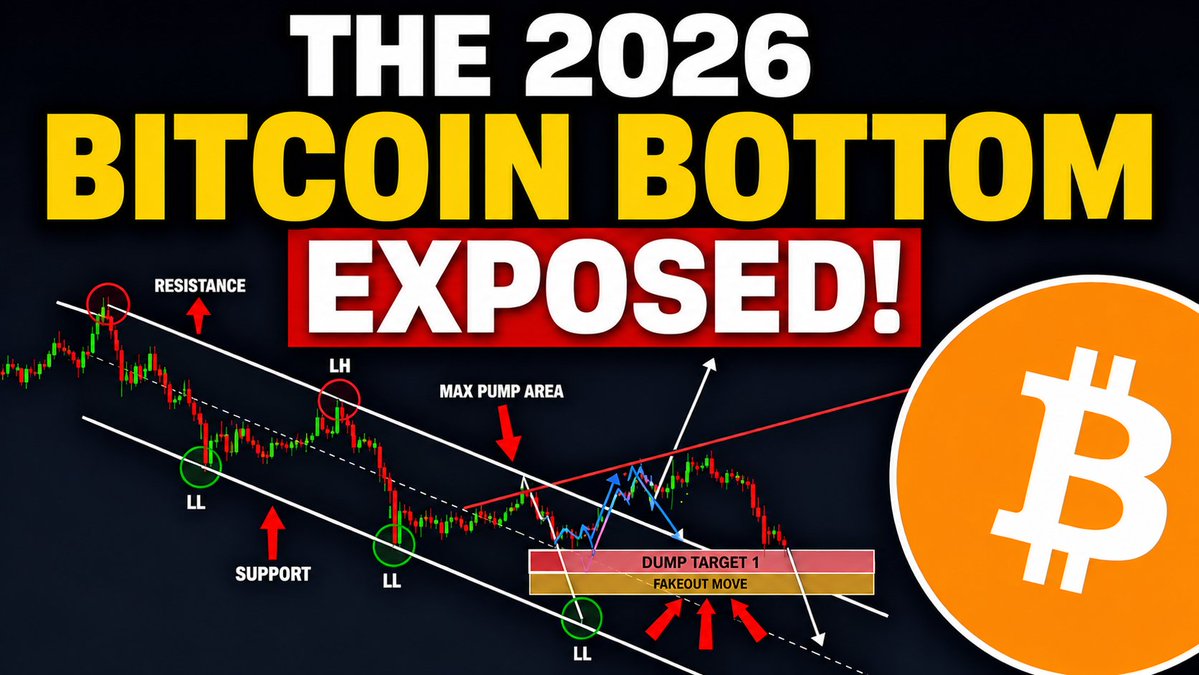
🚨 The 2026 Bitcoin Bottom Exposed! 🚨
Most people are focused on the next pump, but very few are paying attention to the hidden pattern forming on the chart.Could #Bitcoin have one final capitulation move before the real bull market begins, or is the bottom already in?
In this video, I break down:
✅ The hidden chart pattern
✅ Key support and resistance levels
✅ Potential dump zones and reversal targets
✅ What history suggests could happen next
Watch before making your next move. 👀
youtube.com/watch?v=smOvlCZS…
#Bitcoin #BTC #Crypto #Cryptocurrency #BitcoinAnalysis #CryptoTrading #Altcoins #BullRun #BearMarket #TechnicalAnalysis #Investing #CryptoNews #Trading #BTCPrice #CryptoMarket
2
4
169

Jun 12
Bitcoin $65K Rejection Incoming? The Liquidity Hunt Nobody Sees Coming
Watch now 👉 youtu.be/G1cmK3KdysI
Watch summary 👉 patreon.com/thetradingparrot…
Bitcoin is approaching the critical $65K liquidity zone after recovering strongly from $60,800 this week. The Trading Parrot breaks down the confirmed double bottom on the daily chart, the massive short liquidation wall between $65K and $65,800, and the inverse cup-and-handle neckline that could trigger way higher prices if reclaimed. Negative funding rates signal heavy shorting and a potential short squeeze is building. Learn the exact trade management plan for longs in Bitcoin, Solana, and Ethereum — and what the SpaceX IPO and CPI data could mean for crypto. Watch now before the move happens.
00:00 Week Recap: Most Hated Rally Playing Out
01:59 Open Interest Bullish Divergence Analysis
03:46 Four Hour Chart: Long and Short Trade Positions
05:00 Short Term Liquidity at $65K and Triangle Setup
08:27 Daily Candle Breakout Confirmed
09:04 MACD Daily Bullish Cross and Double Bottom Pattern
12:43 Trailing Stop Loss Strategy at Key Levels
15:00 Weekly Resistance at $65,700 and Ask Wall
18:14 Longs and Shorts Ratio, Negative Funding Rates
19:47 Daily and 4H Fair Value Gap at $66K
21:09 SpaceX IPO and CPI: Top Weekly Macro Events
#Bitcoin #BTC #BitcoinAnalysis #CryptoTrading #BitcoinPrice
5
242

Jun 12
𝐁𝐢𝐭𝐜𝐨𝐢𝐧 𝐏𝐫𝐢𝐜𝐞 𝐓𝐫𝐚𝐝𝐞𝐬 𝐚𝐭 $𝟔𝟑,𝟒𝟎𝟎 𝐚𝐬 𝐒𝐩𝐚𝐜𝐞𝐗 𝐈𝐏𝐎 𝐏𝐮𝐥𝐥𝐬 𝐈𝐧𝐯𝐞𝐬𝐭𝐨𝐫 𝐌𝐨𝐧𝐞𝐲 𝐟𝐫𝐨𝐦 𝐂𝐫𝐲𝐩𝐭𝐨 𝐌𝐚𝐫𝐤𝐞𝐭
Bitcoin sits near $63,400 after a sharp 2026 correction. ETF outflows, the SpaceX IPO, and global market pressure now shape the next big crypto move. Full market breakdown inside.
#Bitcoin #CryptoNews #BTCPrice #CryptoMarket #BitcoinAnalysis #AI #AINews #AnalyticsInsight #AnalyticsInsightMagazine
Read More 👇
zurl.co/tzZyG

32

Jun 12
🚨 الصعود الذي يراه الجميع... قد يكون أكبر فخ في السوق!
#Bitcoin يرتد بقوة، لكن هل هذا بداية اتجاه صاعد أم مجرد صعود كاذب قبل موجة هبوط جديدة؟ 📉
المستويات القادمة ستحسم المعركة بين المشترين والبائعين.
راقب بحذر مناطق الدعم والمقاومة
#Bitcoin #BTC #Crypto #CryptoTrading #Trading #PriceAction #BitcoinAnalysis #CryptoMarket #BTCUSD #FuturesTrading
1
2
65

Jun 12
#BTC almost reached our first target after our analysis I shared yesterday.
Price respected the pattern after a long time that invalidated many patterns. BTC should rise further from this area and a move above the second target should also push it further.
#bitcoin #bitcoinanalysis #bitcoinsignal

Jun 11

#Bitcoin: Triangle Breakout Suggests More Upside Ahead
t.me/TradingPuzzles
After a long time, BTC is showing another clear position, at least for short-term trading.
The price has already broken out of a triangle pattern that indicates a possible upward move.
If the price does not develop further in this area, then BTC could rise further in the coming days.
It should move today, but let's see if the market will have the right volume to move BTC.
You can find more details on the chart.
Thank you and good luck! 🍀
⚠️PS: Do your own analysis and use your own strategy to join the trade.
#BTCUSDT @tradingview #eth #btc #ethereum #cryptotrading #cryptoanalysis #cryptosignals tradingview.com/chart/BTCUSD…

5
417

Jun 11
Just dove into this Bitcoin price analysis and wow, it’s wild how the demand for BTC USD is shifting—definitely worth a read! 🧐 #BitcoinAnalysis
1
34
Jun 11
Bitcoin Langzeitprognose Monatschart
Wenn wir uns den Bitcoin Monatschart genauer anschauen, fällt eine interessante Struktur auf.
Die erste große Aufwärtsbewegung begann am Tiefpunkt des Jahres 2019 und führte schließlich bis zum Allzeithoch im Jahr 2021.
Anschließend betrachten wir die zweite Aufwärtsbewegung. Hier habe ich dieselbe Box der ersten Bewegung kopiert und vom Allzeithoch 2021 bis zum aktuellen Allzeithoch 2025 angelegt. Interessanterweise passt diese Struktur nahezu eins zu eins auf den aktuellen Zyklus.
Gehen wir nun einen Schritt weiter und kopieren dieselbe Bewegung ein weiteres Mal.
Dazu wird die Box der zweiten Aufwärtsbewegung ab dem Allzeithoch 2025 erneut angesetzt und in die Zukunft projiziert. Da zwischen dem Allzeithoch 2021 und dem Allzeithoch 2025 rund vier Jahre vergangen sind, wäre es durchaus denkbar, dass sich auch der nächste Zyklus über einen ähnlichen Zeitraum erstreckt und sein Hoch im Jahr 2029 ausbildet.
Folgt Bitcoin weiterhin dieser historischen Struktur, würde dies vom aktuellen Kursniveau aus einem Anstieg von rund 210 % entsprechen.
Das daraus abgeleitete Kursziel für das potenzielle Allzeithoch im Jahr 2029 läge bei ungefähr 180.000 US-Dollar.
Natürlich handelt es sich dabei nicht um eine Vorhersage, sondern lediglich um eine Projektion auf Basis der bisherigen Marktzyklen. Dennoch erscheint dieses Szenario aus heutiger Sicht durchaus plausibel und realistisch, insbesondere wenn Bitcoin seinen langfristigen Wachstumstrend fortsetzen kann.
Wie seht ihr das?
Haltet ihr einen Bitcoin Kurs von 180.000 US Dollar bis 2029 für realistisch?
Oder erwartet ihr deutlich höhere beziehungsweise niedrigere Kursziele?
Schreibt eure Meinung gerne in die Kommentare. 👇
#Bitcoin #BTC #BTCUSD #MarketCycle #Bullish #Bearish #BottomFormation #TechnicalAnalysis #PriceAction #Liquidity #MarketStructure #Trading #OnChain #BitcoinAnalysis #LongTerm #Long #ATH2029

4
6
3,506

Jun 11
The Fed holds June 17. That is not the story.
Kevin Warsh walks up to that podium for the first time as Fed Chair .
👉 dailycoinpost.com/kevin-wars…
#Bitcoin #BTC #FederalReserve #KevinWarsh #Fed #BitcoinAnalysis #Macro #CryptoMarkets #FOMCMeeting #BTC
1
21