Data engineer | Stock Picker
Joined October 2016
- Tweets 7,843
- Following 249
- Followers 7,627
- Likes 3,970
3,385 Photos and videos


Pinned Tweet

Apr 12
This is my market checklist for any play. I don’t have a favorite ticker (😉 $AMZN/ $AA lol) . My niche is the chart itself. I trade many names, but every setup must pass this checklist 👇
– Monthly sets bias, Weekly approves it
– Daily & 4h build the entry
– Elliott Wave agrees with 9/21/50 EMAs, S/D zones & liquidity
– Neal ALGO flow volume confirm trigger
– Profit & loss based on stock levels, never option price
If it doesn’t fit my chart niche, I skip it

7
47
10,830
Jun 12
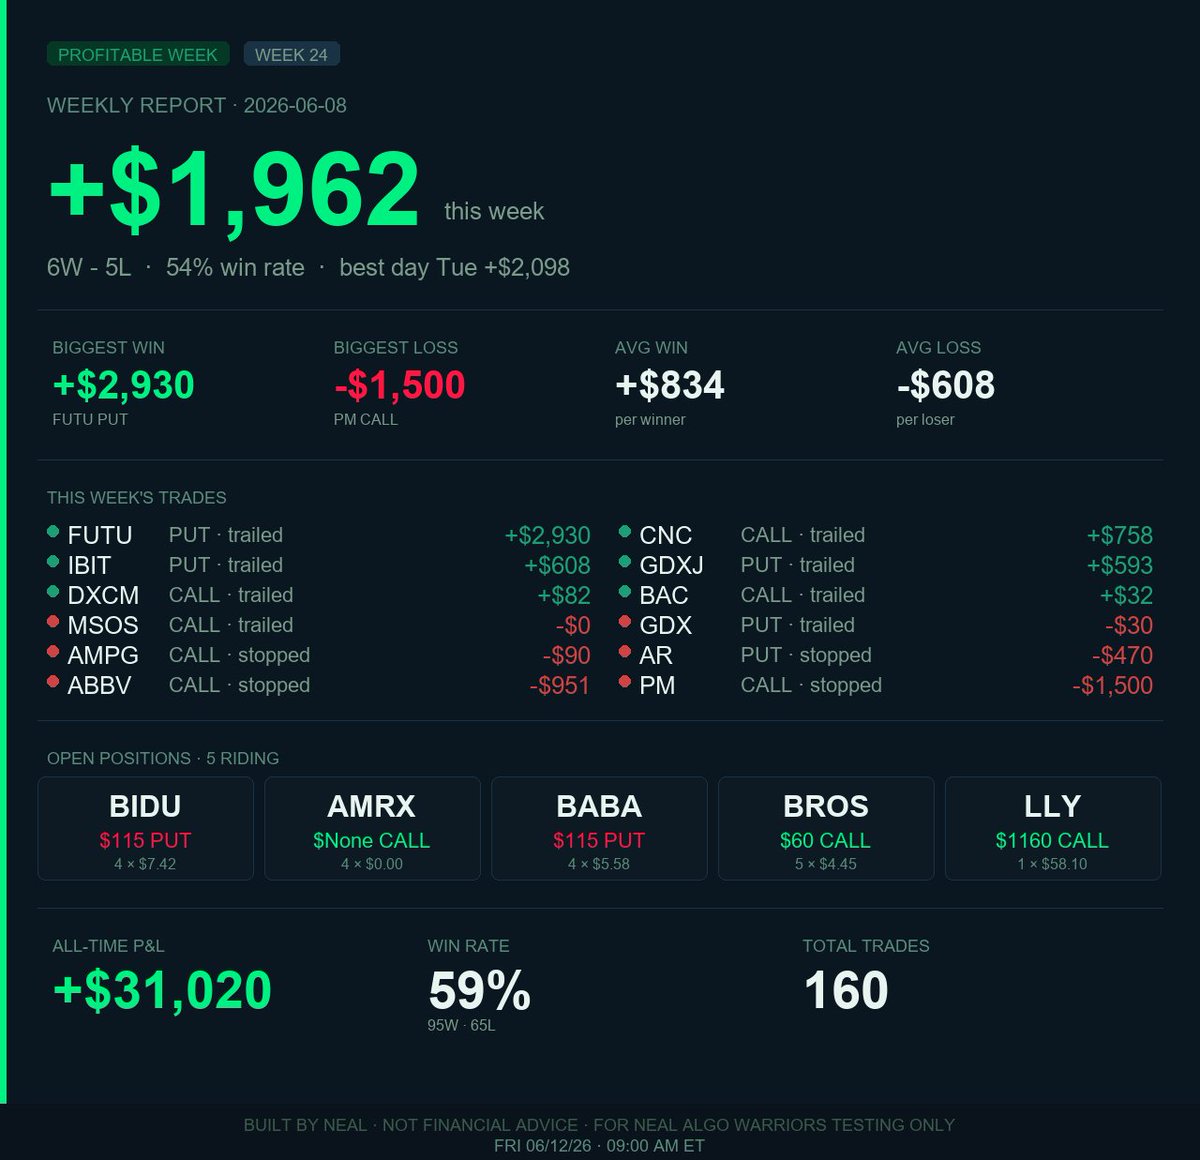
imagine 60% win rate has this result, bumping to 85% in by end of next year is goal then retirement loading.
1
1
7
1,406
Baba Neal retweeted

Jun 11
My First purchase of SpaceX will be in 10 months.
All IPOs trade in a similar trend.
Shocking stats:
- Most IPOs drop 50% after going live. Look at $CAVA $RDDT $ALAB $CRWV $CART $CBRS
- Some drop further to 70-80%, look at $HOOD $PLTR
- And some never recover: $MBLY $CRCL $KLAR

116
313
2,006
275,617

Baba Neal retweeted

Jun 11
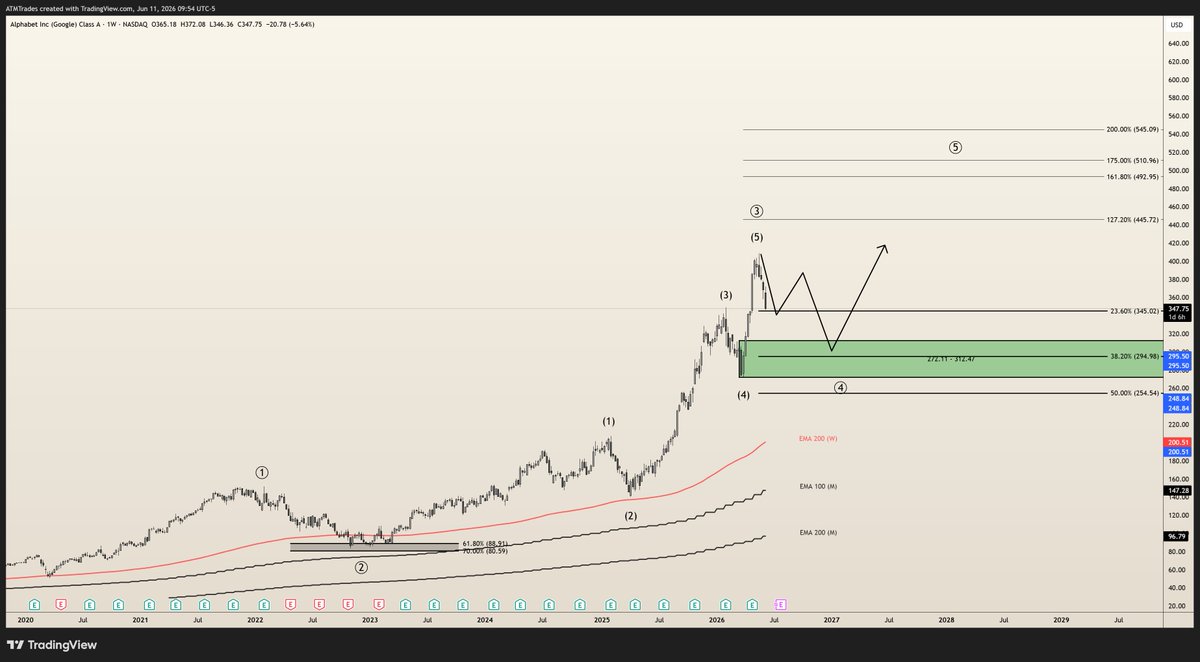
$GOOGL first target hit
If this trades as a zig zag a rally can happen here. Alt is a flat which more immediate pain
Demand for the value entry is still 272-312 and the target


6
2
41
8,524
Jun 11
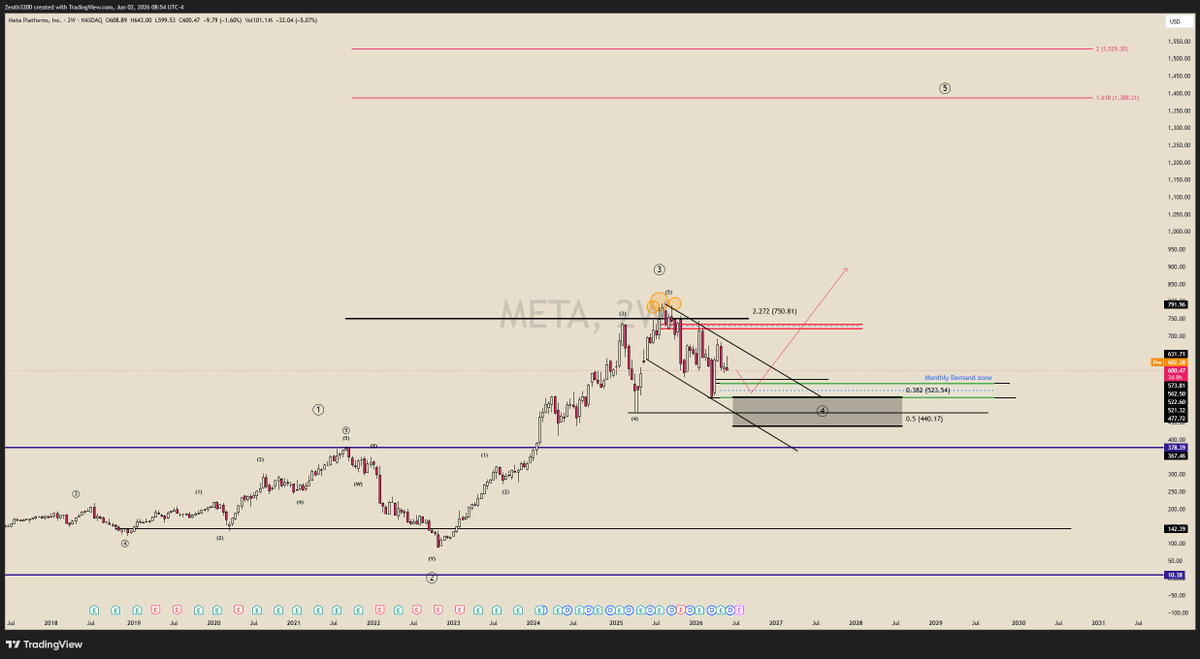
$META 😂
A few of the yapping leech experts who magically appear after every 2-day pump were coming after me when I said patience was needed. Fast forward, and now META is getting very close to the zone I've been watching for a bounce. The market has a funny way of humbling everyone. That's why I try to follow the chart instead of the noise. The candles don't argue, they just print.
Let's see if the level does its job. 🍿
Jun 2

$META is one of the names I'm stalking for a long-term position, but personally I don't think it is ready yet. Looking at the higher timeframe, the structure still looks corrective rather than impulsive. To me, this resembles a Grand Cycle Wave 4 that is still searching for a final low before the next major expansion can begin.
The reason I'm not rushing in is simple:
• The correction doesn't feel fully mature yet.
• Price is still trading below major resistance.
• The current bounce looks more like a reaction inside a correction than the start of a new impulse.
• Momentum has not fully reset on the higher timeframes.
One can make the argument that Wave 4 is forming an Flat. If that's the case, META may need one more sweep or retest of the $540 area before it's truly ready. That would be a classic liquidity grab where everyone becomes bearish right before the next leg higher begins.
The zone I'm watching closely is $540-$525. That's where monthly demand, structure, and retracement levels start lining up. If buyers step in aggressively there, that's where I'll become interested in building a long-term position.
My risk is very straightforward:
• Stop below $440
• Long-term target around $1,300
Could I be wrong? Absolutely.
The market doesn't owe us perfect Elliott Waves, and META could rip tomorrow without ever touching my zone. But from a probability standpoint, I would rather miss the first part of the move and wait for confirmation than force an entry while the correction still appears unfinished.
For now, I'm simply watching, letting the structure develop, and waiting for the market to prove that Wave 4 is complete before committing meaningful capital.
7
1,964
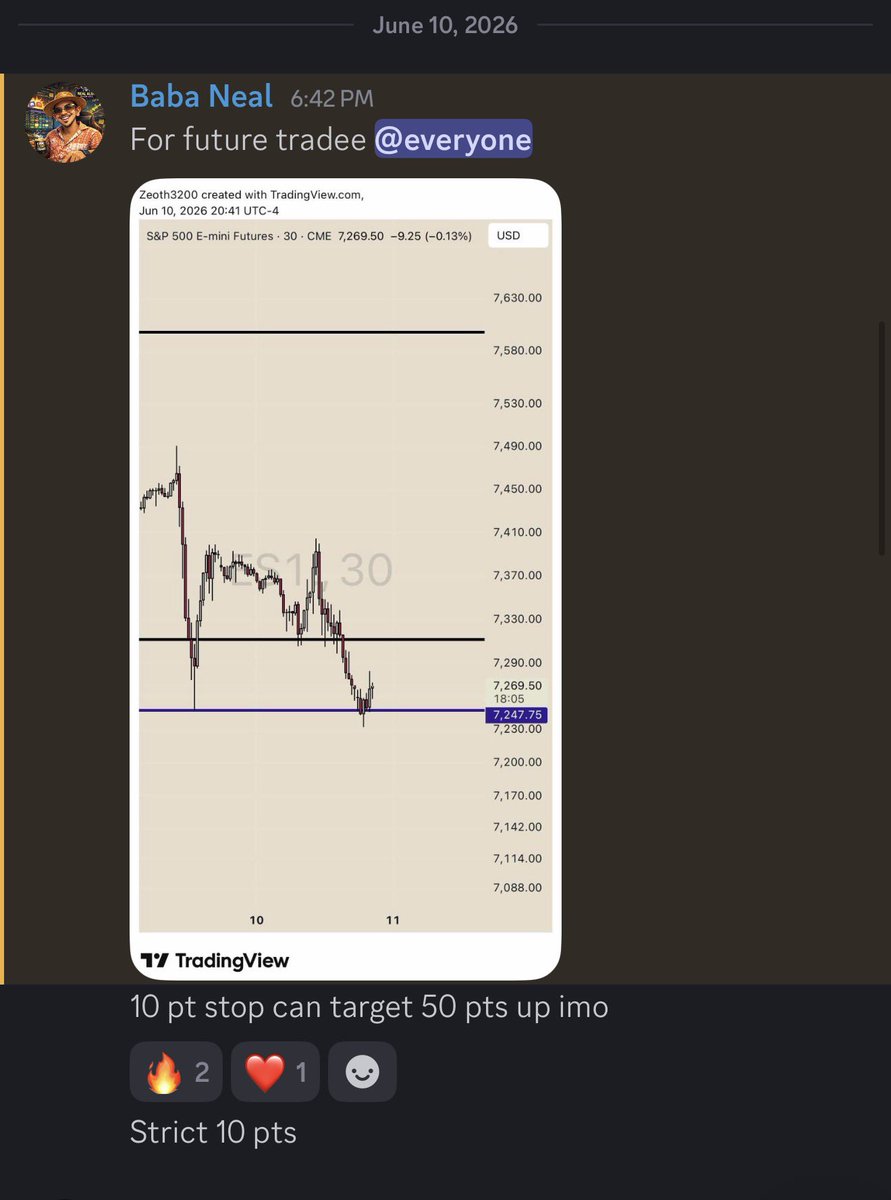
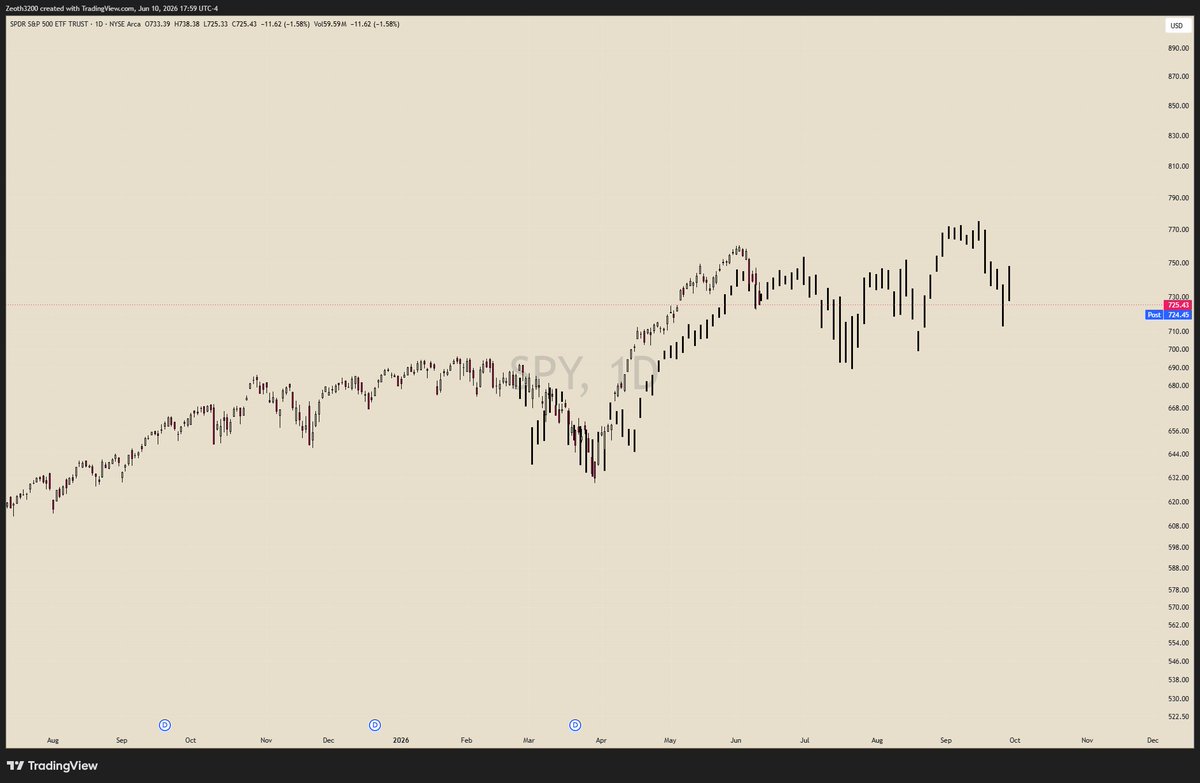
Jun 10
Last one i swear on $SPY
History never repeats exactly, but it often rhymes.
One thing I have always been fascinated by is understanding patterns and studying why certain things happen in the market. Markets are driven by different catalysts every cycle, but human behavior, liquidity, sentiment, and positioning tend to create similar structures over time. While scanning through the SPY chart and digging through historical price action, I noticed a few interesting similarities to the period between September 2021 and December 2021. Back then, the market spent months grinding higher almost relentlessly. Every dip was bought, sentiment remained strong, and the trend stayed intact until a meaningful pullback finally arrived in September. After that correction, the market managed to push to fresh highs again into December before eventually rolling over and entering a much larger decline.When I compare that period to what we're seeing today, there are some notable similarities in the way price is behaving. The steady grind higher, the resilience of dip buyers, and the overall structure of the advance all resemble that 2021 sequence. Even some of the recent candles and consolidation patterns are starting to rhyme with that historical setup. Now, this is not a prediction, and it is definitely not a "wow, the market is going to crash" post. Markets never follow the exact same script. This is simply an observation of price action and pattern recognition. Sometimes these similarities lead to nothing, and sometimes they provide useful context for what could develop next.
For now, I'm just keeping it on my radar and watching how the structure evolves. History doesn't repeat, but it often rhymes. Let's see if this market decides to sing the same tune.
1
14
1,900
Jun 10
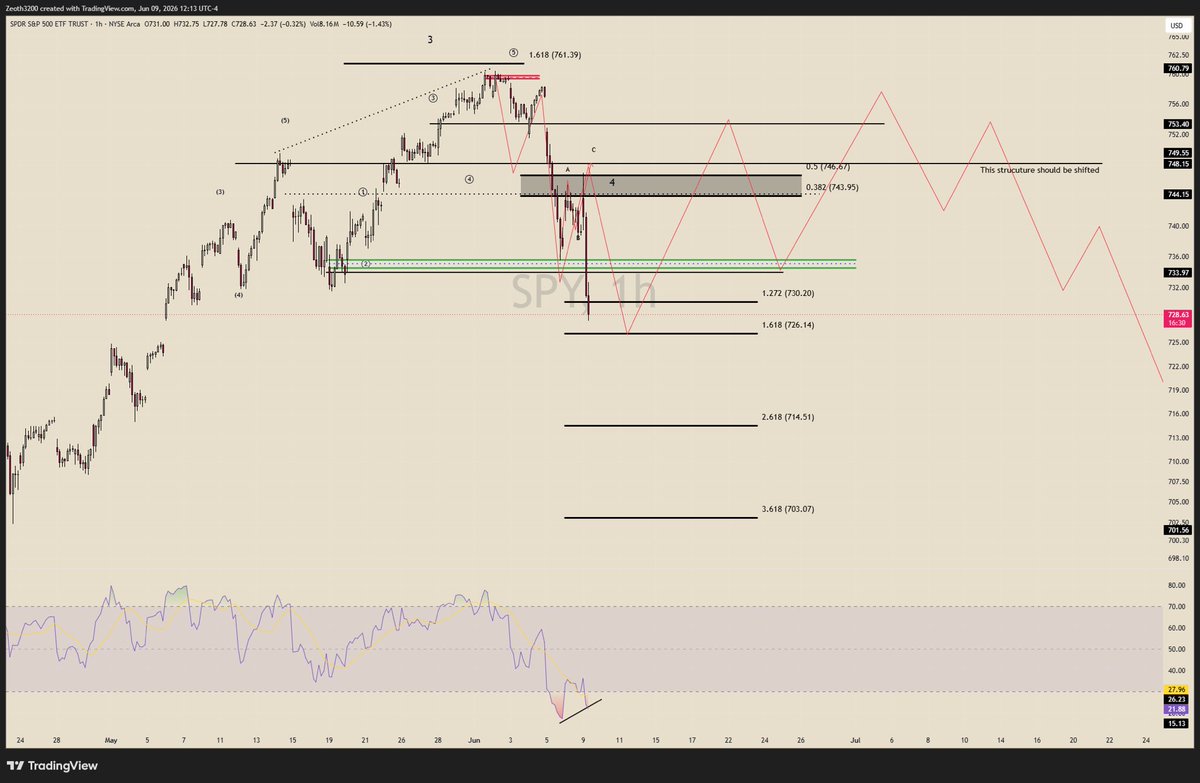
$SPY
I know a lot of people are looking for shorts right now, but I have some bad news for the bearsI'm still approaching this from a swing trader's perspective.For me, a short setup is not valid until a weekly bearish imbalance is actually formed and then retested. Structure always comes first. If SPY closes the week around these levels, it would finally create that bearish imbalance that I've been waiting for. The area I'm watching closely is around 748. If price retraces back into that imbalance and gets rejected, that's where I would become interested in the short side.
Until that happens, there is no reason for me to force a bearish position. Anticipating a move before the market confirms it is how traders get chopped up. Let the structure develop first, then react to what the chart gives us.
For now, let's stay patient, keep emotions in check, and let our Wave 4 plays continue to cook. One step at a time. 📈
1
19
2,147
Jun 10
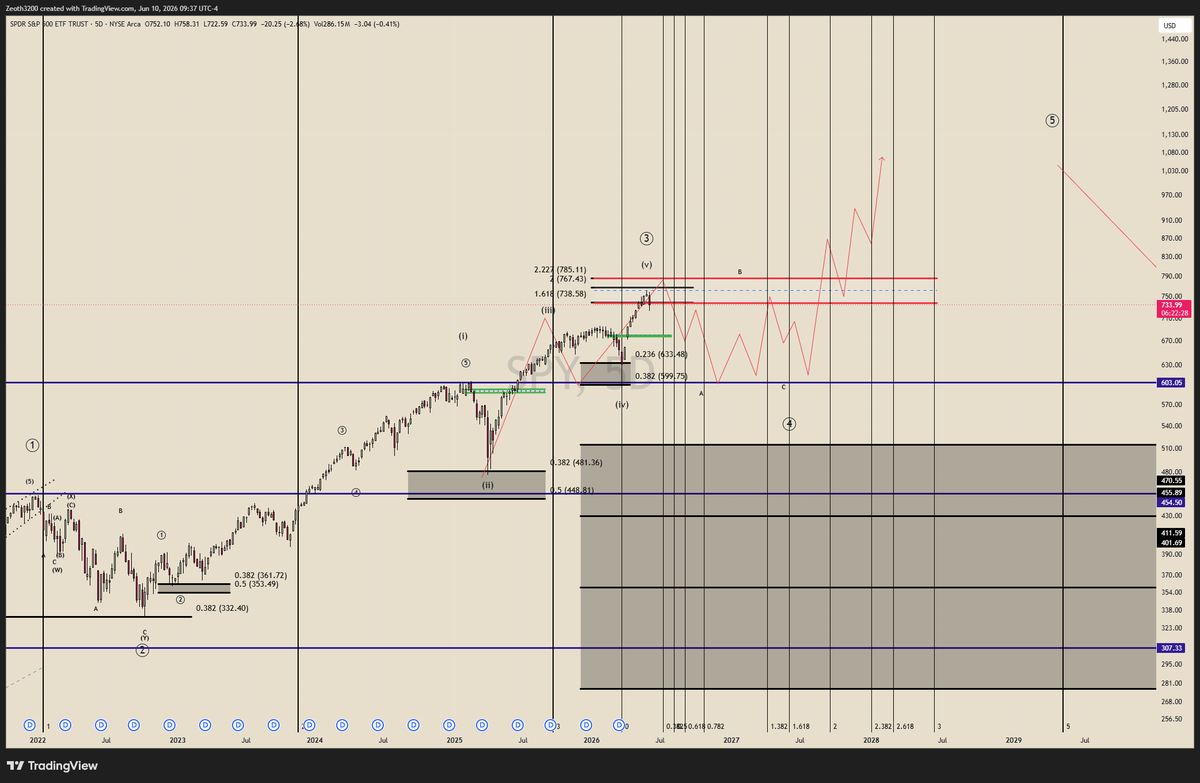
As bullish as I am long term, this is still the primary $SPY count I'm tracking, and so far it continues to respect the roadmap almost perfectly. One of the biggest mistakes we as a traders make is becoming emotionally attached to a direction. The market doesn't care whether you're bullish or bearish; it only cares about structure. Right now, I still view the advance from the April lows as impulsive, but there is a growing possibility that we're building a larger Wave (4) correction before the next major expansion higher. The recent rejection occurred exactly where a major resistance cluster existed, and the reaction has been clean enough that it cannot be ignored.
What keeps me from becoming aggressively bearish is that the downside still looks corrective rather than impulsive. I don't see a completed five-wave decline yet, which means I still have to respect the possibility that dips continue getting bought. However, if this count is correct, the current bounce is likely a B-wave rally before a larger C-wave decline. Bulls need to reclaim and hold the 746-751 region to invalidate much of this bearish outlook. Failure to do so opens the door for a deeper correction that would likely be sharp, emotional, and convincing enough to make many believe the bull market is over.
Ironically, those are usually the environments that create the best long-term buying opportunities. A larger correction would reset sentiment, shake out weak hands, cool off excessive optimism, and create fuel for the next major leg higher. The market doesn't move in a straight line, and healthy bull markets often require painful resets before continuation.
This is not a prediction. It's simply the highest probability path I am tracking based on the structure currently in front of me. If this count continues to play out, expect volatility, expect fakeouts, expect rallies that feel like the bull market is back, and expect selloffs that make everyone question everything. That's exactly how a larger Wave (4) correction behaves. Until key resistance is reclaimed, I remain open-minded and focused on what price is actually doing rather than what I want it to do. Follow the structure, not the emotions. $SPY
2
1
17
3,686
Jun 9
what if SpaceX ipo is the bottom not the top like everyone is mentioning?
6
1
19
3,102
Jun 9
$SPY missed the whole drop today because i had urge to make coffee. But when it came to my zone i pounced with size and confidence.
2
935
Jun 9
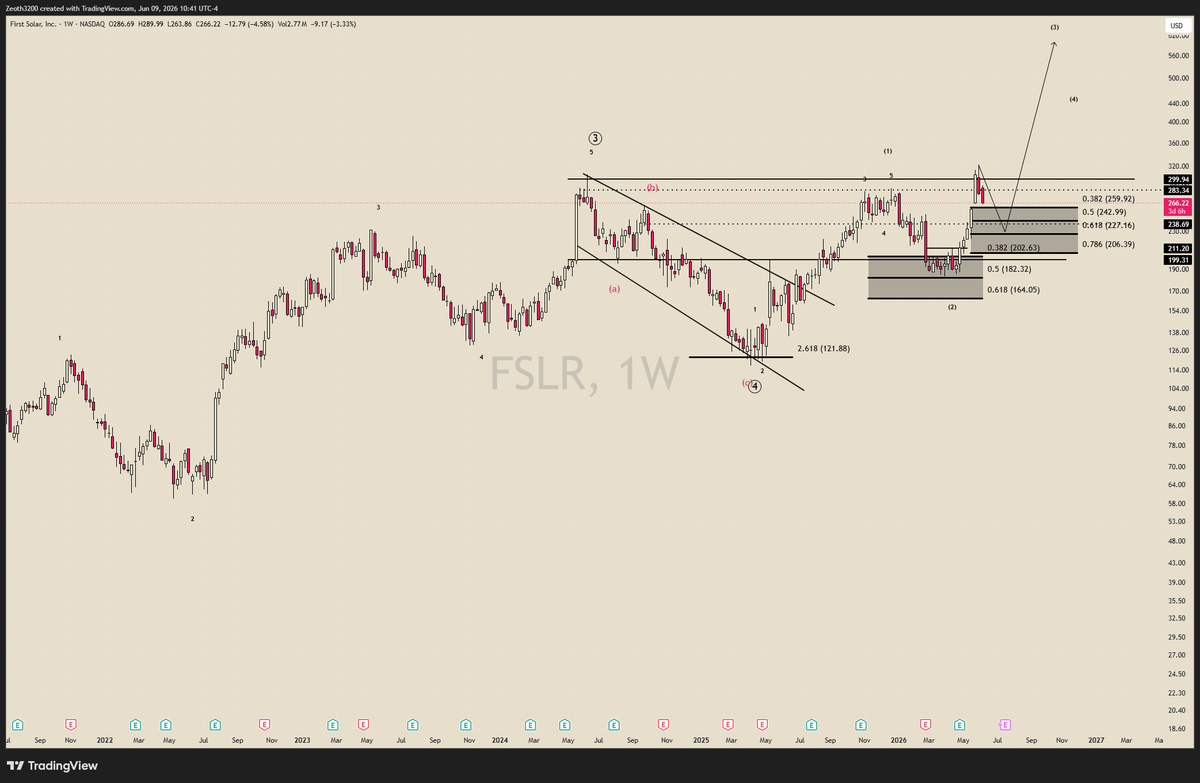
$FSLR one can argue that this is a huge base and ready and i do agree with that but it is not ready yet imo. This will come down to 227 that is the optimal place to buy shares or leaps. IMO, this will trade north of 560 with time .
2
9
1,323
Jun 9
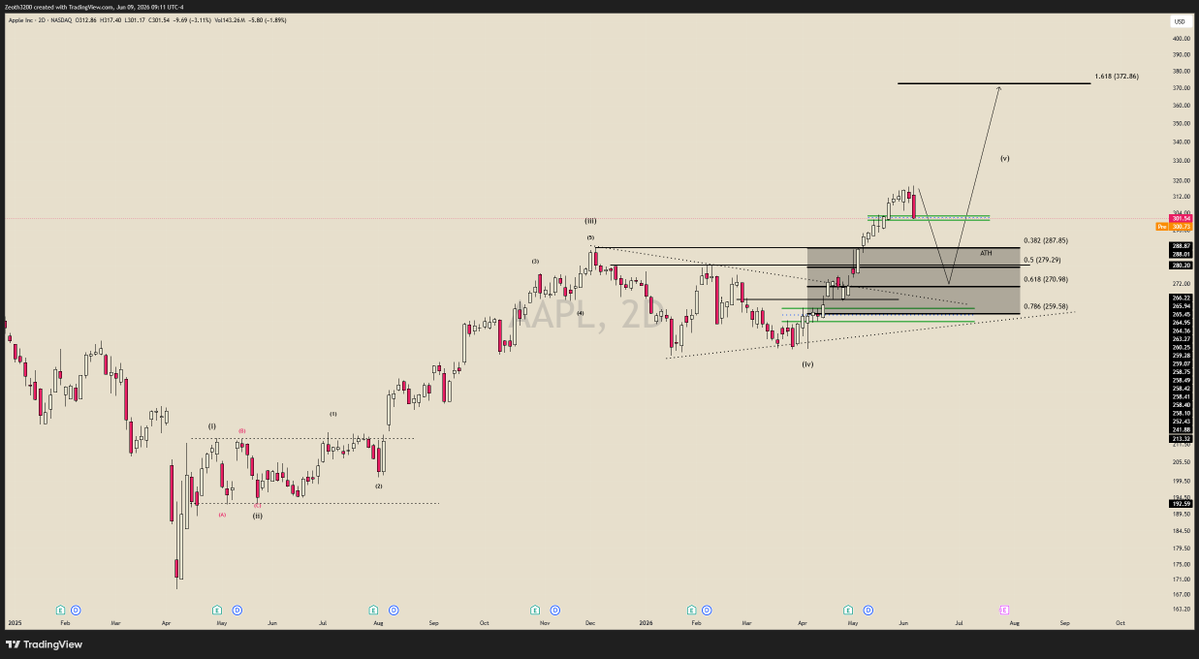
$AAPL if and if it cannot hold 300 there will be a sexy 30/40$ drop on this name. it will give another insane opportunity to long at those level targeting $372. Both side can be played with time
2
5
1,490
Jun 9
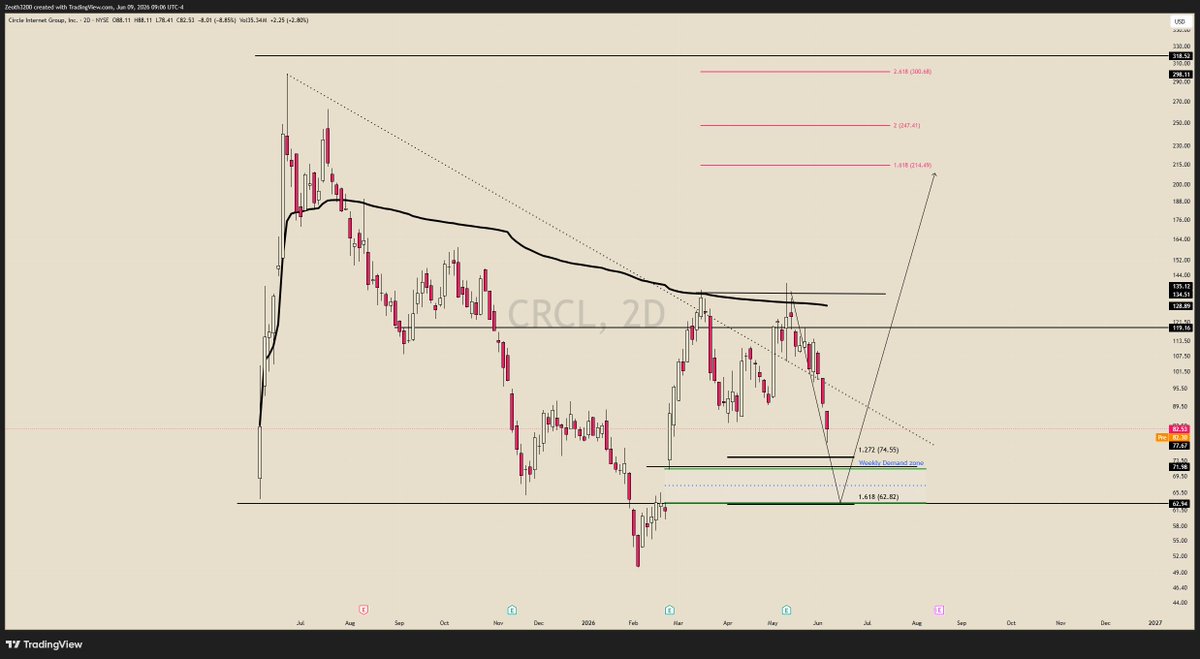
$CRCL jerk moment here . I think one more low is due here on this name for the 5 of the C of 2 .
3
1
9
2,432