
Research Fellow in Infectious Disease Modelling @cmmid_lshtm @LSHTM, previously @SussexUni 👩🏻💻 Mathematics PhD 🎲 Views my own 🏳️🌈📷⛰🚲🥑🌺
- Tweets 404
- Following 649
- Followers 2,831
- Likes 439
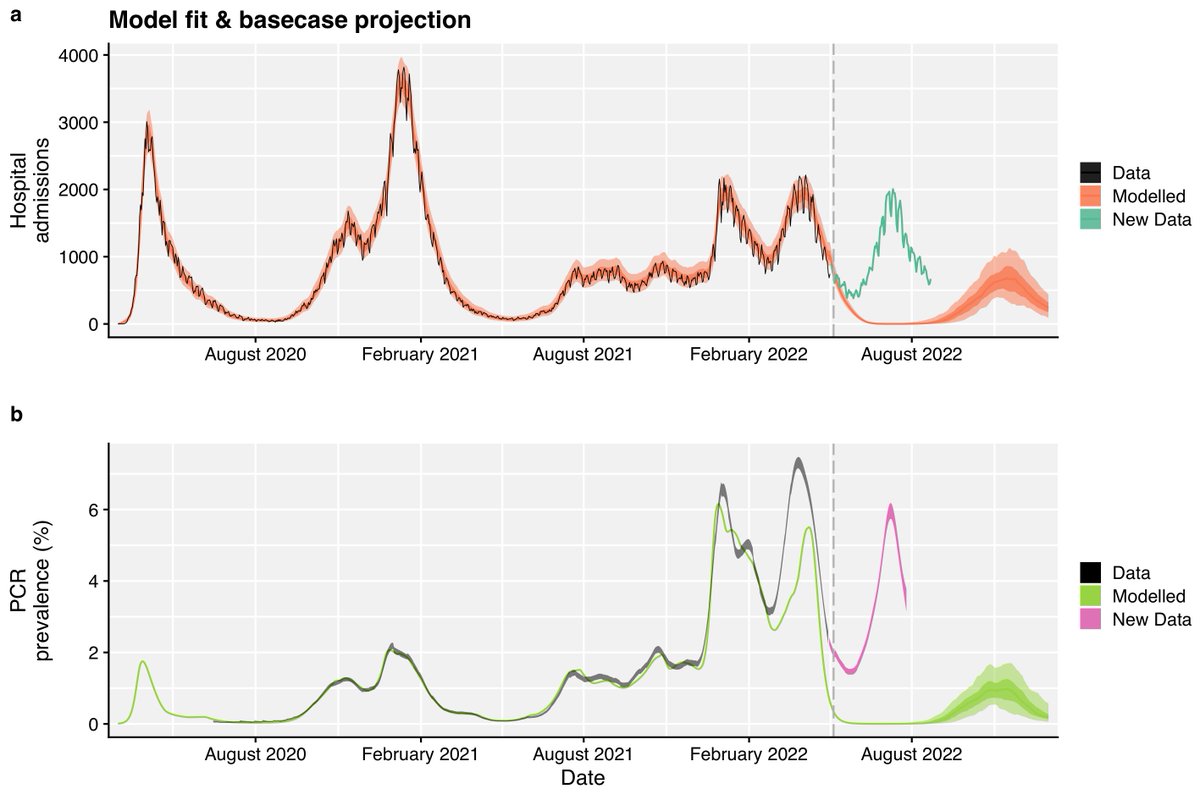


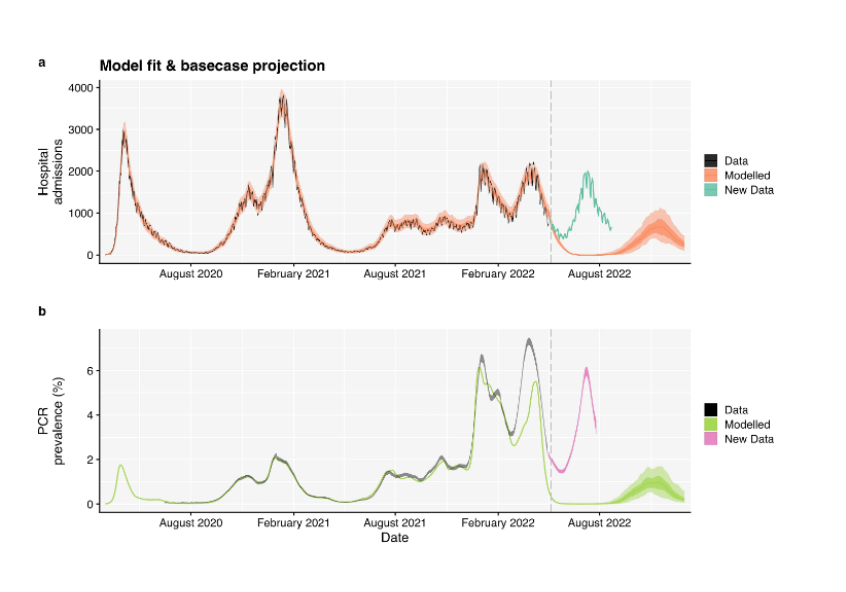

ALT Plots showing the aggregated model fit to data between March 2020 and May 2022, and the resulting basecase model projection between May and December 2022 for England. New data from May to August 2022, which was not used for the original model fitting, is shown in alternative colours as a comparison to model projections. (a) The number of COVID-19 hospital admissions per day. (b) The proportion of the population in England testing PCR-positive for SARS-CoV-2 between March 2020 and December 2022. In both plots, the vertical dashed line denotes the date at which model fitting processes were run to produce both the model fit and projection. This Figure has been adapted from Figure 4 in Barnard et al., available at: https://www.nature.com/articles/s41467-022-32404-y


ALT Gender-diverse teams produce more novel and higher-impact scientific ideas
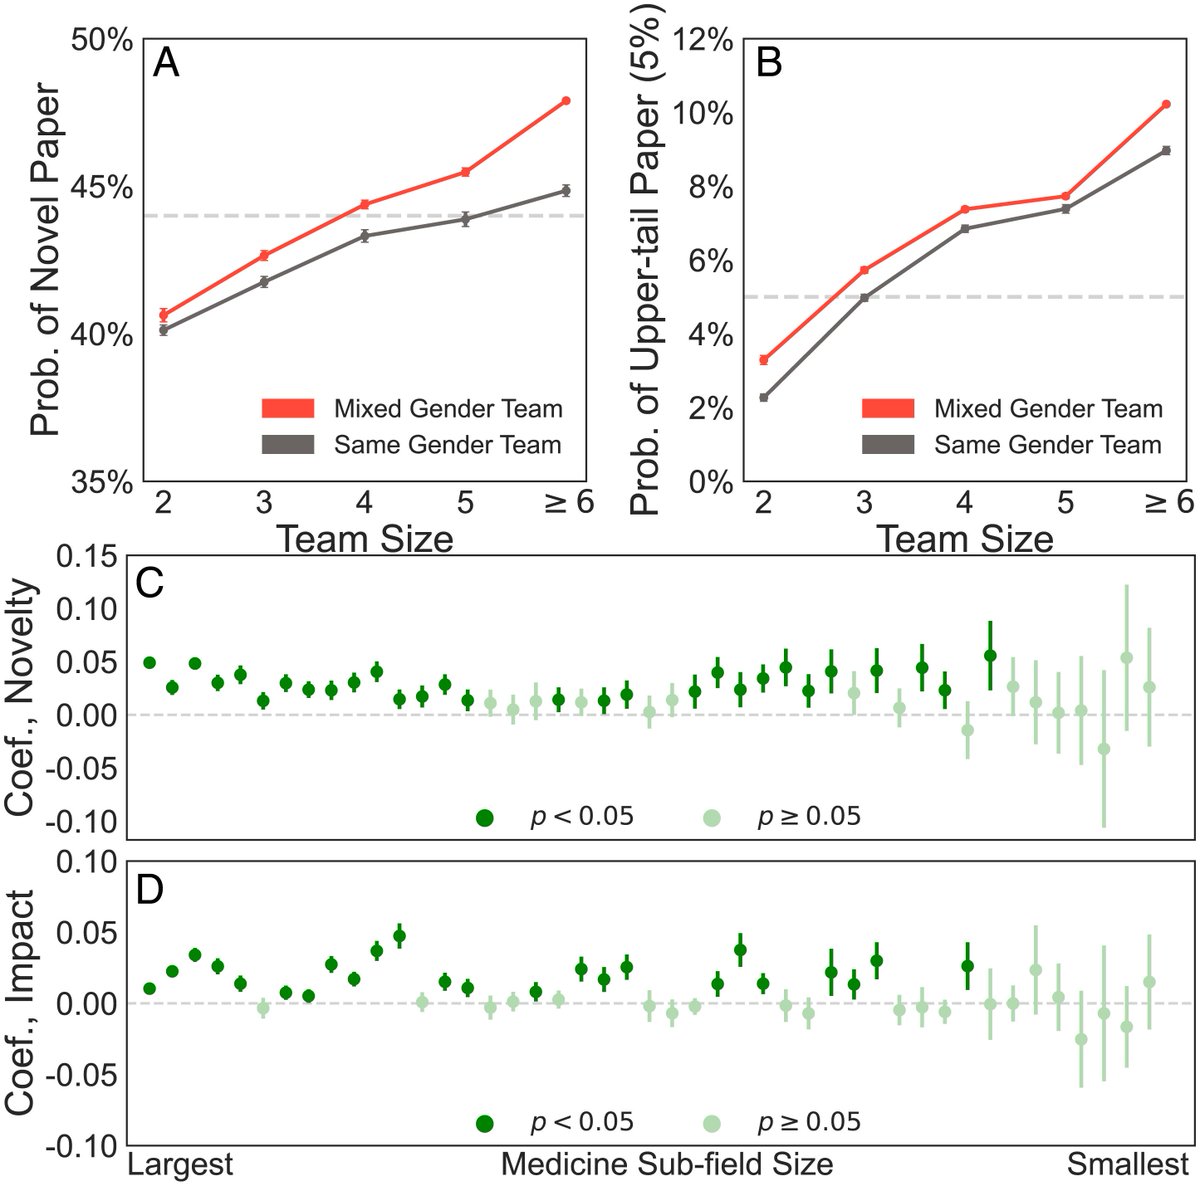
ALT Figure 2 from PNAS publication