Joined January 2025
- Tweets 8,219
- Following 244
- Followers 3,996
- Likes 11,334
3,692 Photos and videos


Pinned Tweet

12 Sep 2025
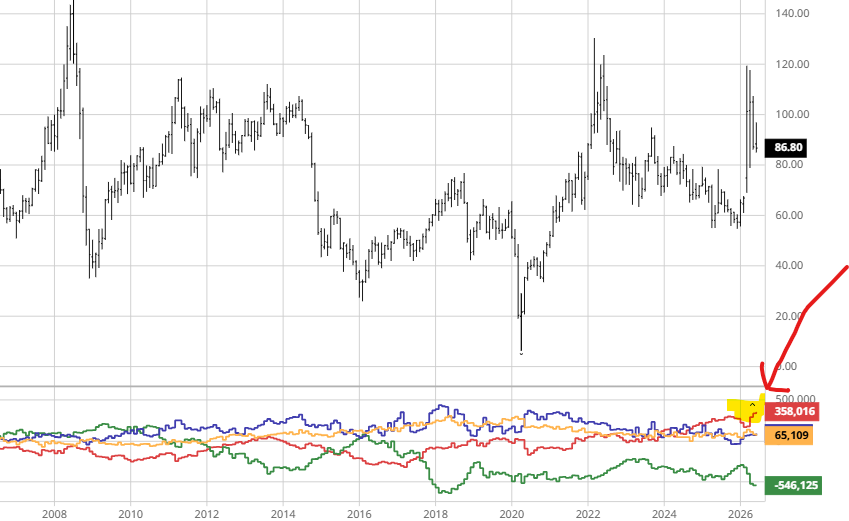
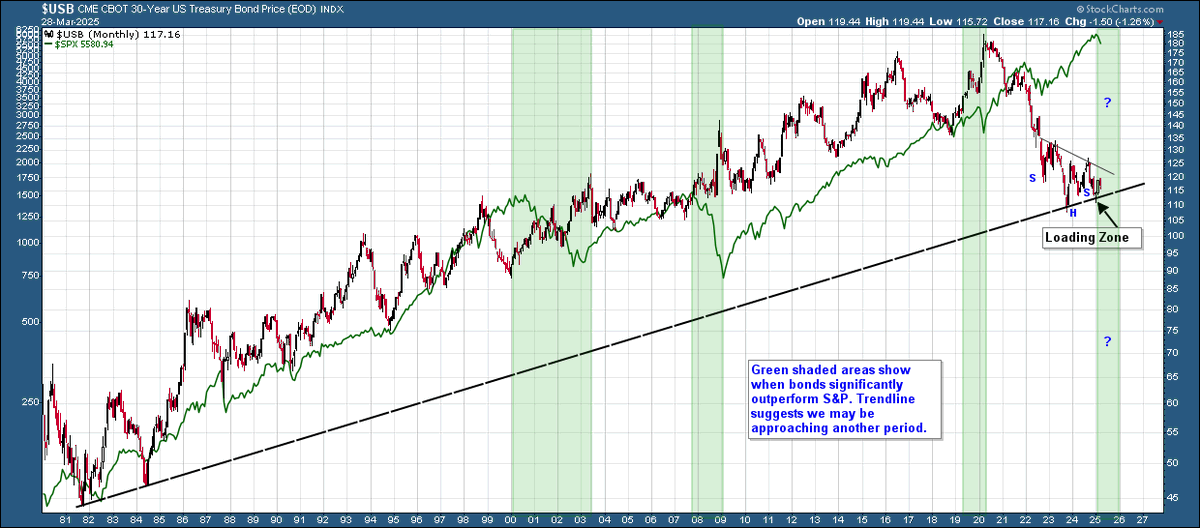
#bonds $usb Update from my March 2025 chart. I think the turn is now underway and soon bonds will outperform the S&P as rates and economic expansion both head lower.

29 Mar 2025

$usb #bonds My 30-yr bond chart originally developed in Dec and prompted me to overweight my retirement funds in bonds on Jan 1st. That allocation has smoked the S&P YTD. The big picture matters. Understanding historical market context matters. Bonds will outperform S&P rest of the year.
7
44
61,178
8
890
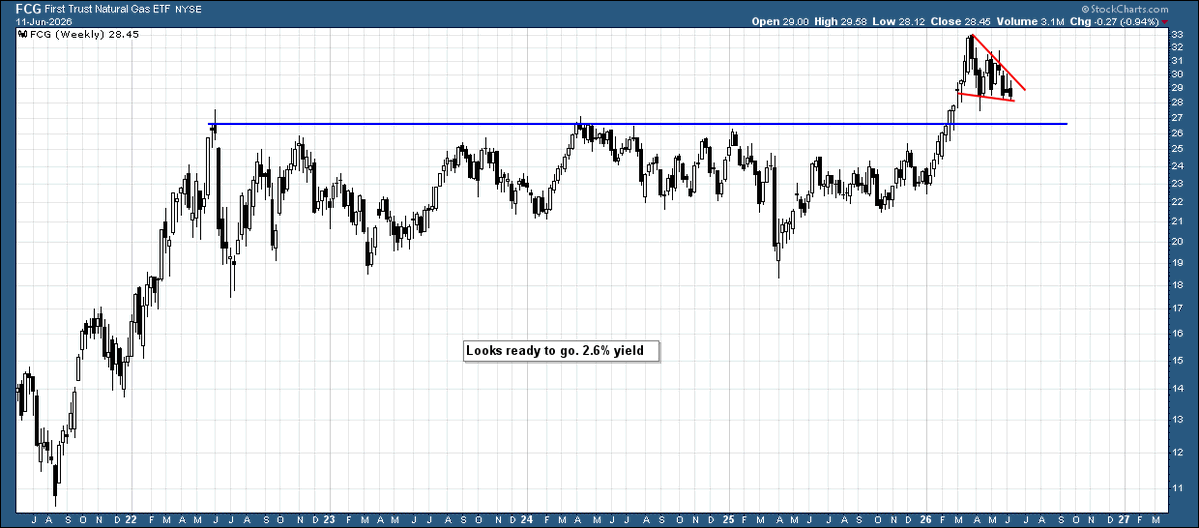
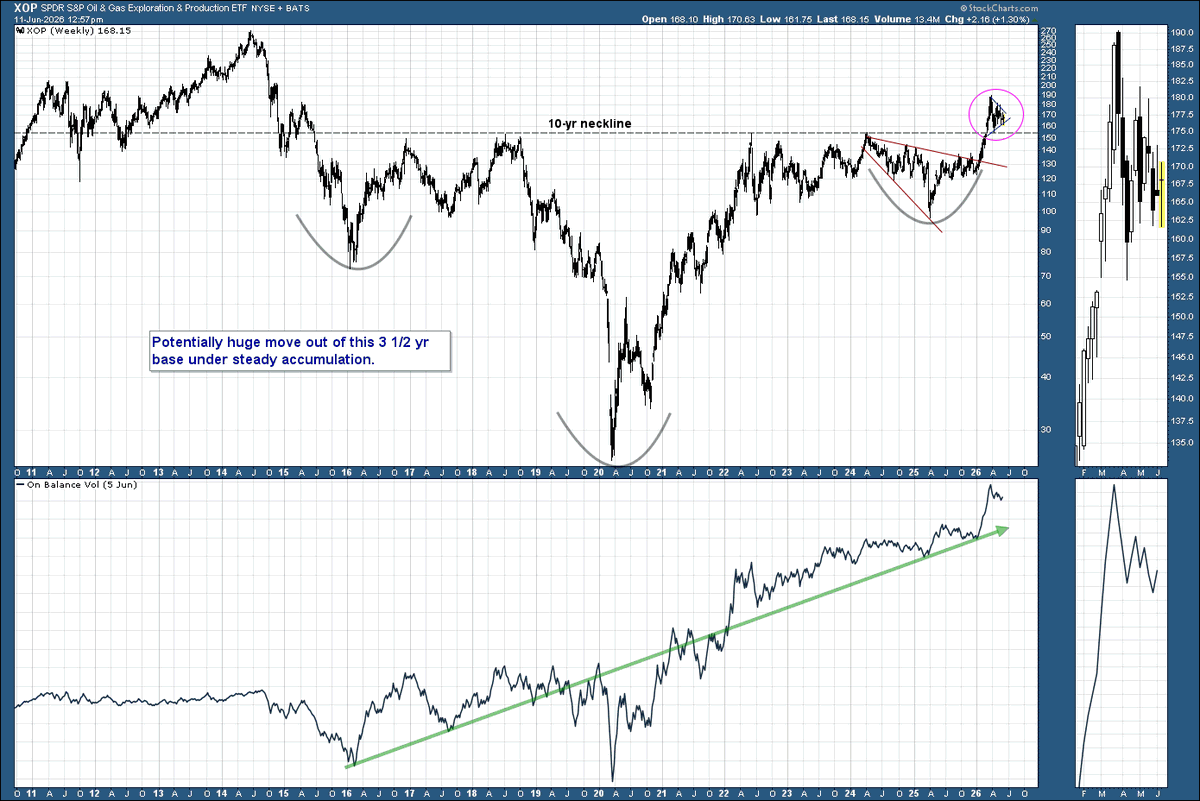
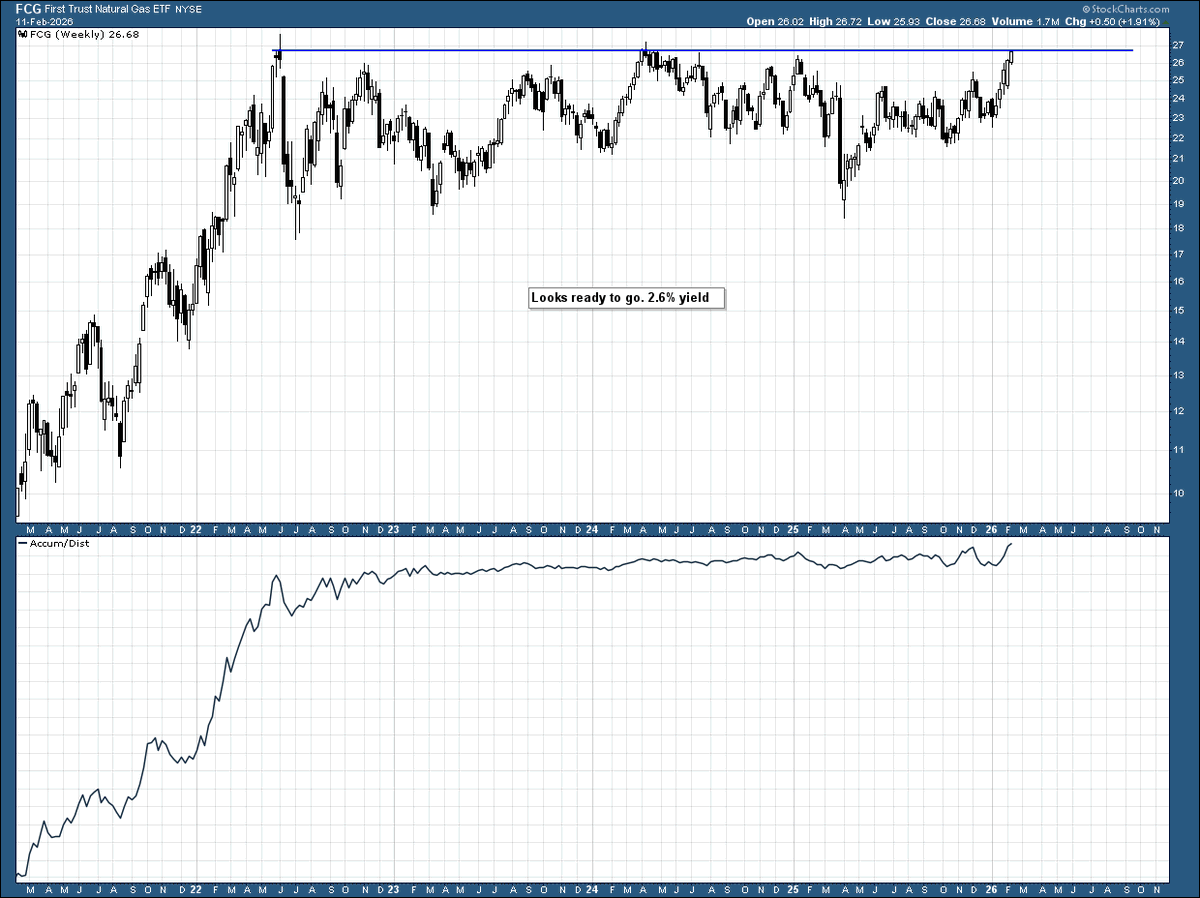
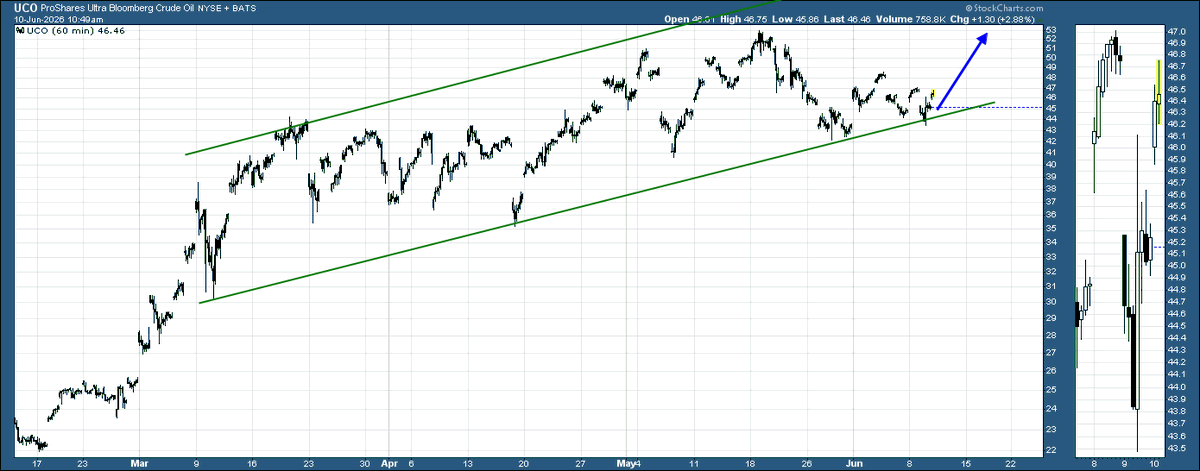
#natgas $fcg Update from Feb. We had the breakout months ago, now we have a flag consolidation. I think NG is lulling people to sleep but it poised for a sharp move higher which will likely catch most flat-footed.
#NATGAS $fcg This natgas ETF focused on midstream and E&P sector companies looks just about ready to pop any day now.
2
9
1,748
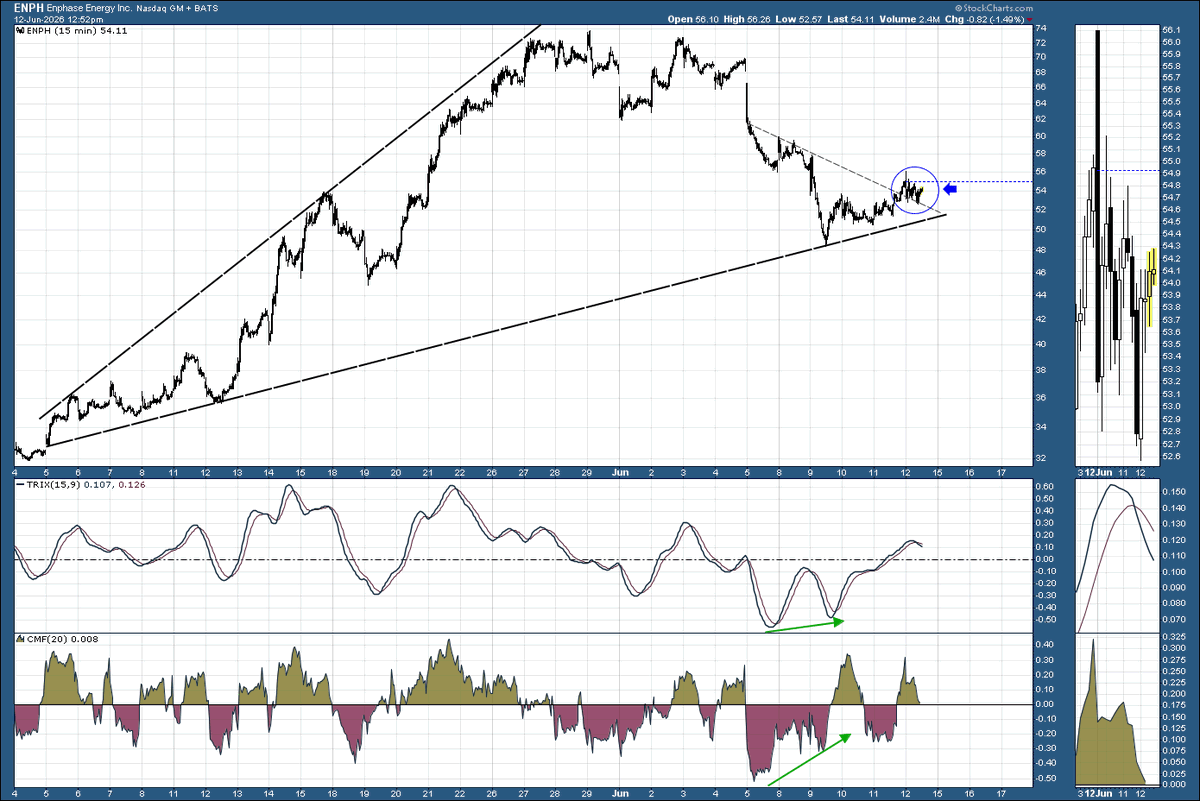
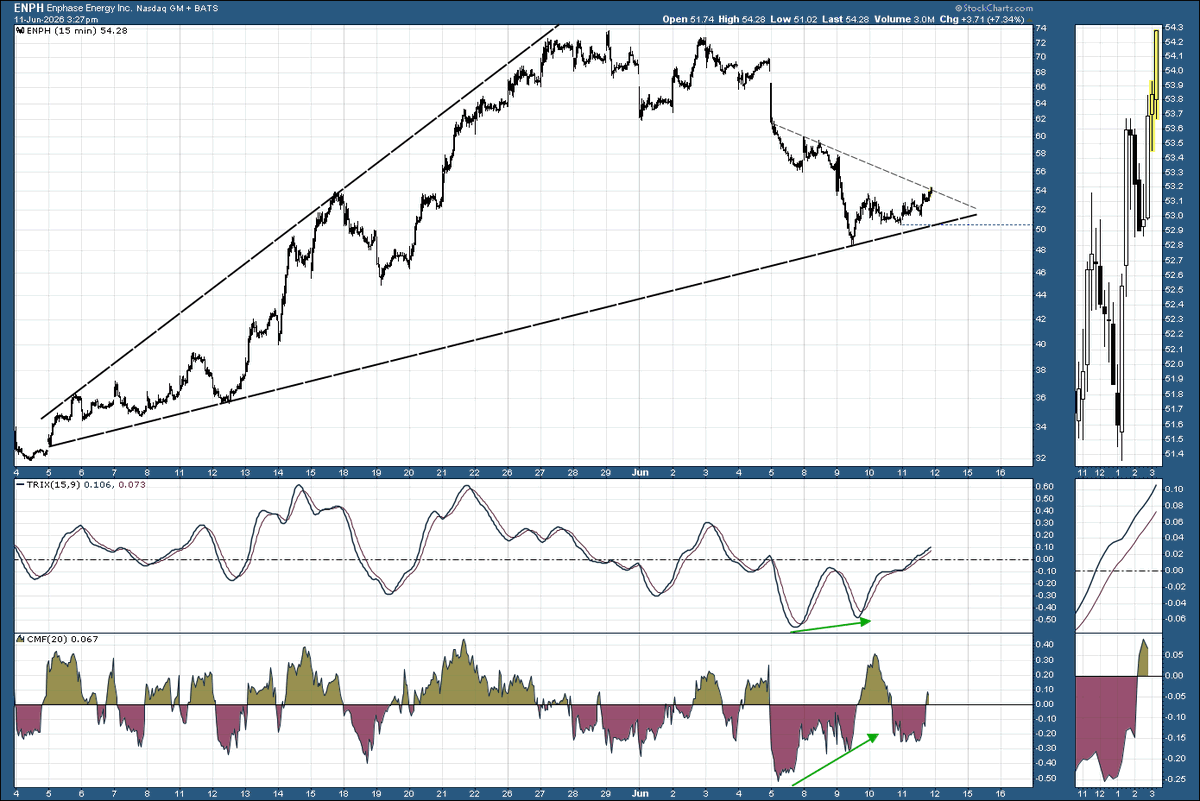
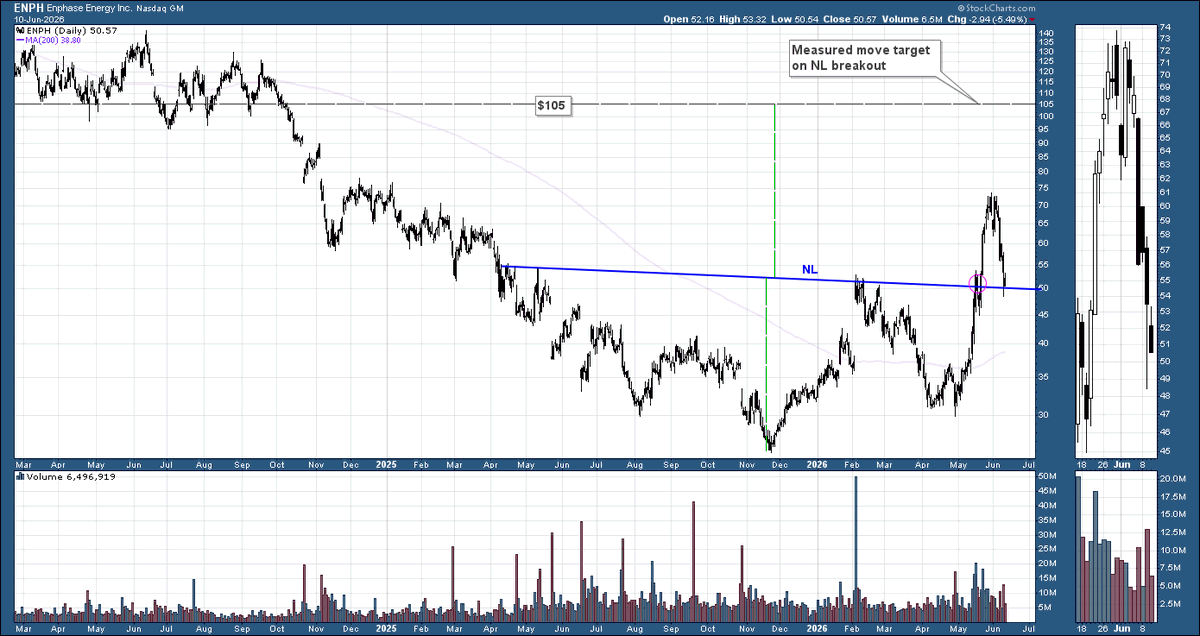
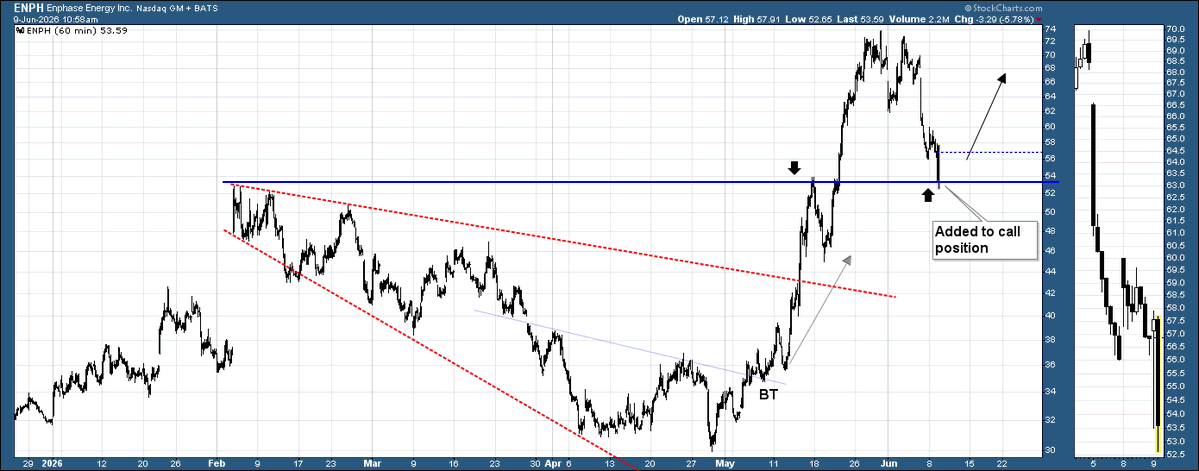
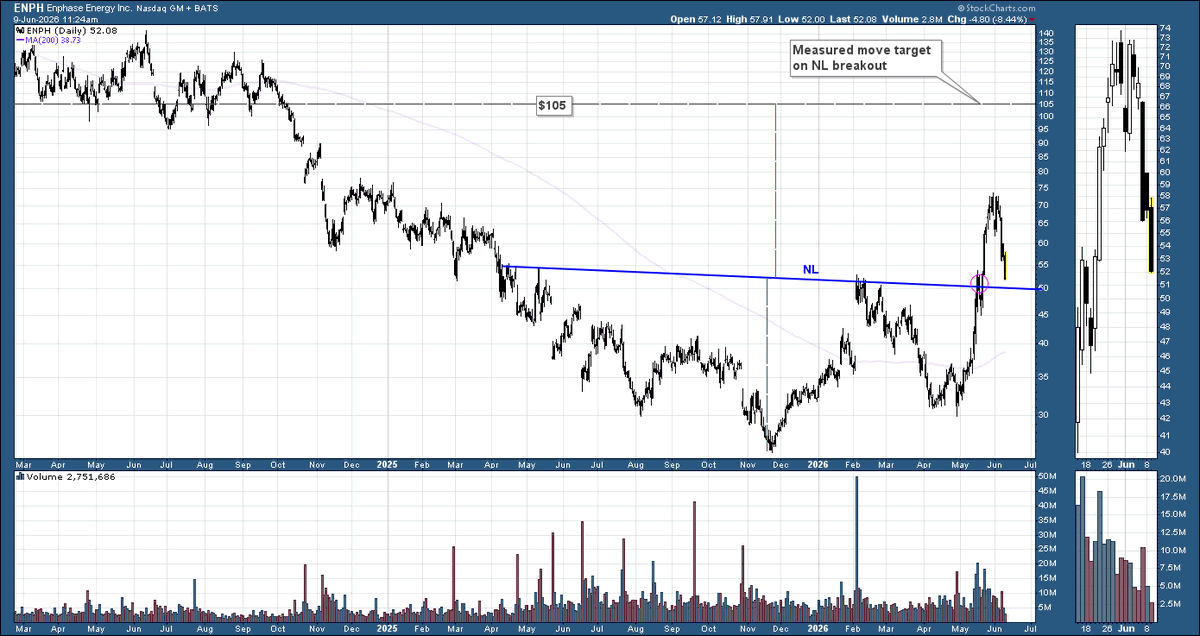
#enph Reversal right on the neckline, suggesting that former resistance has turned into fresh support.
7
632
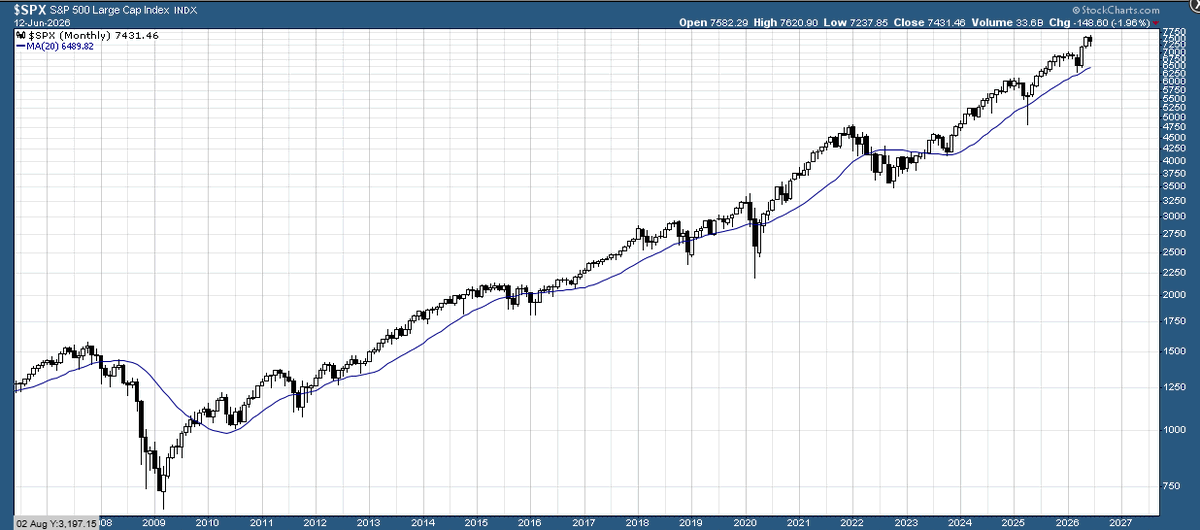
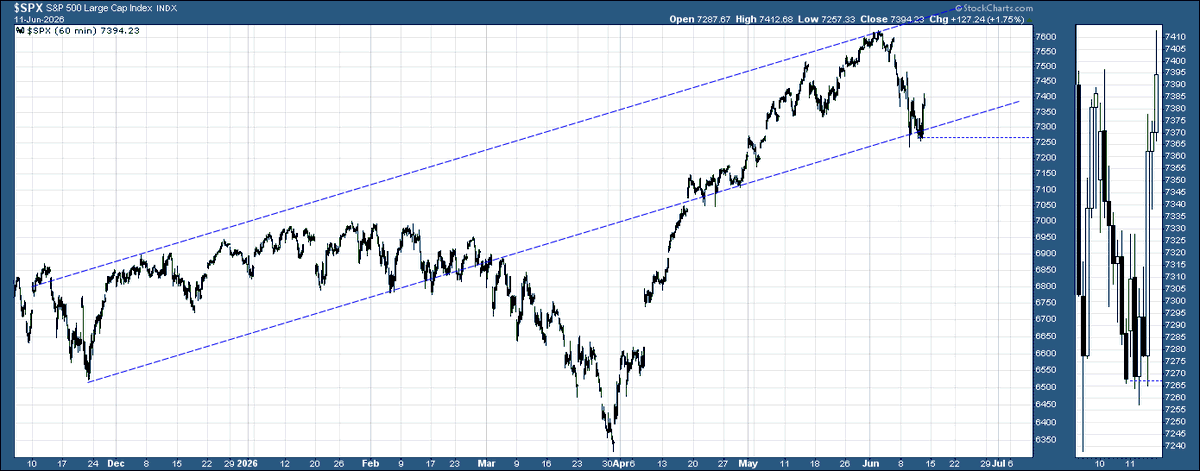
$spy I was tracking this channel on the hourly S&P and suspected we'd see a bounce here. I feel this is only "quasi-TA" but it is interesting when you find structures.
7
598

2
2
12
1,060
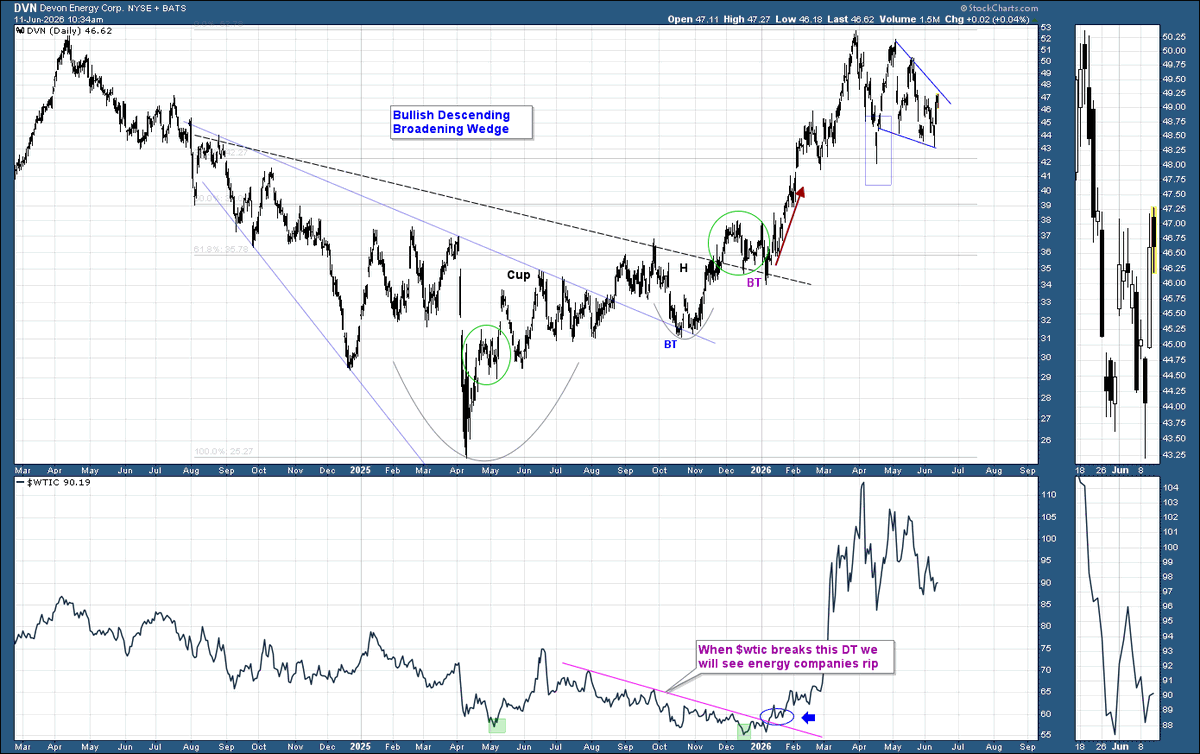
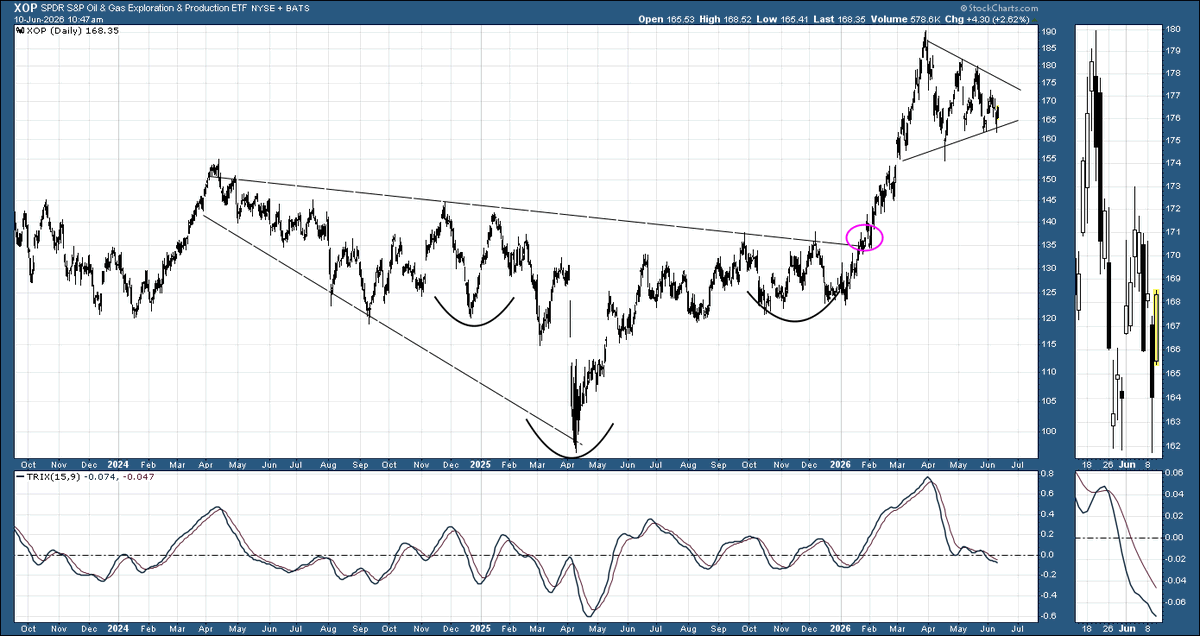
#energy #oilandgas $dvn Some of you may recall this chart that I've been posting for more than a year. Looks like we are getting ready for the next move up out of this consolidation.
3
17
910
6
1,175
1
2
11
810
#homebuilders $xhb Update: Resolved to the upside, breaking resistance. Interesting.
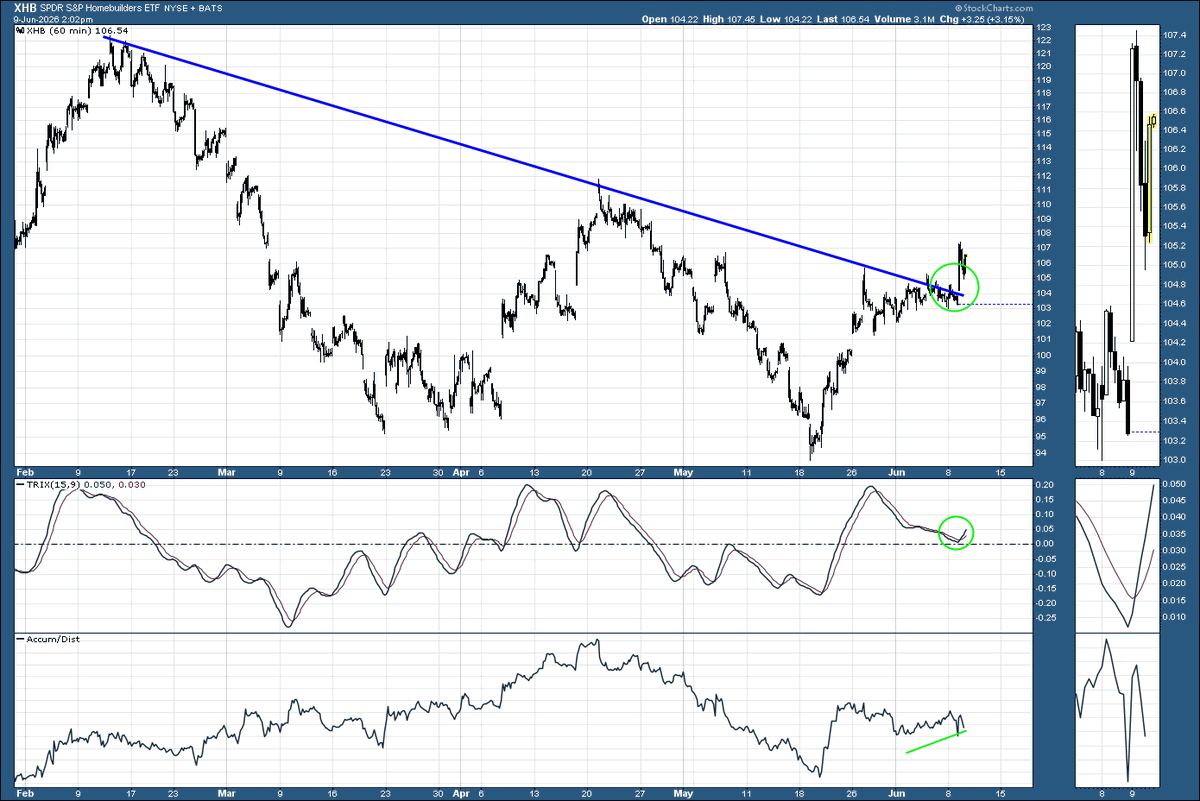
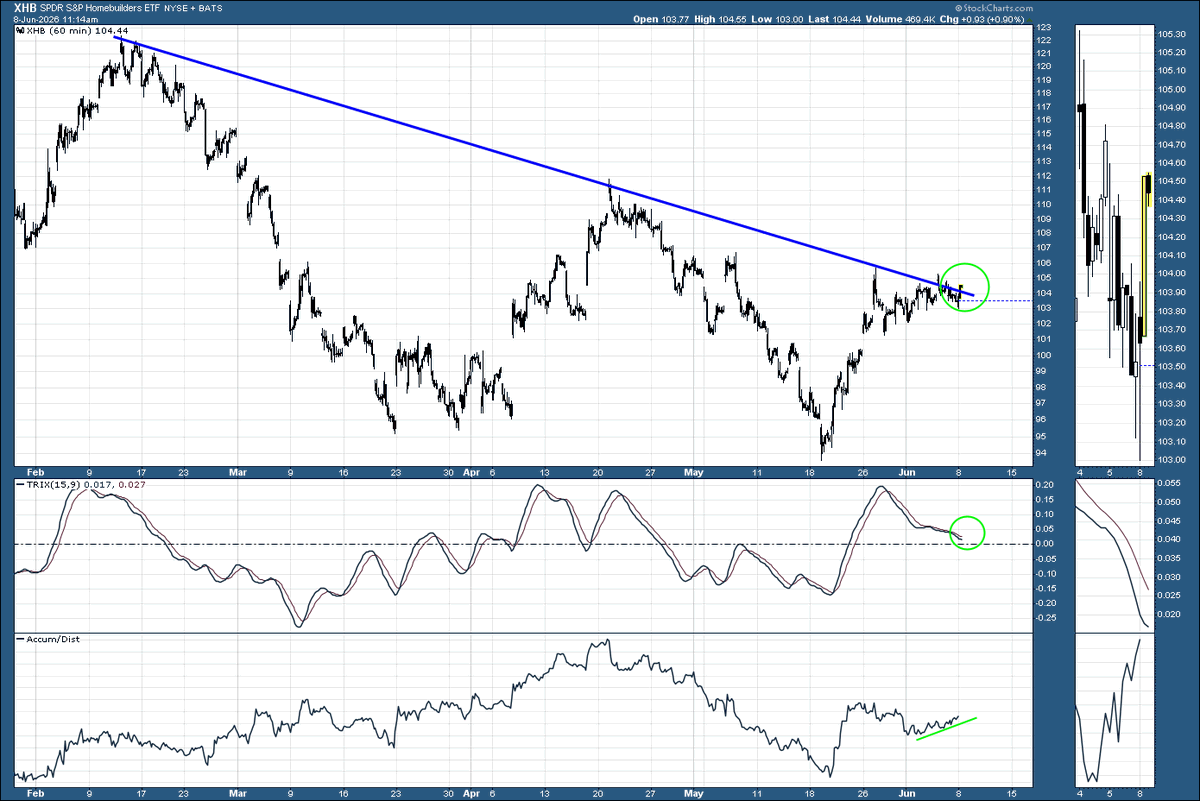
#homebuilders $xhb Interesting juncture for homebuilders here, coming off the heels of a Friday market freakout that Fed may be in hold or tightening mode. Someone is wrong.
3
11
2,094
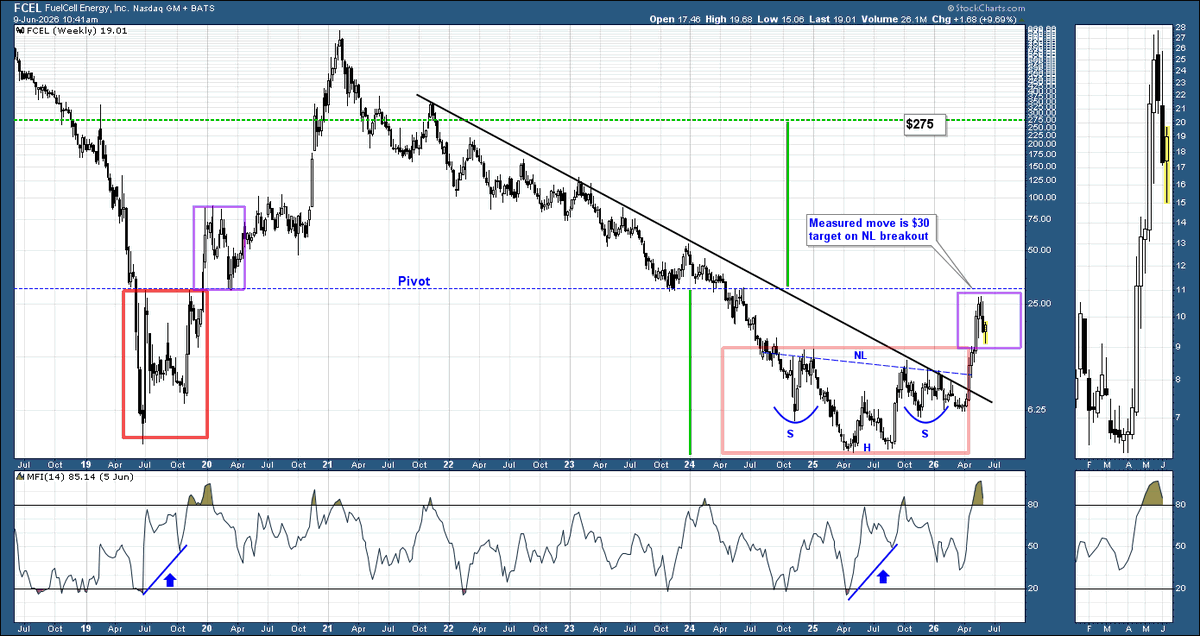
$fcel Refreshed view of the weekly. Nothing has changed in my outlook for past 6 months. Tracking.
1
1
16
1,166
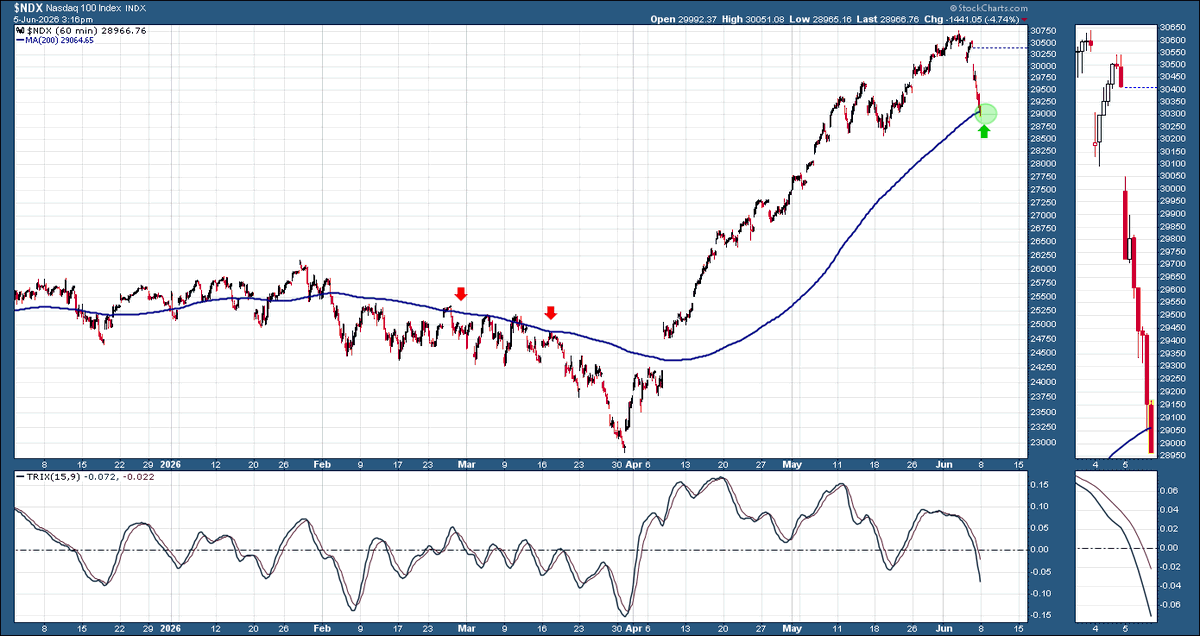
#nasdaq100 $ndx Update: Funny how that happens😉
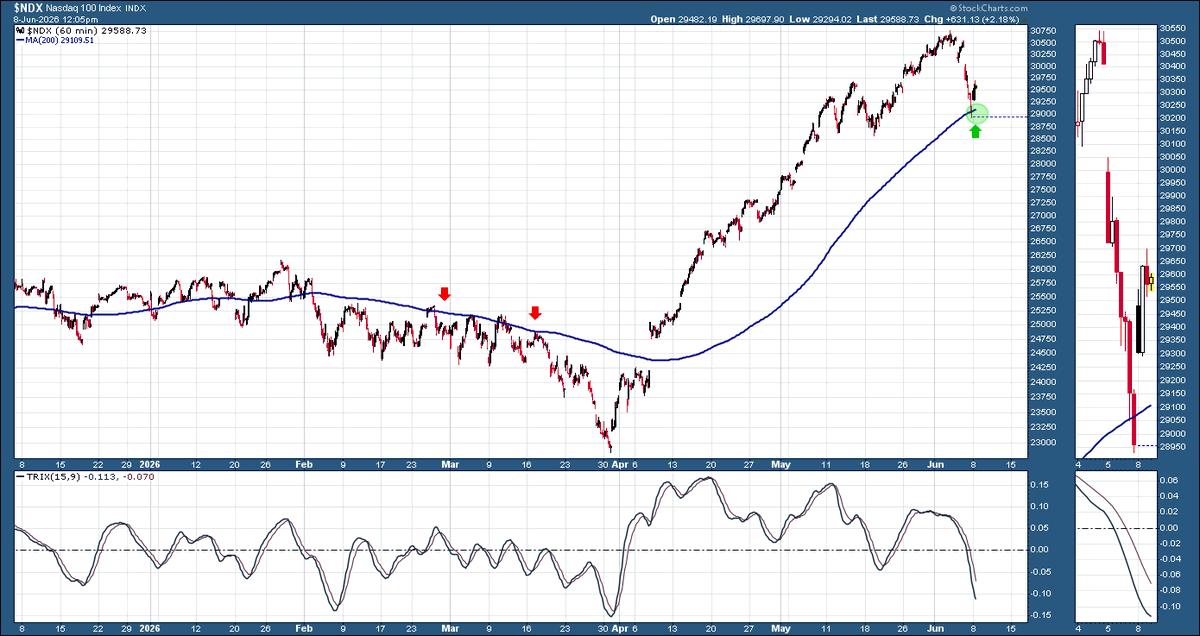
#nasdaq100 $ndx Now tagging the 200MA on the hourly chart. Tends to be significant.
1
10
1,243
#homebuilders $xhb Interesting juncture for homebuilders here, coming off the heels of a Friday market freakout that Fed may be in hold or tightening mode. Someone is wrong.
1
11
2,833