
Blog boy @palaceofpistons, beat-maker, Wine Boy, Eleanor Roosevelt lookalike. I heard he dropped dead off the fent, they shot him jumping out the whip
Joined April 2008
- Tweets 66,695
- Following 695
- Followers 1,324
- Likes 39,886
1,986 Photos and videos


Pinned Tweet

7 Mar 2016
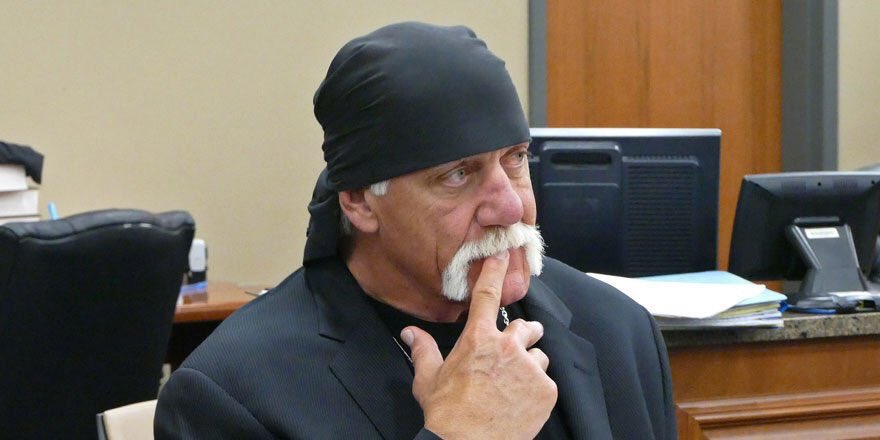
"Brooke, fetch me my formal bandanna, I don't want to look silly in court."
1
9
75
Jasper Apollonia retweeted

This is not what nyc looked like tonight and anyone trying to convince you it did is lying/exaggerating for money

146
486
7,537
341,094
Fuck me man, we’re treating the national team like Ben Affleck’s relationships
Jun 13

🚨🇮🇹 OFFICIAL: Roberto Mancini decides to part ways with Qatari side Al Sadd. 👋🏽🇶🇦
He’s the main candidate to become next Italy National Team head coach. 💙🔙
Mancini already said yes to the job, waiting for Federation to confirm their plans.

1
172
Katy Perry getting referenced on the broadcast but not Justin Trudeau who’s the former prime minister of one of the host nations is very funny
4
451
(Through gritted teeth) I’m really glad the Knicks won (blood starts forming on my gums because I’m clenching my jaw so hard) you guys deserve this (every tooth in my mouth explodes into dust)
3
191
Watching this series has convinced me that the Knicks are a team of pain pigs. They simply cannot achieve peak performance unless they are getting their collective balls crushed in a vicegrip.
1
205
Jasper Apollonia retweeted

Jun 10
Jun 9

Overheard on the streets of NYC: “The problem with last night: it was supposed to be a Knicks game. But it turned into the Met Gala. All of these rich people poured in -- paying $10K to $150K a ticket. And then they sat there with their pinkies sticking out while the refs were committing FELONIES against our team! We were in foul trouble TWO MINUTES into the fourth quarter??? GET OUTTA HERE!! The refs must have been bought and paid for by the league! They want to keep the series going so they can keep making money. BUT THE FANS SHOULD HAVE BEEN TEARING THE PLACE APART WITH EVERY BAD CALL!! SCARE the refs!! Make em fear for their LIVES!! THIS IS NEW YORK FREAKING CITY GODDAMMIT !!!!”
1
2
21
3,032
Jasper Apollonia retweeted

Jun 9
Overheard on the streets of NYC: “The problem with last night: it was supposed to be a Knicks game. But it turned into the Met Gala. All of these rich people poured in -- paying $10K to $150K a ticket. And then they sat there with their pinkies sticking out while the refs were committing FELONIES against our team! We were in foul trouble TWO MINUTES into the fourth quarter??? GET OUTTA HERE!! The refs must have been bought and paid for by the league! They want to keep the series going so they can keep making money. BUT THE FANS SHOULD HAVE BEEN TEARING THE PLACE APART WITH EVERY BAD CALL!! SCARE the refs!! Make em fear for their LIVES!! THIS IS NEW YORK FREAKING CITY GODDAMMIT !!!!”
11
198
20,264
Attaboy Hesser @JDH_91
Jun 6

BOYS LACROSSE: Senior-led Country Day (@DcdsLacrosse) claims 2026 D2 title with first-year coach JD Hess >> bit.ly/4e2xIA0
@DCDSAthletics


1
309
Jasper Apollonia retweeted

Jun 2
Happy Pride if you're a guy, or you're a girl, or maybe you're something different
8
574
4,187
134,285
Thank you for listening! We’ll be talking a lot more off-season in the next few weeks
May 23

@BladeCunningham @AJohnsonNBA loved the pod today. My favorite FA for Detroit is Ayo Dosunmu. Favorite trade target is TM3, knowing he’d be expensive to pry away.
2
817
Jasper Apollonia retweeted

May 23
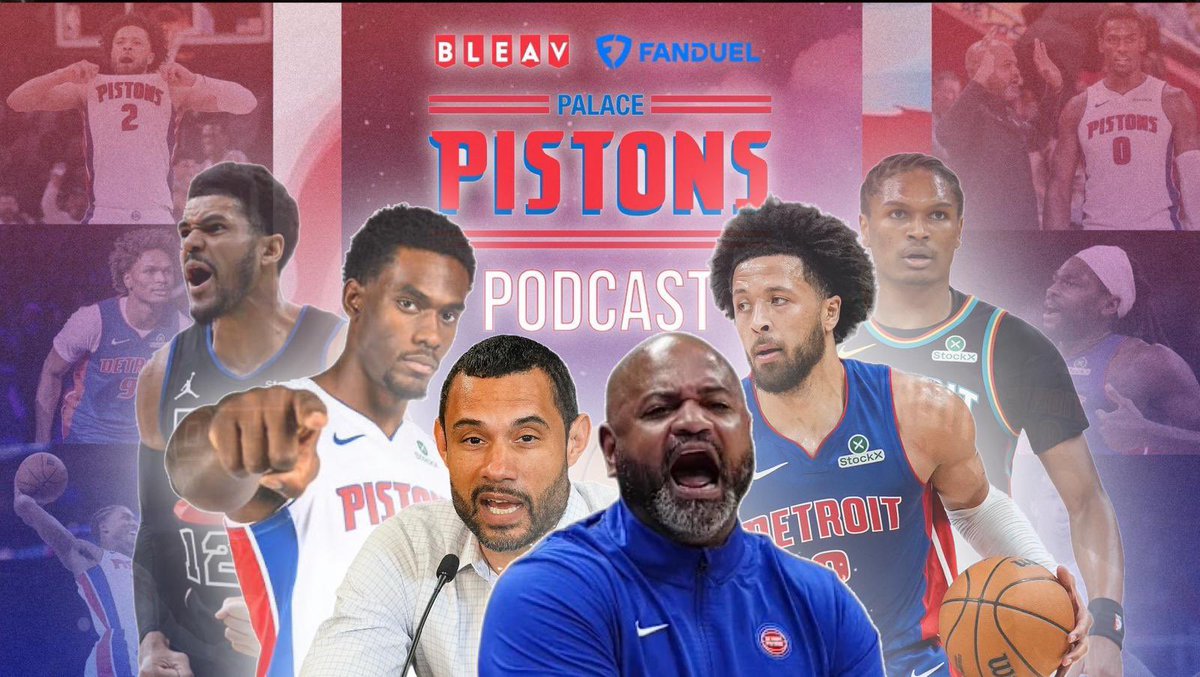
After our eulogy to the 2025-26 Detroit Pistons, @BladeCunningham and I previewed our biggest big names the Pistons could target this offseason. Lots to take in here and more offseason talk to follow in the coming weeks.

The season ends in heartbreak, but the biggest questions for the Pistons are just beginning.
🏀 Game 7 reactions
🎤 Trajan Langdon’s end-of-season presser
👀 Jalen Duren extension talk
🔥 KD/Kyrie offseason possibilities
@BleavNetwork @FanDuel
Watch: youtu.be/_FM4DoiQCoc
1
4
985
Cade still has a lot of work to do with his turnovers, but this chart helps illustrate that the sheer number of his TO’s is more based on his workload than anything else
May 22

Castle's turnovers have been bad no doubt, but he's also led the spurs by far in time of possession, so i wanted to look at how his TOV rate compares to the league over the last couple postseasons.
Here's a chart.
➡️ Throwing bad passes more often
⬆️ Losing the ball more often

4
4
45
8,492
It’s not great, but it’s pretty much right in line with the rates of most other lead ballhandlers and shot creators. You gotta just take some of the work off of his plate.
3
158
Thinking about what German Kids Bop would be called…probably something like “Kinder Boppin” much to consider
234
Jasper Apollonia retweeted

May 20
I covered Jason Kidd when he played for the Nets. I know one of his childhood friends. I've been to his house, met his kids, then-wife, and Pilates Instructor. And I have insight from many people who worked with him in his coaching years. This is a great firing.
331
1,105
17,097
2,812,606
Sounds like someone’s cortisol levels got spiked after getting brutally framemogged by the Bad Boy of Pistons Twitter 😂😂😂

Yeah it is. You are too much of a fool to realize that they lack 2 legit scorers. You’re larping commie looksmaxing cohost begged to play the cavs
1
3
553
I was talking about this in 2022 when the Cavs made the trade for Donovan Mitchell.
There comes a day for every young team that you have to make that consolidation move. You can’t stay emotionally attached to every guy, that’s the league unfortunately.
May 18

The Great Consolidation is upon us. There won’t be an 11.5 man rotation next year.
2
2
72
12,621
The Cavs went from 22 wins in 2020 to 44 wins in 2021 with JB. Amazing improvement for a young team. The only guys left from that era are Evan Mobley, Jarrett Allen and Dean Wade. Things change.
2
6
927