Real Name: Borg 🌍📈📉💵 Price Action Teacher and Trader, providing guidance and mentorship in chart analysis. My approach is firmly rooted in Price.
Joined June 2009
- Tweets 40,304
- Following 1,782
- Followers 21,114
- Likes 47,614
22,018 Photos and videos

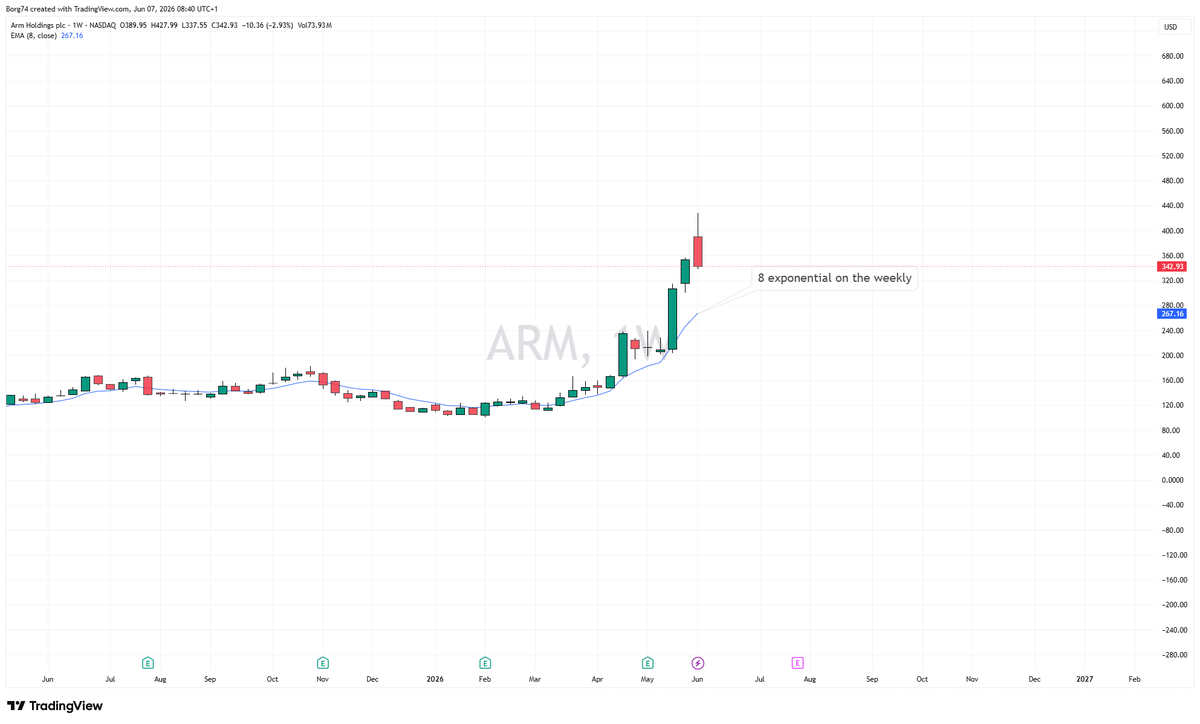
My favorite Time Frame for spotting a set up and determining bias has to be the .................................
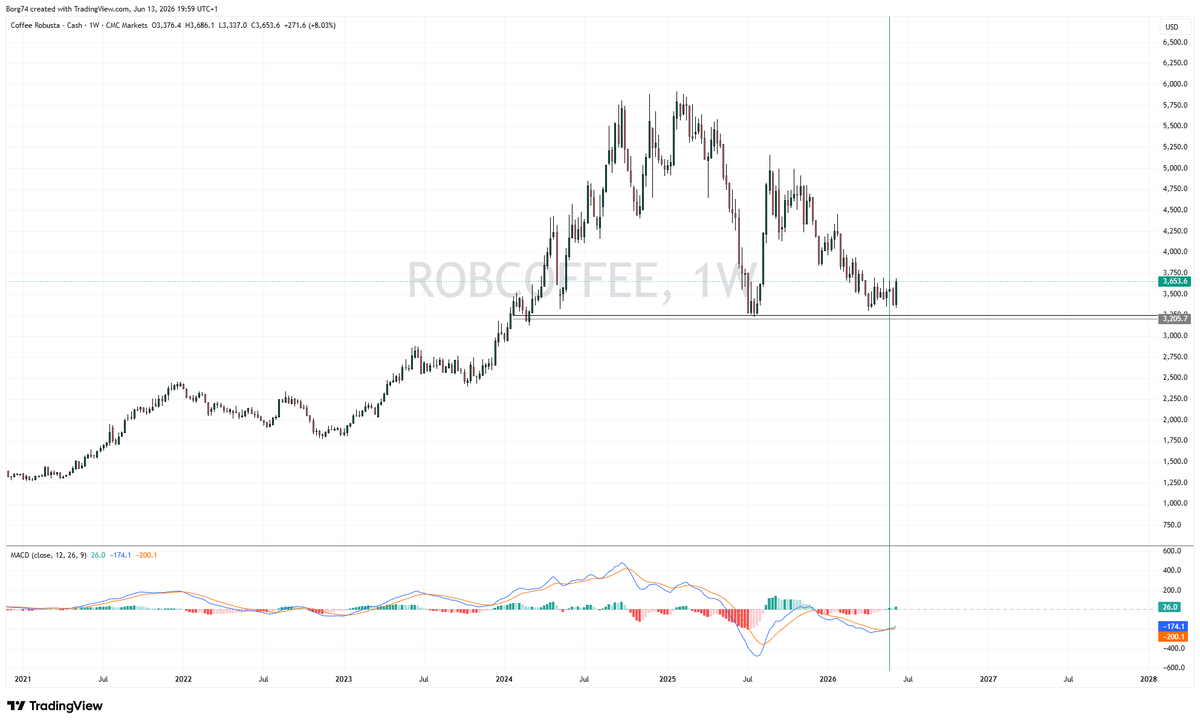
Do you see what I see? #ROBCOFFEE
2
9
1,138

Jun 12
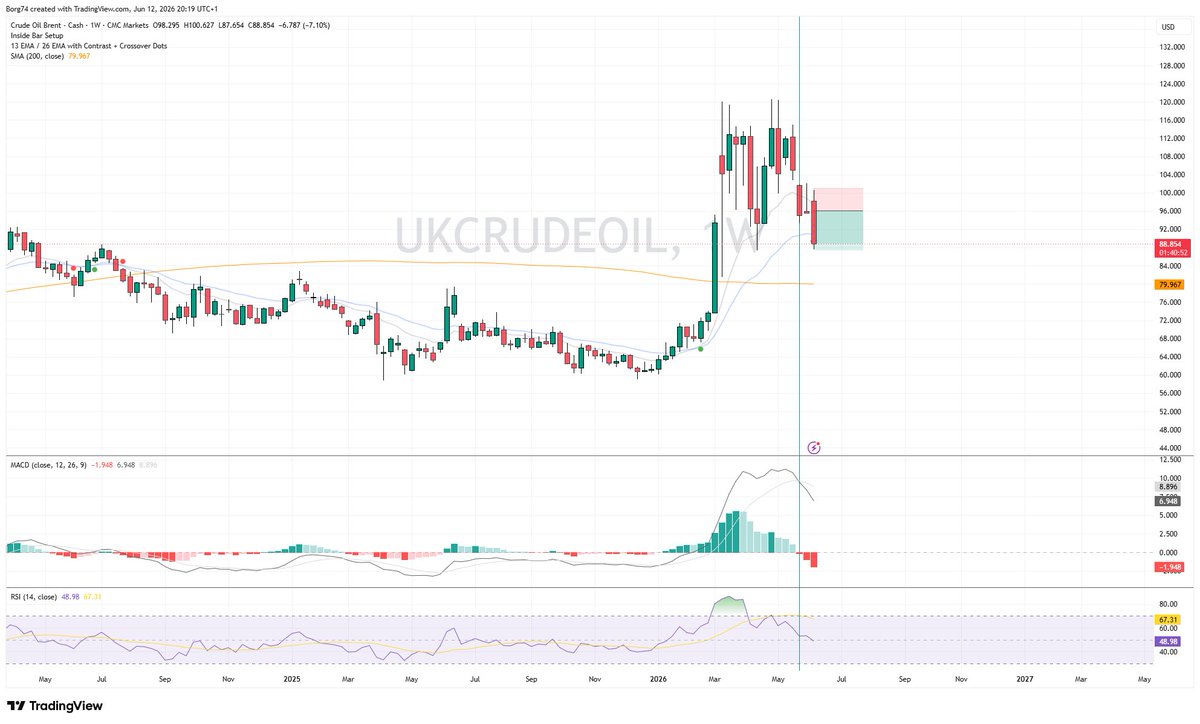
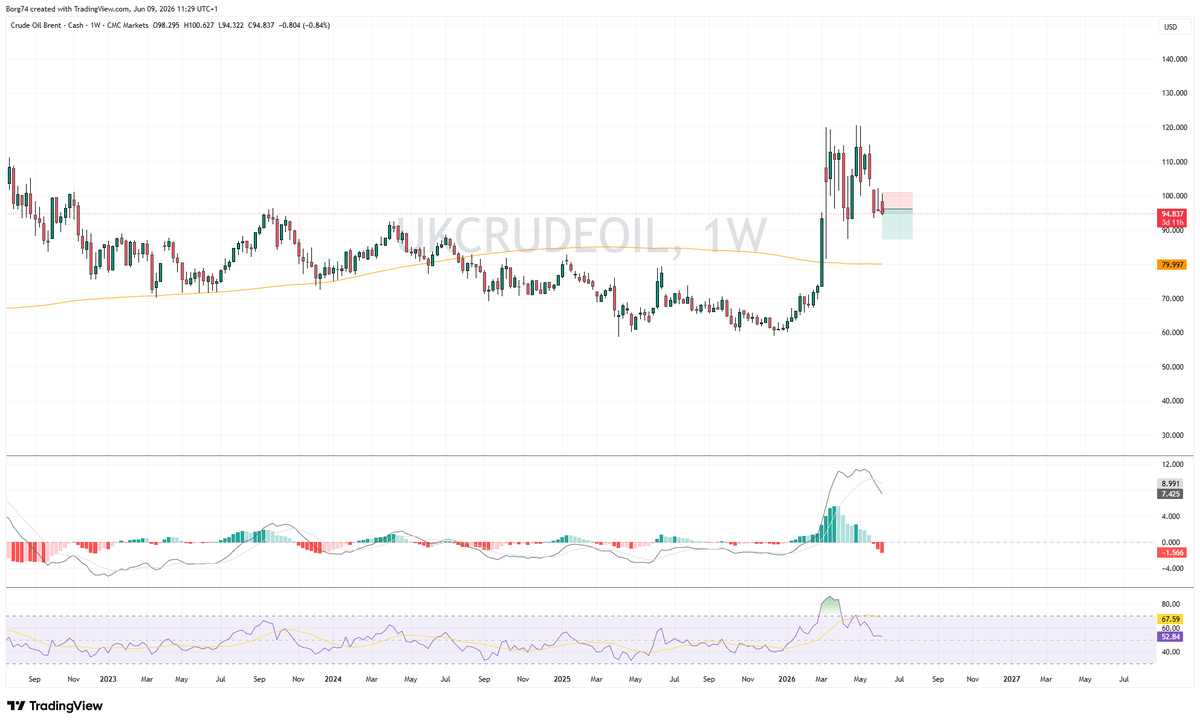
I saw a Bearish MACD X on the supertanker Weekly TF
#OIL weekly chart is very powerful.
1
5
586
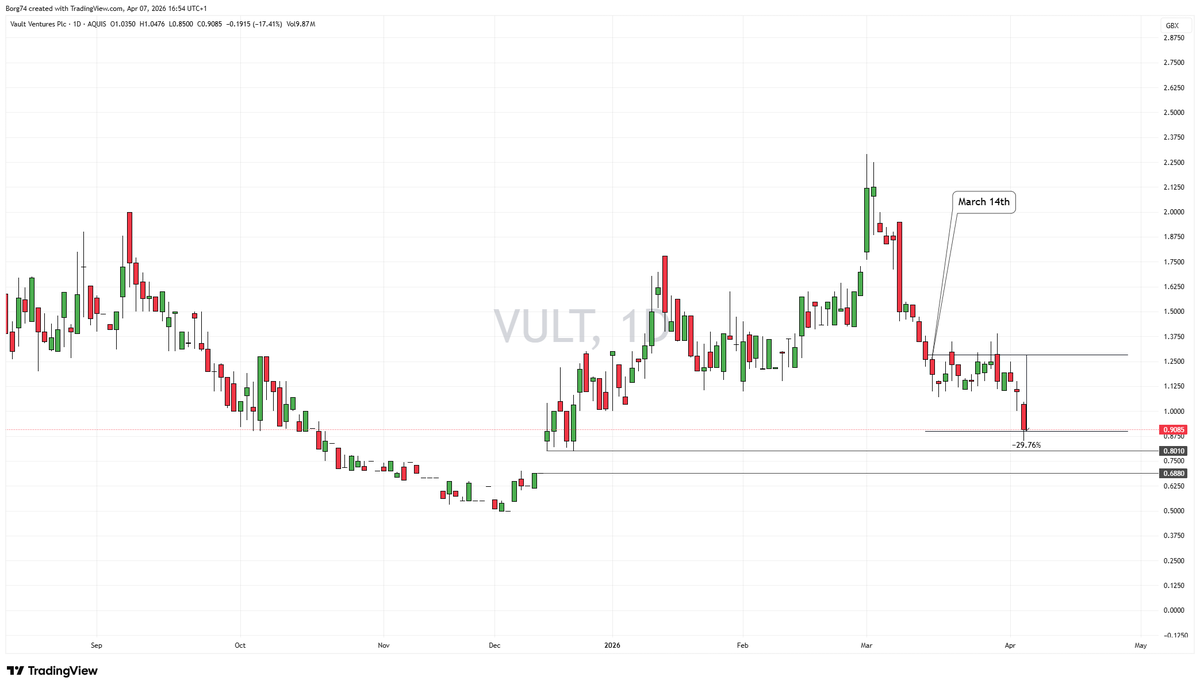
#VULT was 1.26 when i asked has price topped. Price now at 0.9085 and looking to fill the gap below

1
1
8
3,081
#VULT indeed price did fill the gap and more from the April 7th post. I wasn't convinced to buy and opted out.
1
2
1,073
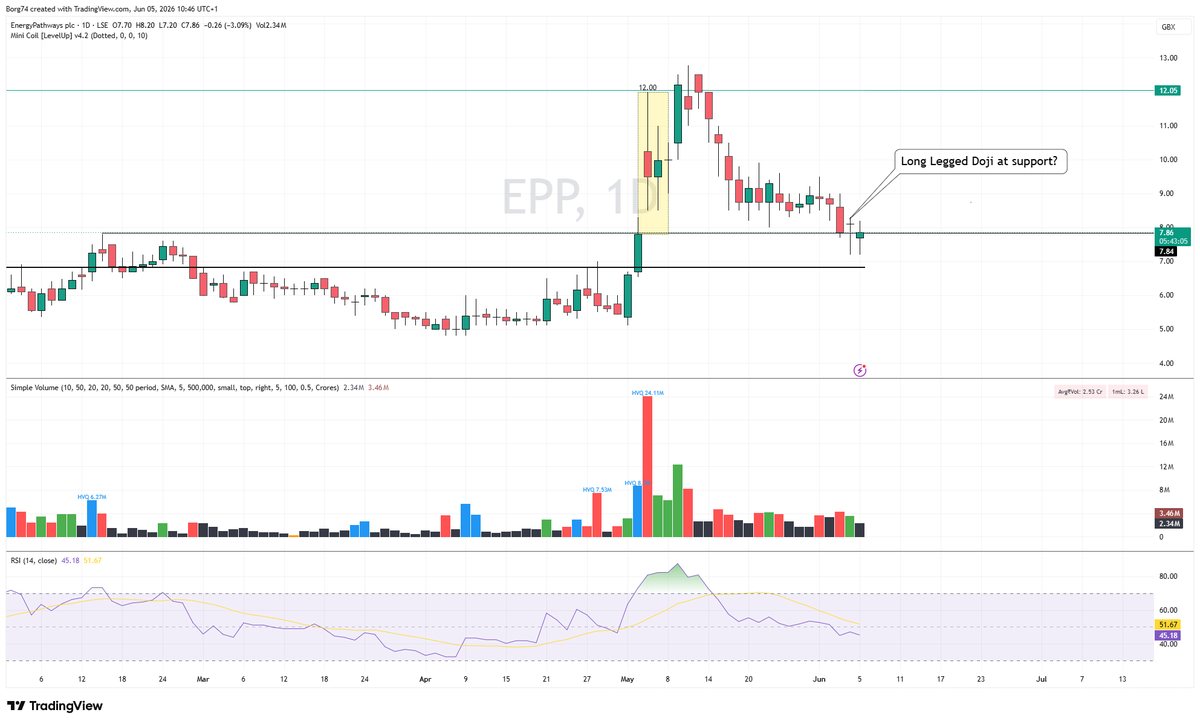
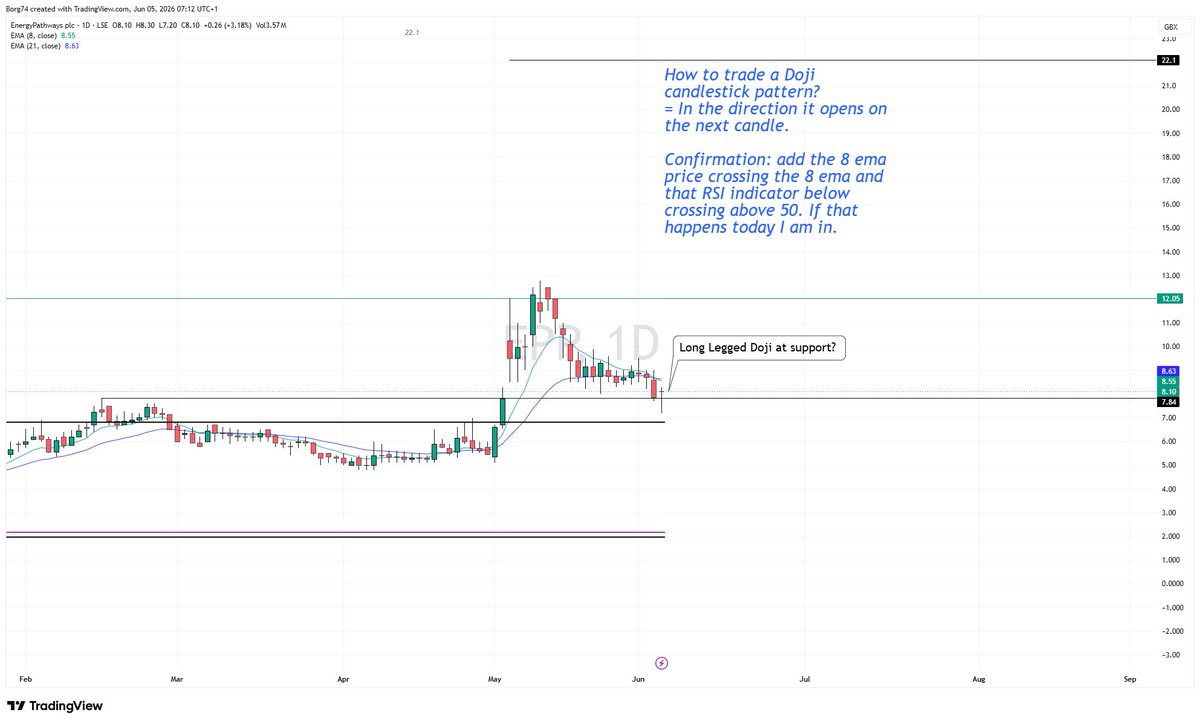
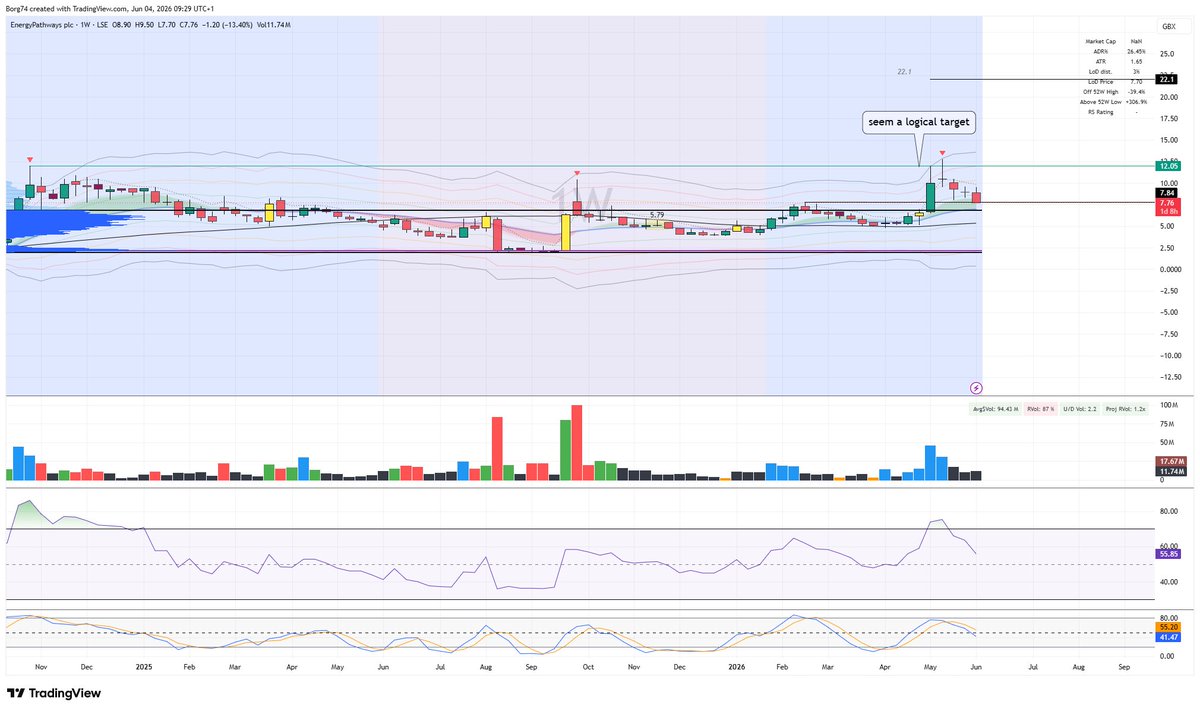
#EPP I am no AIM expert. In fact, if my track record is anything to go by, AIM stocks have probably been my least profitable trades.
That said, I do understand market psychology.
Today's intra-day drop is so far on relatively light volume. To me, that looks less like aggressive selling and more like a classic shakeout designed to test conviction and flush out weak holders.
If that's what's happening, don't be surprised to see the price recover quickly. When? Maybe Monday.
Market makers can be crafty buggers.
2
9
18
2,571
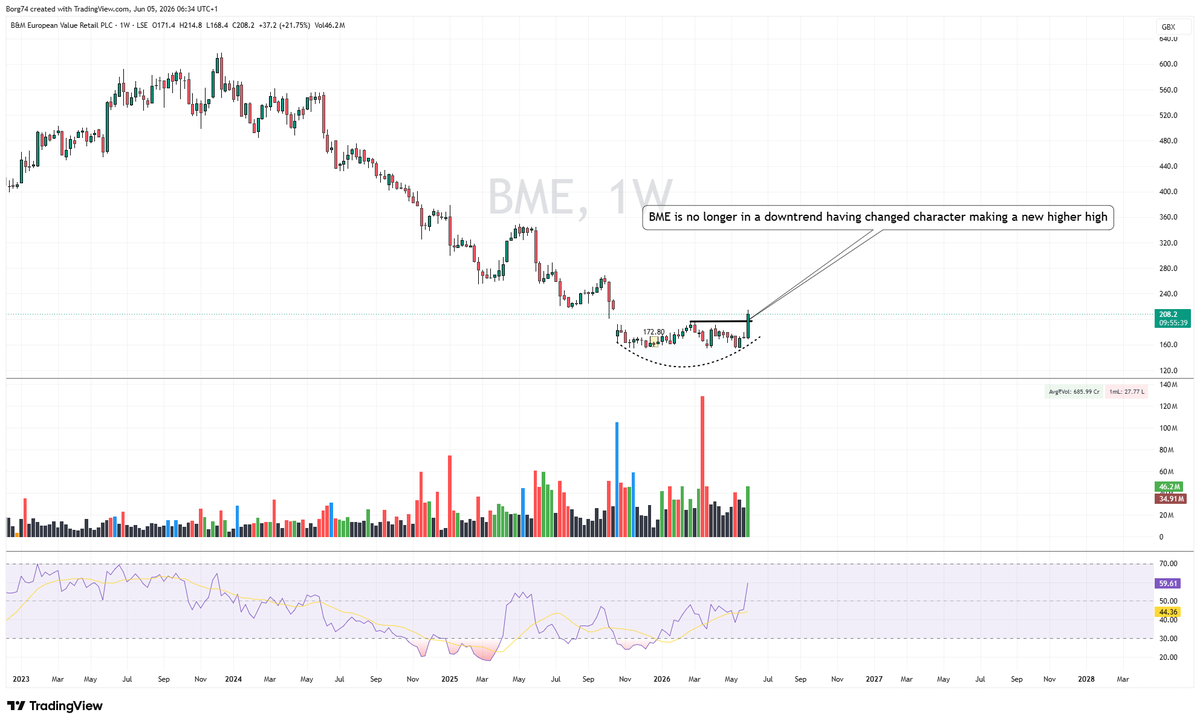
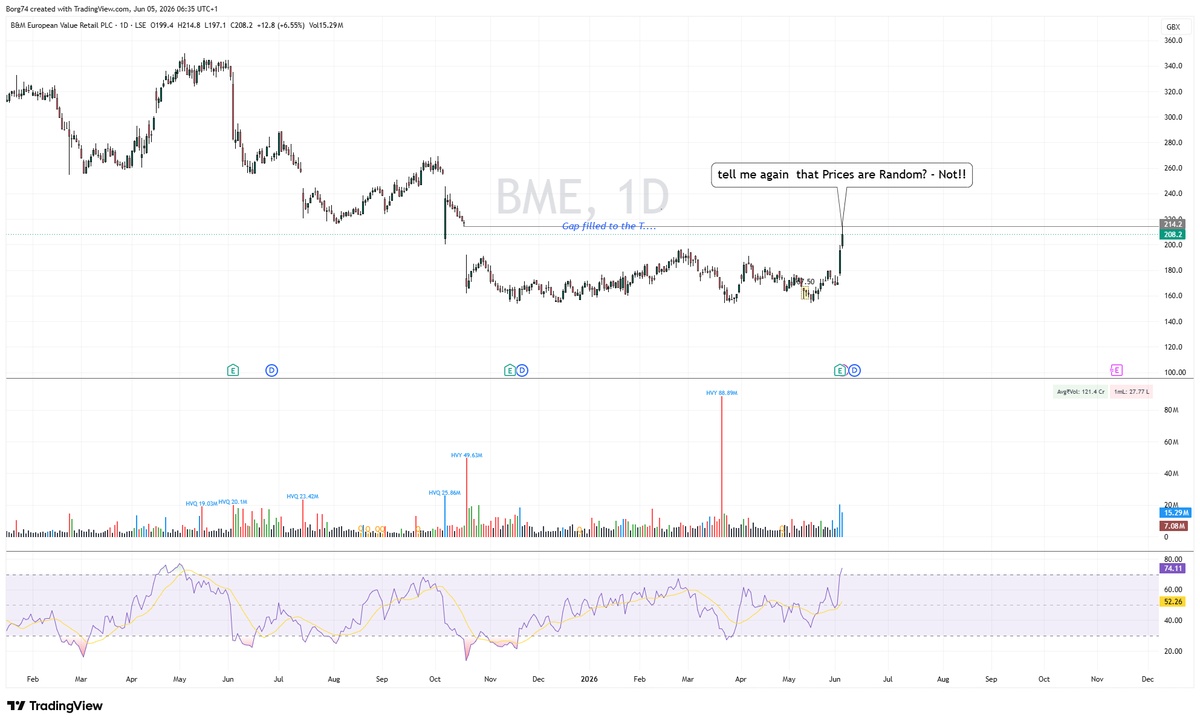
#BME no longer in a technical downtrend. Watch now for a potential early stage 2 development.
11
1,271
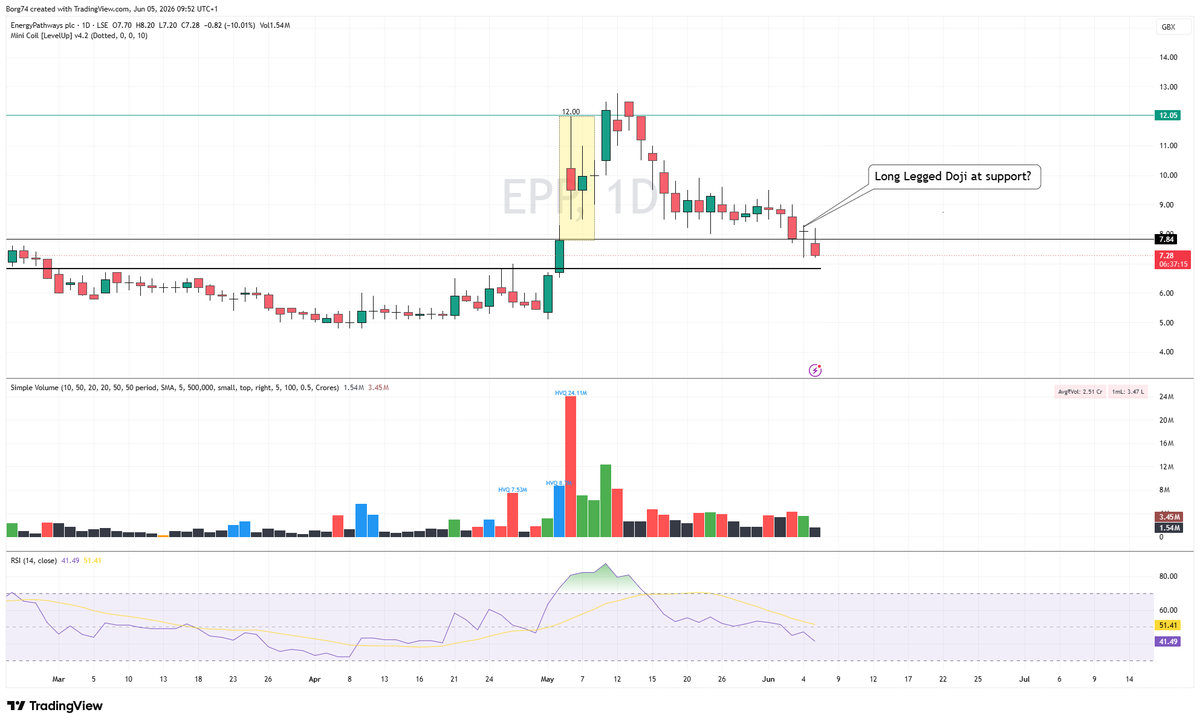
Watching #EPP having sold out on that sudden rise 1st week of May, I am waiting for a re-entry and a logical place would be the Breakout and retest level... I will look to position by tomorrow... Pullbacks on below average volume is what you want to see.
3
18
1,909
Goldman V*king Sachs⚔️ retweeted
Apr 26
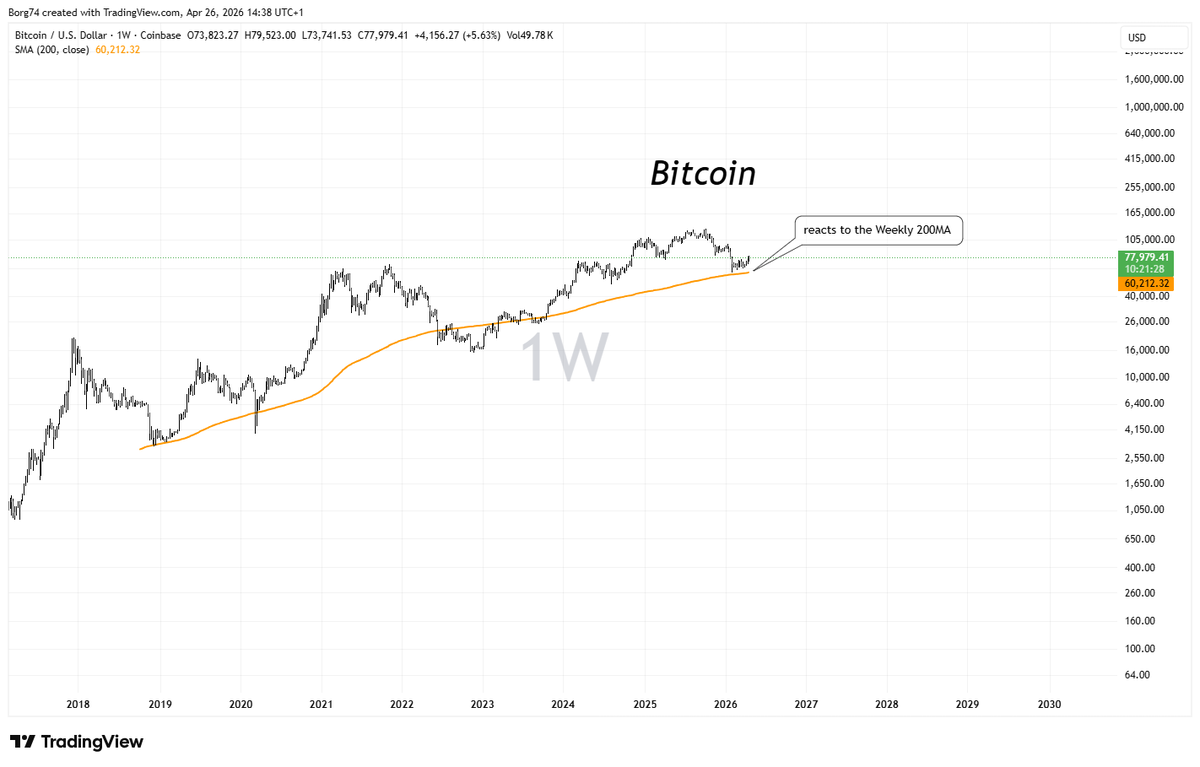
If you use the Weekly chart in addition to the 13/26ema or 10/30 simple (stan weistein) look at adding the 200MA and if you come across an asset class close to the 200MA watch closely. #Bitcoin you can cross reference with $MSFT or $PANW which have also reacted there.
1
7
2,138
May 28
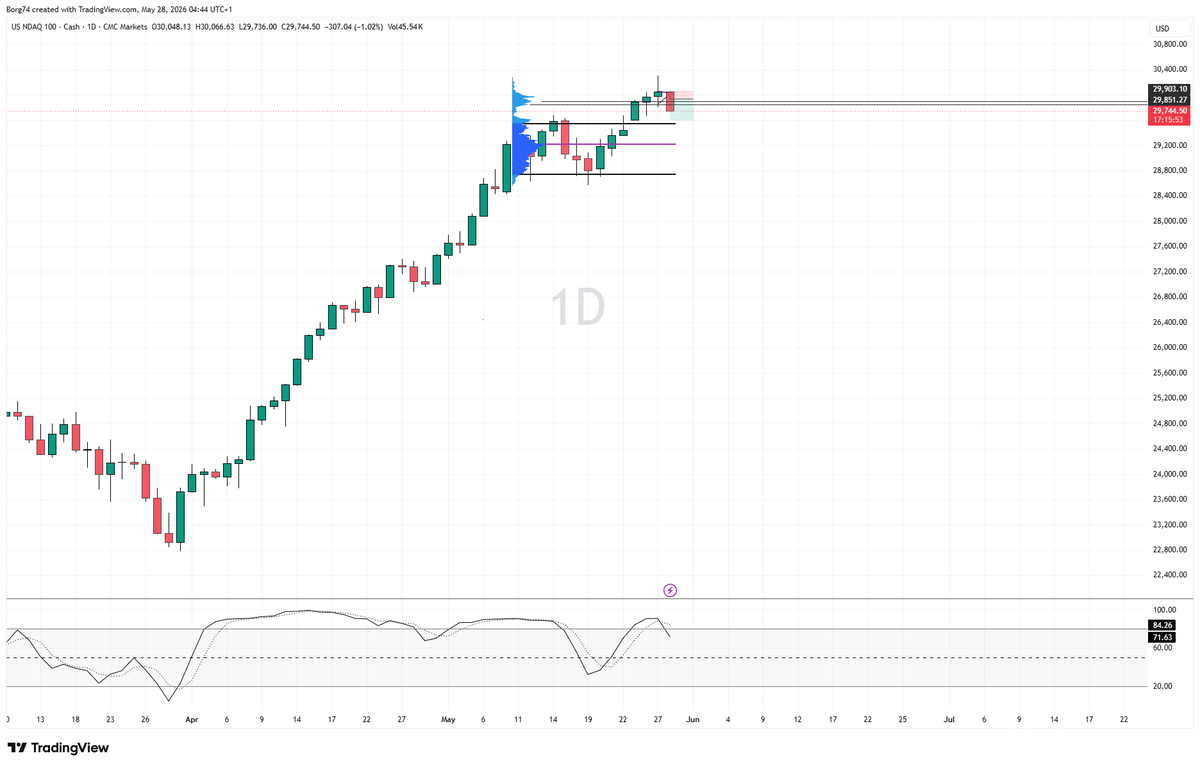
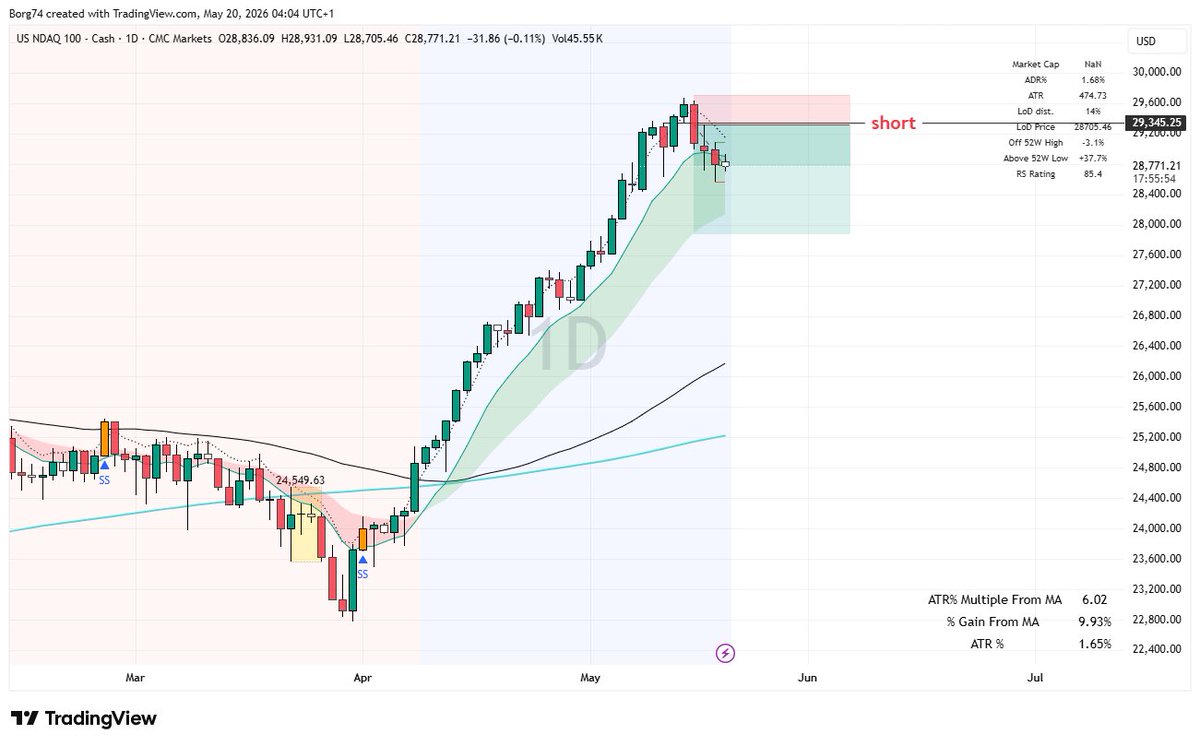
Selling Short #Nasdaq100 the concept is quite simple. Take price action as the emotional signals and combine that with a momentum filtering technique (Stochastic) to enhance the quality of signals generated from candle patterns. If you consider a common technical indicator for momentum such as the Stochastic %K and %D, you know that whenever the %K & %D rises above 80 (overbought), it is just a matter of time before it will drop back below 80 for a sell signal. I call this period when the %K and D are above 80 the Bearish Pre-Signal Zone. Thus, now if you also find a bearish reversal candle pattern (Evening Star) that occurs while %K and D are above 80, you are getting an emotionally driven sell signal prior to getting a technical based sell signal.
repeatable concept.. patience to execute. Be that Cheetah..

1
1
13
1,511
May 28
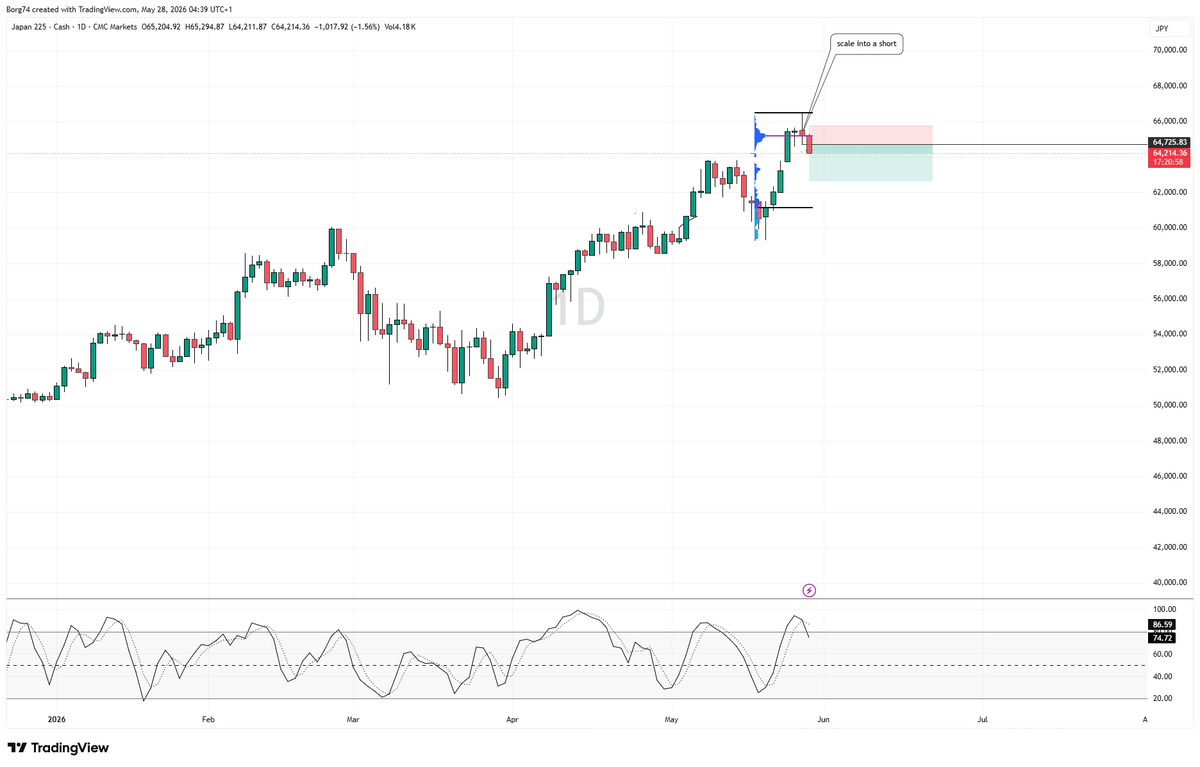
Selling Short #Nikkei The concept is quite simple. Take price action as the emotional signals and combine that with a momentum filtering technique (Stochastic) to enhance the quality of signals generated from candle patterns. If you consider a common technical indicator for momentum such as the Stochastic %K and %D, you know that whenever the %K & %D rises above 80 (overbought), it is just a matter of time before it will drop back below 80 for a sell signal. I call this period when the %K and D are above 80 the Bearish Pre-Signal Zone. Thus, now if you also find a bearish reversal candle pattern (Evening Star) that occurs while %K and D are above 80, you are getting an emotionally driven sell signal prior to getting a technical based sell signal.
1
6
1,080
Goldman V*king Sachs⚔️ retweeted

May 23
It's been a good week. Recent change of strategy and a new system that I have been working on with Mike at Mbtrading.
It's paying dividends after a lot of work. Identifying only quality set ups, less trades, but ultimately more profitable. Roll on next week!!
2
2
11
1,380
May 16
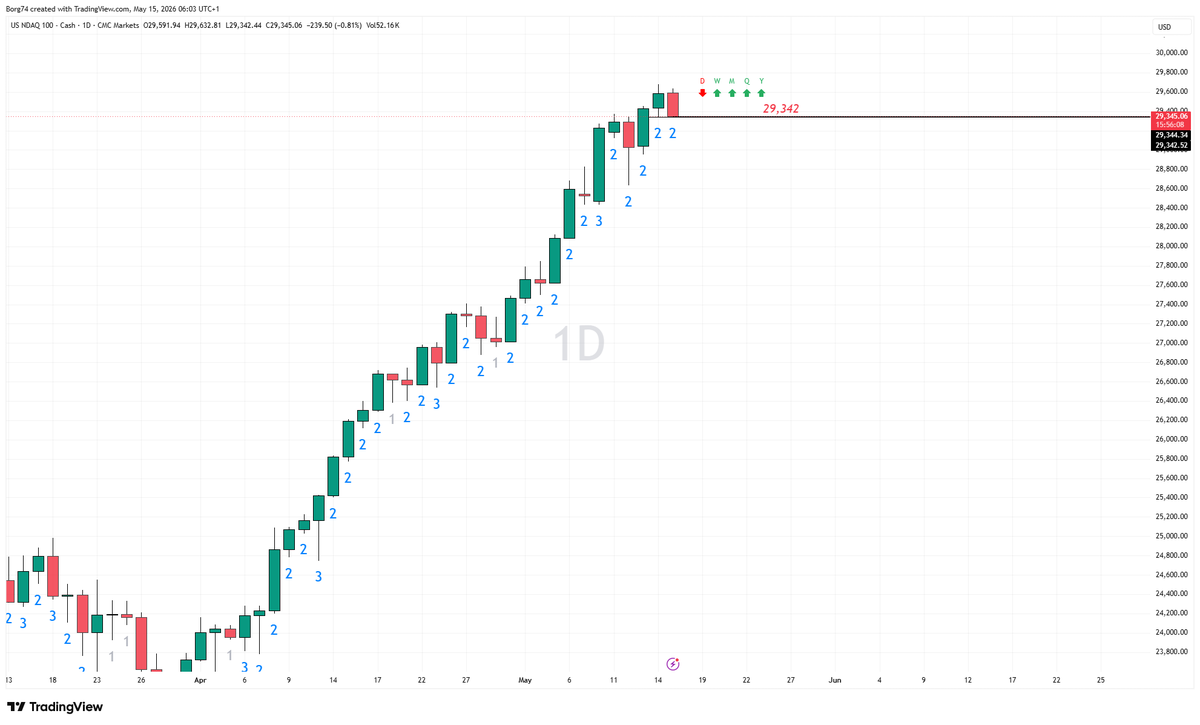
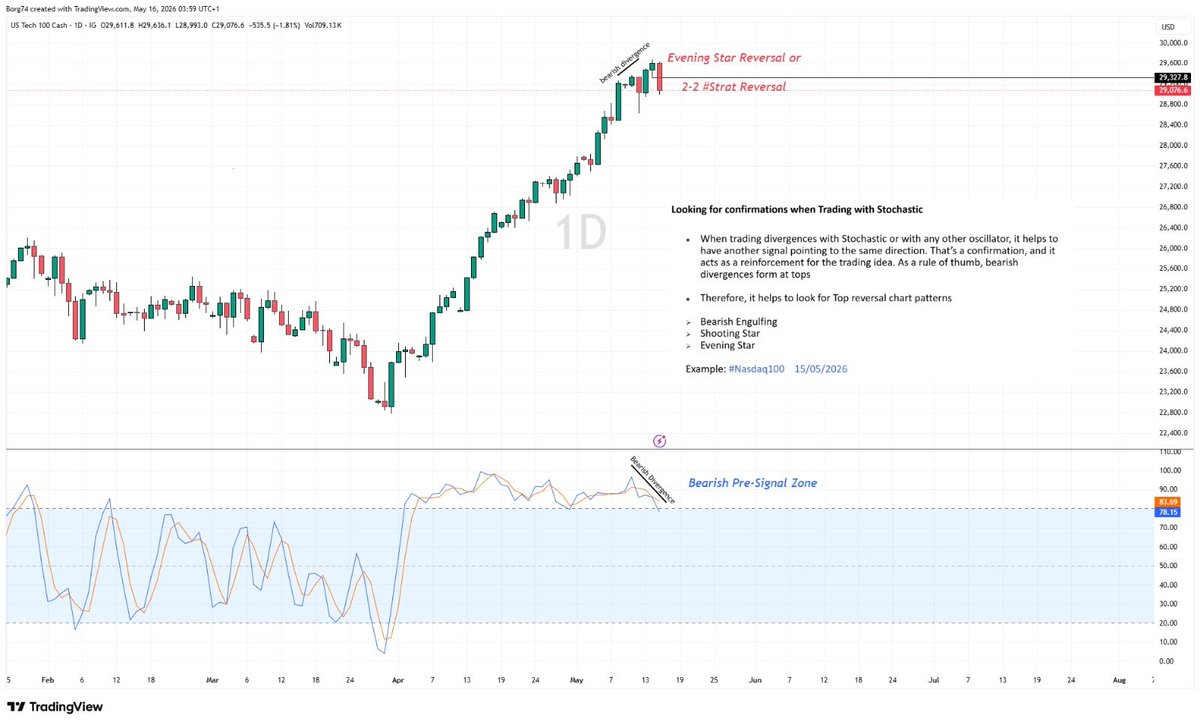
Selling Short - #Nasdaq100 The concept is quite simple. Take price action as the emotional signals and combine that with a momentum filtering technique (Stochastic) to enhance the quality of signals generated from candle patterns.
If you consider a common technical indicator for momentum such as the Stochastic %K and %D, you know that whenever the %K & %D rises above 80 (overbought), it is just a matter of time before it will drop back below 80 for a sell signal.
I call this period when the %K and D are above 80 the Bearish Pre-Signal Zone. Thus, now if you also find a bearish reversal candle pattern (Evening Star) that occurs while %K and D are above 80, you are getting an emotionally driven sell signal prior to getting a technical based sell signal.
I went short the Nasdaq yesterday on a Reversal candle with Bearish Divergence.
2
3
17
2,049